Previous--Garfield Prospect, Lippelmann Field, Decatur County || Next--Roland SE Field, Rush County
Double Eagle Enterprises
This article available as an Acrobat PDF file (4 Mb).
The stratigraphy of the Morrow Series in southwest Kansas consists of sandstones and shales, with the shales acting as source and seal and the sandstones forming the reservoir facies. Within the Minneola complex, the upper limit of the Morrowan is defined by the base of the "Thirteen Finger limestone" (where present) or the base of the Inola limestone. The base of the Morrowan is the Mississippian-Pennsylvanian unconformity (fig. 1). The Morrowan interval ranges from 5 to 120 ft (2 to 37 m) in thickness in the Minneola complex (fig. 2) and thickens south-southwest toward the Anadarko basin.
Figure 1--Idealized stratigraphic section for Minneola in northern Clark and southern Ford counties, Kansas.
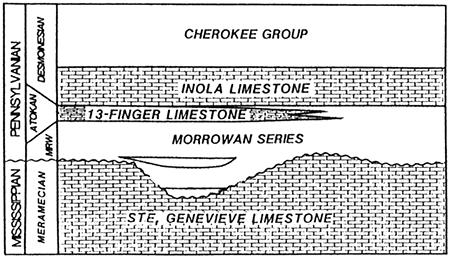
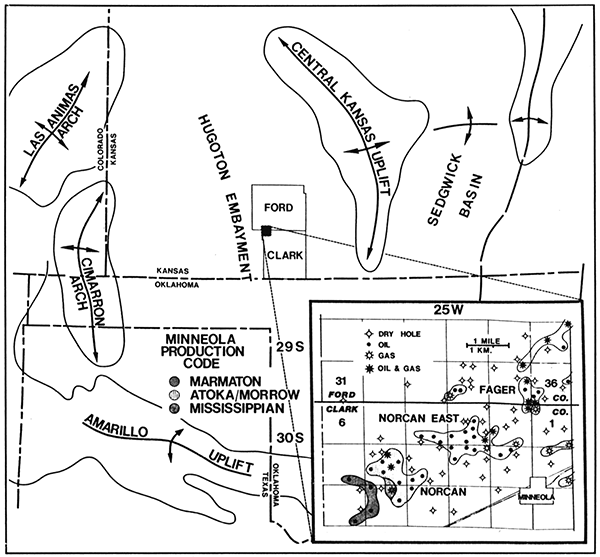
Figure 2--Index map of study area showing major tectonic features. Individual fields and associated production of Minneola complex are shown in insert.
The Morrowan sandstones and siltstones are lenticular and range in thickness up to 15 ft (5 m). The sandstones are very fine grained, clean, subrounded to rounded, cemented by calcite, and commonly glauconitic (Robinson, 1983). Quartz averages over 90% of the framework minerals, chert averages 3%, and glauconite, feldspar, and sedimentary rock fragments account for 1 % or less of the total volume. The framework minerals are cemented by ankerite, calcite, quartz, clay minerals, and pyrite, of which carbonate minerals and quartz are the most common. Associated interbedded shales and siltstones are dark gray to black, ranging from 20 to 50 ft (6 to 15 m) in thickness. Occasionally, at the base of the Morrowan, a conglomeratic sandstone up to 20 ft (6 m) thick is present. Porosities range normally 1-4% in the unproductive tight sands and 12-18% in the productive sands.
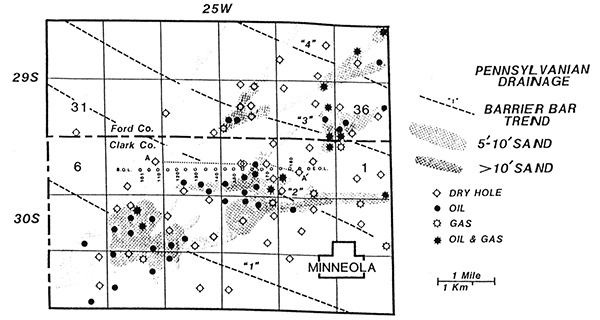
At the close of Mississippian-Chesteran time, the sea regressed and the northern shelf of the Anadarko basin was subaerially exposed. Fluvial drainage systems developed in the Early Pennsylvanian around the flanks of the Hugoton embayment and on the northern shelf of the Anadarko basin; sediment was eroded from the Central Kansas uplift and transported into the area. Marine transgression into the area during Morrowan time resulted in the deposition of conglomeratic basal sandstones and marine shales. Following several transgressive-regressive cycles and the deposition of sporadically distributed lower and middle nonproductive Morrowan sandstones, the uppermost and major productive Morrowan sandstone was deposited during the final transgressive phase. Figure 3 illustrates the thickness and distribution of the productive sandstones in the study area.
Figure 3--Major Lower Pennsylvanian drainages as interpreted from seismic. Barrier-bar sand accumulations and trends marked "1," "2," "3," and "4" are mapped from well control in Clark and Ford counties, Kansas.
These uppermost productive Morrowan sandstones have been interpreted by Doyel (1985) to be strike-valley sandstones, reworked and redeposited in a marginal marine environment during the transgression of Early Pennsylvanian seas. Busch (1974) described the geometry of strike-valley sandstones as 1) being controlled by predepositional topography of tilted alternating resistant and nonresistant strata, 2) lengths up to "many" (Busch, 1974) miles for individual sand bodies, 3) very asymmetric in cross sections having a teardrop profile, and 4) having widths ranging from 0.5 to 1 mi (0.8 to 1.6 km). Morrowan sandstone geometry in the Minneola complex fails to satisfy three of four of Busch's (1974) geometric criteria for strike-valley sandstones.
Within the study area, the Morrowan sandstones and shales lie unconformably on the lithologically uniform, resistant Ste. Genevieve Limestone. Subsurface mapping indicates that the predepositional topography of the Mississippian surface locally was eroded not into escarpments or cuestas that parallel strike, but into a gently sloping surface cut by Early Pennsylvanian drainage channels, which roughly parallel present-day regional dip to the south-southwest. Regionally, the geologically ideal location for the deposition of strike-valley sandstones would be on the alternating resistant-nonresistant strata of the Mississippian Chester formation, which subcrops approximately 6 mi (10 km) south of the study area. In contrast to strike-valley sandstones, the Morrowan sandstones in the study area are rarely laterally continuous along strike for more than 1-1.5 mi (1.6-2.4 km). In addition, the sandstones are symmetric and lenticular or podlike rather than asymmetric and teardrop in configuration (fig. 3). The sandstones maintain widths ranging from 0.5 to 1 mi (0.8-1.6 km). Although the stratigraphy is consistent with marginal marine deposition, the geometric inconsistencies open the possibility for other depositional model alternatives.
The uppermost productive Morrowan sandstones in the study area are interpreted to be barrier bars or shelf sandstones (Tillman et al., 1985) deposited during stillstands of a transgressive sea. The barrier bar sandstones deposited during stillstand "2" of fig. 3 are represented in the stratigraphic cross section of fig. 4. These sandstones are 5-15 ft (2-5 m) thick and are best preserved within the former fluvial channels due to differential compaction during deposition. Deposition of the sandstones on Mississippian highs outside the channels resulted in very thin (less than 5 ft or 2 m), tight sandstone. The barrier bar sandstones were covered by marine shales and marine shelf carbonates of the Cherokee Group as transgression continued.
The Minneola complex, located in northwestern Clark and southwestern Ford counties, Kansas, consists of northeast-south west-trending oil fields that produce almost entirely from sandstones of Morrowan age: Norcan, Norcan East, and Fager fields. The complex currently consists of 54 producing oil and gas wells, of which 50 wells produce from Morrowan sandstones at depths of 5,100-5,300 ft (1,554-1,615 m). Here, the sandstones range in thickness from 3 to 16 ft (1-5 m). Two Morrowan wells have some minor commingled gas production from the Mississippian. The remaining four wells produce oil from limestones in the Marmaton Group. Closure is present on these limestones as a result of draping over Mississippian erosional remnants. Total recoverable reserves for the Minneola complex are estimated to be 2.5 million bbl of oil and 6 billion ft3 of gas. Morrowan sandstone production was first established in southeast Clark County, Kansas, with the discovery of the Harper Ranch field in 1953. Discovery of the Lexington field in east-central Clark County by Mesa Petroleum in 1977 extended Morrow production approximately 20 mi (32 km) north. The discovery by Ladd in 1980 of the Minneola complex extended known Morrowan sandstone production 25 mi (40 km) west.
The Morrowan sandstones at Lexington field and the Minneola complex accumulated under similar conditions. The thickest Morrowan sandstones were deposited in narrow channel cuts on the weathered, eroded Mississippian surface, a situation which created excellent stratigraphic traps for petroleum accumulations. Early exploration drilling by Mesa at Lexington for these traps was primarily guided by limited subsurface control. However, seismic data became increasingly important as development drilling proceeded at the Lexington field after Morrowan production was found to be associated with seismic anomalies. The discovery well in the Minneola complex, Ladd 1-8 Norton, sec. 8, T. 30 S., R. 25 W., was drilled on an anomaly (recognized on l2-fold Vibroseis seismic) similar to those drilled at Lexington field. Subsequent development drilling in the Minneola complex relied on the integration of seismic data with subsurface geologic analysis.
The locations of the five wells incorporated into the geologic cross section (fig. 4) and the example seismic section (see fig. 8) are superimposed in fig. 3. All five wells are within 330 ft (100 m) of the seismic line and penetrate the Mississippian limestone. The cross section illustrates the relationship between productive/potentially productive 50-100 ft (15-30 m) channel cuts and the nonproductive regionally thin, less than 20-ft (6-m) Morrow shale-filled section.
Figure 4--Structural cross section showing the stratigraphic/depositional relationships of individual Morrowan sandstones. Section datum is -2700 ft (-823 m). Location of cross section shown in fig. 3.
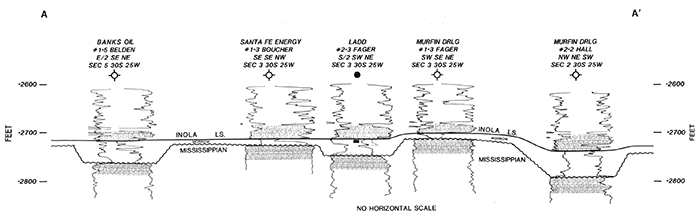
The westernmost well, Banks Oil #1-5 Belden, cuts approximately 50 ft (15 m) of Morrow channel fill and encountered 6 ft (2 m) of middle Morrowan nonproductive wet sandstone. Nearly 8,000 ft (2,460 m) to the east, the Santa Fe #1-3 Boucher is stratigraphically high on the Mississippian and encountered no Morrowan sandstone. The central well 990 ft to the east, Ladd #2-3 Fager, encountered approximately 10 ft (3 m) of Morrowan sandstone, which was deposited in a 40-ft (12-m) channel and initially produced 246 BOPD. The Murfin #1-3 Fager, 990 ft (305 m) east, is stratigraphically high and again encountered no productive Morrowan sand. The easternmost well, the Murfin #2-2 Hall, cuts 56 ft (17 m) of Morrow channel fill but encountered no productive Morrowan sandstone.
Based on the depositional model, drilling in Early Pennsylvanian channels is no guarantee that upper sandstones will be encountered. Between still-stands, marine shales and fine siltstone were deposited. These depositional relationships are illustrated in fig. 4 by the poorly developed upper sandstone in the Banks Oil #1-5 Belden and the Murfin #2-2 Hall, both of which were drilled on either side of a productive upper Morrowan sandstone. The nonproductive fine siltstones and sandstones found in these wells are tight (5% porosity) since they were not reworked during deposition.
Determining the position of the Mississippian-Pennsylvanian unconformity on the regional seismic data is critical. To perform this task, synthetic seismograms were generated from available sonic logs and tied to the seismic line. Once the position of the Mississippian-Pennsylvanian unconformity on the seismic data is established, anomalous changes in wavelet character (amplitude, frequency, and polarity) along this interface can be identified and mapped. Changes in lithology and thickness in the Morrowan section are associated with seismic anomalies in the Minneola complex.
Exploration and development success was contingent upon recognizing several seismic anomalies associated directly with the Lower Pennsylvanian drainage and the stratigraphy of the Morrowan section. These anomalies, listed in order of relative importance, are 1) diffractions, 2) amplitude anomalies, 3) polarity reversals, 4) sagging of the Marmaton reflector due to differential compaction, and 5) breakup or faulting of underlying Viola-Arbuckle reflectors. Note that the appearance of these anomalies is highly influenced by the angle at which the seismic data was shot in relation to the channel cut, the thickness and type of sediment (percentage of shale vs. percentage of limestone), and the morphology of the Lower Pennsylvanian channels, that is, those with steep sides vs. those with gentle slopes.
Figures 5, 6, and 7 represent the geologic input, seismic responses, and vertical incident ray tracing from an underlying reflector, respectively, of an idealized geologic model of an asymmetrical channel filled with Morrowan clastics. The channel depicted in fig. 5 is 60 ft (18 m) deep on the left, thinning to 20 ft (6 m) on the right. The channel is filled with shale and 10 ft (3 m) of sandstone overlying the shale. The model was run on an IBM-PC compatible Mira System using Mira software. After reflection coefficients were generated, they were convolved with zero-phase 14-65 Hz bandpass wavelet and plotted at normal polarity to match processing parameters of proprietary seismic data.
Figure 5--Idealized geologic and velocity model of Early Pennsylvanian channel found in Minneola complex filled by Morrowan sandstones and shales.
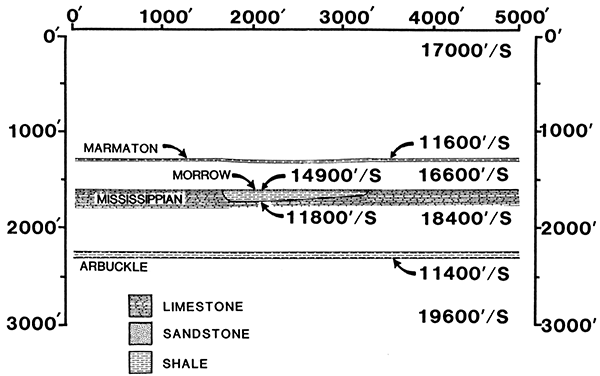
Figure 6--Seismic response of geologic-velocity model of fig. 5, illustrating anomalies associated with Minneola complex.
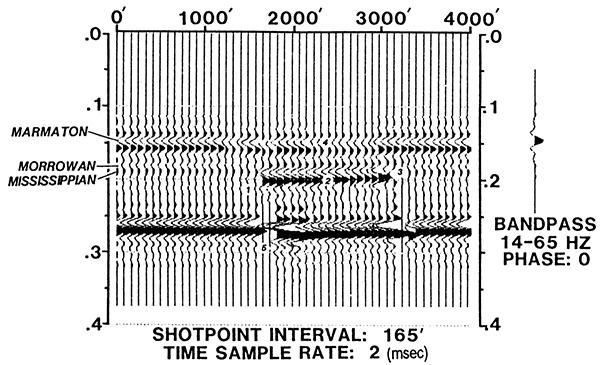
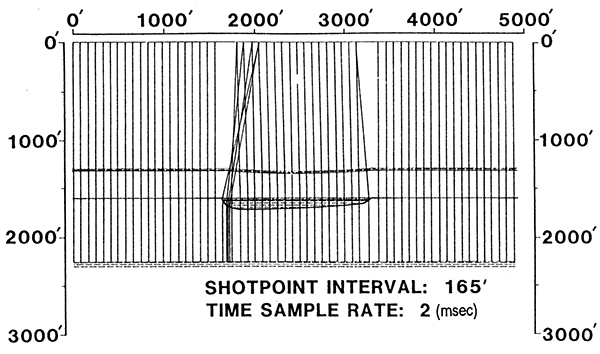
Figure 7--Normal-incident ray tracing from Viola-Arbuckle reflectors illustrating convergent ray paths caused by edges of steep-sided channels.
The first anomaly, diffractions (marked #1 on fig. 6) caused by the sharp channel edges that act as a point source (Trorey, 1961), is the most noticeable feature on the seismic line. Unfortunately, the Mira ray-trace modeling program currently does not have the capabilities for generating diffractors. However, Neidell and Poggiagliolmi (1977) discussed the wave-theory model response for sandstone bodies of varying lateral extent and their relationship to Fresnel zone size. This work is directly related to the generation of diffractions caused by channel edges currently observed on seismic data. (A field example will be reviewed in detail.)
The second anomaly (marked #2 on fig. 6), a high-amplitude bright spot, is present between 1,670 and 3,000 ft (509 m and 914 m) at 200 msec on fig. 6. This anomaly is caused by increased acoustic impedance due to additional slower velocity sands and shales filling the channel and overlying faster Mississippian limestones. Normally, the interface between the Cherokee and Morrowan shales (10 ft or 3 m or less) and the Mississippian is a very weak seismic event. The addition of low-velocity sands and shales in the Early Pennsylvanian channels causes a strong acoustic interface with the Mississippian limestones, resulting in localized amplitude anomalies. Note that as channel depth decreases and the clastic fill thins, the bright spots decrease in amplitude.
In conjunction with amplitude anomalies, apparent polarity reversals (marked #3 on fig. 6) are observed at the channel edges at the top of Mississippian reflectors (fig. 6). The Cherokee-Morrowan-Mississippian reflector, which is normally a very weak peak, becomes a strong trough over the Early Pennsylvanian channels at 190 msec. This change is due again to the additional 60-100 ft (18-30 m) of clastic section in the channel and results in an 8-12-msec time shift or polarity reversal. Diffractions, strong amplitudes, and polarity reversals are the most frequently observed anomalies associated with pre-Pennsylvanian channels.
The other two anomalies are less commonly observed. The first is the sagging and loss of amplitude in the overlying Marmaton reflector (marked #4 on fig. 6). This sagging (at 155 msec on fig. 6) is in response to differential compaction of sediments deposited over more compactible shales and sands deposited within the channel. The second of these less commonly observed seismic anomalies is the breakup and/or faulting of the Viola-Arbuckle reflectors at 260 msec (marked #5 on fig. 6). These reflectors are generally a continuous, strong peak-trough-peak sequence located approximately 103 msec below the top of the Mississippian event. The cause for the breakup of these seismic events is not clear. Faulting or fracturing in the pre-Pennsylvanian section possibly controlled development of the Early Pennsylvanian drainage patterns. Fault systems interpreted on Ladd proprietary seismic data several miles southwest of the Minneola complex appear to be associated with the Early Pennsylvanian drainage patterns. A second explanation for the apparent "faulting" below channels is seismic ray-path geometry. Seismic ray-trace modeling indicates imaging problems occur as wave fronts (returning from underlying reflectors) encounter the edges of deep, steep-sided channels (fig. 7). This encounter causes "breaks" in the underlying Viola-Arbuckle reflectors which, although they appear to be faults in fig. 6 at 270 msec, are in fact the product of ray-path geometry.
Although many examples of the previously described anomalies have been identified on the available seismic data base, the following example was chosen based on its proximity to well control. The seismic line is 12-fold, consisting of a 20-100 Hz upsweep and three inline vibrators. The array was 48 channel, with 165-ft (50-m) group and 330-ft (100-m) shotpoint intervals. The location of the line (fig. 3) cuts nearly perpendicularly to several Early Pennsylvanian channels and passes 330 ft (101 m) south of four key wells and 330 ft (101 m) north of the other.
Figure 8 is the unmigrated final stack (migrated data were not available). The interval of interest is located between 950 and 1,000 msec, with the top of the Mississippian at approximately 970 msec. Accurately identifying the top of the Mississippian is important to avoid misinterpretation of Early Pennsylvanian channeling anomalies. This section has several key anomalies associated with Early Pennsylvanian drainage. The first example is the amplitude anomalies located at both the eastern and western ends of the line, SP 103-110 and SP 178-188 at 980 msec, which correspond to Early Pennsylvanian channel cuts identified on the geologic cross section. The amplitude anomalies (indicated by #1 on fig. 8) associated with the Banks #1-5 Belden and Murfin #2-2 Hall wells indicate that additional clastic section was deposited locally in a channel cut. Modeling indicates amplitude anomalies associated with Early Pennsylvanian channeling events are dependent upon several of the following variables: 1) depth of channel cut, 2) types of lithologies filling the channel, and 3) the types and variability of overlying and underlying lithologies. Diffractions (indicated by #2 on fig. 8) appear to be associated with the Banks #1-5 Belden well, which suggests a sharp channel cut. Both anomalies located on either side of the seismic line have polarity reversals (indicated by #3 on fig. 8) present at the channel edges at the top of the Mississippian reflector. The second example is located between SP 155 and SP 170 at 980 msec. The convex shape of the reflector suggests diffractions off the channel edges. Proper migration of these data will collapse those diffractions into their correct orientation and reduce the risk of missing the channel by drilling diffraction events on nonmigrated data.
Figure 8--East-west seismic line illustrating examples of diffractions, amplitude anomalies, and polarity reversals associated with Lower Pennsylvanian channeling. Stippled pattern marks Mississippian/Pennsylvanian unconformity.
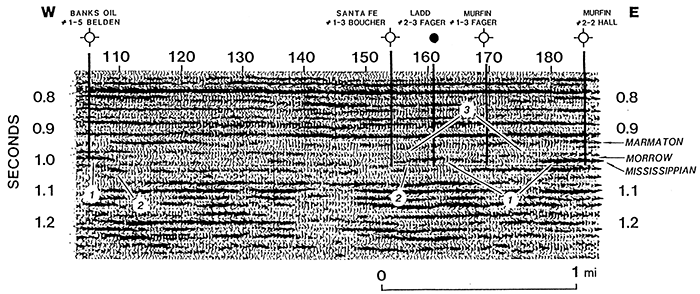
The amplitude of this event would be further enhanced by migration, which would move additional energy into its proper location. The weakness of amplitude in this case is due to the fact that only 20 ft (6 m) of additional Morrow section was deposited in this shallow cut and higher velocity sandstone replaces lower velocity shale, reducing the reflection coefficient of the event. Modeling indicates strong amplitude events do not occur until more than 50 ft (15 m) of additional clastic section is deposited. This is the case at the Banks and Murfin wells located at the far ends of the cross section.
The abrupt break in the weak peak that marks the top of the Mississippian contrasts sharply with the strong trough over the channel event (fig. 8). This apparent polarity reversal is attributed to the increased thickness of sandstones and shales found in the Morrowan channel as opposed to adjacent faster velocity Mississippian limestones. This particular seismic line does not illustrate either sagging of the overlying Marmaton events or the breakup and/or faulting of the underlying Viola-Arbuckle reflectors.
Oil and gas production in the fields of the Minneola complex are controlled by the development of reservoir-quality Morrowan sandstones. Sandstone development was controlled by the interaction of two geological events. First, during regression of the Mississippian Chesterian sea, fluvial drainage channels were incised into the Mississippian limestone surface; later, cyclic Early Pennsylvanian marine transgressions caused the deposition of marine sandstones, the greatest thicknesses of which were concentrated in lows in the earlier developed drainage patterns. The paleodrainage systems are manifested on CDP seismic data as a variety of anomalies: 1) diffractions, 2) amplitude anomalies, 3) apparent polarity reversals, 4) sagging of overlying reflectors, and 5) apparent "faulting" in the pre-Mississippian section.
Busch, D. A., 1974, Stratigraphic traps in sandstones-exploration techniques: American Association of Petroleum Geologists, Memoir 21, p. 67-71
Doyel, D. R., 1985, Norcan field study; in, Kansas Oil and Gas Fields, v. 5: Kansas Geological Society, p. 215-222
Neidell, N. S., and Poggiagliolmi, E., 1977, Stratigraphic modeling and interpretation-geophysical principles and techniques; in, Seismic Stratigraphy--Applications to Hydrocarbon Exploration, C. E. Payton, ed.: American Association of Petroleum Geologists, Memoir 26, p.389-416
Robinson, R. J., 1983, Geochemical investigation of diagenetic history of Pennsylvanian Morrowan sandstone, Lexington field, Clark County, Kansas; M. S. thesis, Kansas State University, Manhattan, 66 p.
Tillman, R. W., Swift, D. J. P., and Walker, R. G., 1985, Shelf sands and sandstone reservoirs: Society of Economic Paleontologists and Mineralogists, Short Course Notes 13,708 p.
Trorey, A. W., 1961, A simple-theory for seismic diffractions: Geophysics, v. 35, p. 762-784
Previous--Garfield Prospect, Lippelmann Field, Decatur County || Next--Roland SE Field, Rush County
Kansas Geological Survey
Comments to webadmin@kgs.ku.edu
Web version placed online Sept. 4, 2015. Original publication date 1995.
URL=http://www.kgs.ku.edu/Publications/Bulletins/237/Clark/index.html