Kansas Geological Survey, Bulletin 233, p. 63-99
by
Paul Enos
Department of Geology, University of Kansas
The sedimentary parameters that are most important in modeling sedimentary sequences and geometry are accumulation rate, lag time, and accommodation space. Each parameter incorporates several other variables. Accumulation rate is the net result of sediment input and in situ production (for carbonates) less export through bypass or erosion. The appropriate accumulation rate to be chosen from the vast amount of data available will depend on depositional environment, basinal asymmetry, climate, tectonic setting, and the time increment being modeled. Lag time expresses the necessary condition for a transgressive sequence: that the initial sediment accumulation rate is less than the rate of submergence or accommodation. Mechanisms are not well understood; the potential for sediment production in shallow-water carbonate environments, for example, generally exceeds known rates of submergence. Biologic factors may reduce sediment production rates in shallow water, but a physical threshold, such as the wave base, above which accumulation is suppressed, seems more probable. Accommodation space is the increment of room available for sediment accumulation as determined by eustasy, subsidence, and erosion. Subsidence, in turn, incorporates tectonism, isostasy, and physical and chemical compaction. Lag time, compaction rates induced by pressure solution, and the interaction of siliciclastics and carbonates are probably the least constrained variables.
An Acrobat PDF file containing the complete paper is available (2.4 MB).
A treatise on improved parameter definitions logically begins with a review of simulation programs to extract the input parameters and critical assumptions, which can then be neatly arrayed in a table. The profusion of available programs, the result of exponential growth from roots in the 1960's [cf. Harbaugh (1966) and Harbaugh and Bonham-Carter (1970)], is such that the table alone would probably exceed the intended length of this article [cf. Aigner et al. (1988), Bice (1988), Bosence and Waltham (1990), Bridge and Leeder (1979), Demicco and Spencer (1989), Harris (1989), Helland-Hanson et al. (1988), Jervey (1988), Koerschner and Read (1989), Lawrence et al. (1990), Lerche et al. (1987), Read et al. (1986), Scaturo et al. (1989), Spencer and Demicco (1989), and Watney et al. (1989)]. The input end of simulation and the other ends as well are reviewed by Kendall et al. (this volume). In this article I focus on sources of precise values for the parameters that most influence the geometry and facies of a simulated sedimentary sequence: accumulation rate, lag time, and accommodation space. Each parameter incorporates other variables. Accumulation rate depends on sediment input and on in situ production in carbonate environments versus sediment removal by erosion and bypassing. Lag time may be the result of biologic or physical thresholds, and accommodation space is the net of eustasy, subsidence, and erosion.
Table 1--Modern sedimentation rates from various depositional settingsa
| Area | Rate (B)b | Period (yr)c | Reference |
|---|---|---|---|
| Fluvial environments | |||
| *Lower Ohio R., natural levee, 1964 flood | 460,000 | 1 | Bridge & Leeder, 1979 (Alexander & Prior, 1971) |
| *Ohio R. floodplain, 1937 flood average | 70,000 | 1 | Bridge & Leeder, 1979 (Mansfield, 1938) |
| *Ohio R. floodplain, 1937 flood range | 3,000-560,000 | 1 | Bridge & Leeder, 1979 (Mansfield, 1938) |
| Lower Ohio R., natural levee | 16,000 | 40 | Bridge & Leeder, 1979 (Alexander & Prior, 1971) |
| Lower Ohio R., natural levee | 10,000 | 750 | Bridge & Leeder, 1979 |
| Lower Ohio R., accretionary ridge | 6,000 | 1,000 | Bridge & Leeder, 1979 |
| Ohio R. floodplain | 4,500 | 150 | Schindel, 1980 (Moore, 1971) |
| *Lower Ohio R., accretionary ridge, 1964 flood | 3,200 | 1 | Bridge & Leeder, 1979 (Alexander & Prior, 1971) |
| Lower Ohio R., swale | 1,900 | 1,000 | Bridge & Leeder, 1979 |
| Lower Ohio R., accretionary ridge | 270 | 1,000 | Bridge & Leeder, 1979 |
| Yuba R., California | 100,000 | 1 | Kukal, 1971 |
| Sacramento R., California | 75,000 | 1 | Kukal, 1971 |
| Cimarron R., Maryland, floodplain | 51,000 | 12 | Schindel, 1980 (Schumm & Lichty, 1963) |
| Western Run, Maryland, floodplain | 16,300 | 50 | Schindel, 1980 (Costa, 1973) |
| Nile R., floodplain | 9,000 | 1 | Kukal, 1971 |
| Nile R., floodplain, range | 9,100-12,200 | 1,000 | Bridge & Leeder, 1979 (Leopold et al., 1964) |
| Delaware R. floodplain | 140-1,150 | 6,000 | Schindel, 1980 (Ritter et al., 1973) |
| Indus R. | 200 | 4,500 | Kukal, 1971 |
| Wisconsin valley floodplain | 1,000 | 6,070 | Bridge & Leeder, 1979 (Knox, 1972) |
| Wisconsin valley floodplain | 350 | 6,040 | Bridge & Leeder, 1979 (Knox, 1972) |
| Blockhouse Creek, Wisconsin, floodplain | 150-380 | 6,000 | Bridge & Leeder, 1979 (Knox, 1972) |
| Little Tallahatchie R., Mississippi, natural levee | 47,000-65,000 | 8 | Bridge & Leeder, 1979 (Ritchie et al., 1975) |
| Little Tallahatchie R., natural levee | 13,000-20,000 | 31 | Bridge & Leeder, 1979 (Ritchie et al., 1975) |
| Little Tallahatchie R., crevasse splay | 28,000-34,000 | 8 | Bridge & Leeder, 1979 (Ritchie et al., 1975) |
| Little Tallahatchie R., crevasse splay | 27,000 | 31 | Bridge & Leeder, 1979 (Ritchie et al., 1975) |
| Little Tallahatchie R., abandoned channels | 9,000-28,000 | 8 | Bridge & Leeder, 1979 (Ritchie et al., 1975) |
| Little Tallahatchie R., abandoned channels | 7,000-10,000 | 31 | Bridge & Leeder, 1979 (Ritchie et al., 1975) |
| Beatton R., British Columbia, floodplain | 1,000-61,000 | 500 | Bridge & Leeder, 1979 (Nanson, 1977) |
| Bobr & Strzegomka R., USSR, floodplains | 1,000-5,000 | ≈10,000 | Bridge & Leeder, 1979 (Teisseyre, 1977) |
| South Carolina Piedmont rivers, floodplain | 8,000 | 150 | Bridge & Leeder, 1979 (Happ, 1945) |
| Buck Run, floodplain | 650 | 1,450 | Bridge & Leeder, 1979 (Leopold et al., 1964) |
| Tigris & Euphrates, floodplain | 200 | 5,000 | Bridge & Leeder, 1979 (Leopold et al., 1964) |
| Cheyenne R., Wyoming, floodplain | 41,000-61,000 | 60 | Bridge & Leeder, 1979 (Leopold et al., 1964) |
| Dry Creek, Nebraska, floodplain | 8,600 | 500 | Bridge & Leeder, 1979 (Brice, 1966) |
| Upper Dry Creek, Nebraska, floodplain | 4,600-5,500 | 33 | Bridge & Leeder, 1979 (Brice, 1966) |
| Well Canyon, Nebraska, floodplain | 15,500-20,000 | 40 | Bridge & Leeder, 1979 (Brice, 1966) |
| Medicine Creek, Nebraska, floodplain | 83,000 | 22 | Bridge & Leeder, 1979 (Brice, 1966) |
| Medicine Creek, drainage basin average | 25,000 | 22-500 | Bridge & Leeder, 1979 (Brice, 1966) |
| Chemung R., New York, floodplain | 4,600 | Bridge & Leeder, 1979 (Nelson, 1966) | |
| *Bijou Creek, Colorado, overbank, 1965 flood | 61,000-3,600,000 | 1 | Schindel, 1980 (McKee et al., 1967) |
| *Missouri R., levees, 1881 flood | 1.22-1.83 x 10⁶ | 1 | Bridge & Leeder, 1979 (Leopold et al., 1958) |
| *Kansas R., floodplain, 1951 flood | 29,000 | 1 | Bridge & Leeder, 1979 (Leopold et al., 1958) |
| *Farmington R., Connecticut, floodplain, 1955 flood | 15,000 | 1 | Bridge & Leeder, 1979 (Wolman & Eiler, 1958) |
| *Connecticut R., floodplain, 1936 flood | 35,000 | 1 | Bridge & Leeder, 1979 (Jahns, 1947) |
| *Connecticut R., floodplain, 1938 flood | 22,000 | 1 | Bridge & Leeder, 1979 (Jahns, 1947) |
| *Connecticut R., banks, 1936 flood | 259,000 | 1 | Bridge & Leeder, 1979 (Jahns, 1947) |
| *Connecticut R., banks, 1938 flood | 173,000 | 1 | Bridge & Leeder, 1979 (Jahns, 1947) |
| *Connecticut R., tributary banks, 1936 flood | 200,000 | 1 | Bridge & Leeder, 1979 (Jahns, 1947) |
| *Connecticut R., tributary banks, 1938 flood | 107,000 | 1 | Bridge & Leeder, 1979 (Jahns, 1947) |
| *Connecticut R., artificial levees, 1936 flood | 91,000 | 1 | Bridge & Leeder, 1979 (Jahns, 1947) |
| *Connecticut R., artificial levees, 1938 flood | 43,000 | 1 | Bridge & Leeder, 1979 (Jahns, 1947) |
| *Ob' R., USSR, point bar, 1969 flood | ≤1,500,000 | 1 | Bridge & Leeder, 1979 (Velikanov & Yamykh, 1970) |
| *Ob' R., crevasse splay & levee, 1969 flood | ≤600,000 | 1 | Bridge & Leeder, 1979 |
| *Ob' R., USSR, flood basin, 1969 flood | 200-30,000 | 1 | Bridge & Leeder, 1979 |
| San Joaquin River, California, (Holocene) | 15,000 | ≈10,000 | Bull, 1972 |
| Mississippi R., floodplain | 1,400 | 30,000 | Bridge & Leeder, 1979 (Fisk, 1944) |
| Upper Mississippi R., artificial backwater | 25,000-35,000 | 20 | Bridge & Leeder, 1979 (McHenry et al., 1976) |
| *Mississippi R., point bar, 1973 flood | 860,000 | 1 | Bridge & Leeder, 1979 (Kesel et al., 1974) |
| *Mississippi R., point bar, range | 130,000-3,000,000 | 1 | Bridge & Leeder, 1979 (Kesel et al., 1974) |
| *Mississippi R., natural levee, 1973 flood | 530,000 | 1 | Bridge & Leeder, 1979 (Kesel et al., 1974) |
| *Mississippi R., natural levee, 1973 flood | 100,000-840,000 | 1 | Bridge & Leeder, 1979 (Kesel et al., 1974) |
| *Mississippi R., levee back, 1973 flood | 125,000 | 1 | Bridge & Leeder, 1979 (Kesel et al., 1974) |
| *Mississippi R., levee back, 1973 flood | 60,000-270,000 | 1 | Bridge & Leeder, 1979 (Kesel et al., 1974) |
| *Mississippi R., abandoned channels, 1973 flood | 60,000 | 1 | Bridge & Leeder, 1979 (Kesel et al., 1974) |
| *Mississippi R., abandoned channels, 1973 flood,range | 40,000-90,000 | 1 | Bridge & Leeder, 1979 (Kesel et al., 1974) |
| *Mississippi R., backswamp, 1973 flood | 11,000 | 1 | Bridge & Leeder, 1979 (Kesel et al., 1974) |
| *Mississippi R., backswamp, 1973 flood | 5,000-25,000 | 1 | Bridge & Leeder, 1979 (Kesel et al., 1974) |
| Mississippi River (Miocene) | 32-53 | 20 x 106 | Rainwater, 1966 |
| Diablo Range, California, Holocene alluvial fan | 26,000 | ≈10,000 | Bull, 1972 |
| Eolian environments | |||
| Southern Peru | 2,000,000 | 3 | Bigarella, 1972 |
| Sahara Desert, Algeria | 6,500 | 4,000 | Galloway & Hobday, 1983 (Wilson, 1973) |
| Southern Sahara Desert | 800-1,700 | 12,000 | Breed et al., 1979 |
| Grand Erg Oriental, Algeria, average | 19 | 1,350,000 | Breed et al., 1979 |
| Grand Erg Oriental, Algeria, max. | 87 | 1,350,000 | Breed et al., 1979 |
| Kalahari Desert | 300-3,300 | ≈10,000 | Breed et al., 1979 |
| Cerchen Desert, PRC, average | 60,000 | 1,500 | Breed et al., 1979 |
| Navajo Sandstone (E. Jurassic), USA | 53 | 17 x 106 | Galloway & Hobday, 1983 |
| Loess | 200-1,000 | Kukal, 1971 | |
| Loess, central Alaska | 15-193 | Kukal, 1971 (Péwé, 1968) | |
| Lacustrine environments | |||
| Lacustrine, average | 3,000 | Kukal, 1971 | |
| Vierwaldstättersee, Switzerland, calcareous clays | 10,400-31,700 | Kukal, 1971 | |
| Vierwaldstättersee, Switzerland | 3,500-5,000 | Schindel, 1980 (Schwarzacher, 1975) | |
| Brienz, Switzerland, calcareous clays | 31,700 | Kukal, 1971 | |
| Léman, Switzerland | 1,200 | ≈150 | Schindel, 1980 (Krishnaswami et al., 1971) |
| Lunz, [Léman?], mouth of Rhone | 17,900 | Kukal, 1971 | |
| Lunz, [Léman?], average | 2,500 | Kukal, 1971 | |
| Lunz, Austria, average | 1,800 | Schindel, 1980 (Schwarzacher, 1975) | |
| Salton Sea, California, saline | 5,000-14,000 | ≈50 | Schindel, 1980 (Amal, 1961) |
| Wallensee, Switzerland, calcareous clays | 11,300 | Kukal, 1971 | |
| Onega, USSR, clays | 7,100 | Kukal, 1971 | |
| Ladoga, USSR, clays | 6,120 | Kukal, 1971 | |
| Trout and Mendota, Wisconsin | 6,000 | <100 | Schindel, 1980 (Bruland et al., 1975) |
| Trout Lake, Wisconsin | 4,000 | ≈100 | Schindel, 1980 (Koide et al., 1972) |
| Olof Jone Damm, Sweden, peat | 5,300 | Kukal, 1971 | |
| Shinji, Japan | 3,000-5,000 | <100 | Schindel, 1980 (Matsumoto, 1975) |
| Shinji, Japan | 1,200 | 9,500 | Schindel, 1980 (Mizuno et al., 1972) |
| North German lakes, marl | 1,000-3,000 | Kukal, 1971 | |
| Swedish lakes, gyttja | 1,000-2,000 | Kukal, 1971 | |
| Pavin, France | 1,300 | ≈100 | Schindel, 1980 (Krishnaswami et al., 1971) |
| Tahoe, USA | 1,000 | ≈100 | Schindel, 1980 (Koide et al., 1972; Bruland et al., 1975) |
| Titicaca, Bolivia | 1,000 | Schindel, 1980 (Bruland et al., 1975) | |
| Zürich, Switzerland | 700 | Kukal, 1971 | |
| Neuchâtel, Switzerland, varved calcareous clays | 700 | Kukal, 1971 | |
| Maxinkuckee, Canada, marl, eutrophic | 300 | Kukal, 1971 | |
| Great Lakes, N. America, varved mud | 150 | Kukal, 1971 | |
| Michigan, varved calcareous clays | 3,000 | Kukal, 1971 | |
| Michigan | 100-1,200 | <100 | Schindel, 1980 (Robbins & Edgington, 1975) |
| Superior | 100-600 | <100 | Schindel, 1980, (Bruland et al., 1975) |
| Constance (Bodensee), mouth of Rhine | 22,400 | 15,000 | Müller & Gees, 1970 |
| Constance (Bodensee) | 1,500-6,000 | 15,000 | Müller & Gees, 1970 |
| Diatomite (average) | 300-1,000 | Kukal, 1971 | |
| Varved glacial lakes | |||
| Weistriztal, Czechoslovakia | 60,000-100,000 | Reineck & Singh, 1975 (Schwarzbach, 1940) | |
| Burks Falls, Ontario | 2,000-17,000 | 620 | Antevs, 1925 |
| Espanola, Ontario | 1,000-83,000 | 985 | Antevs, 1925 |
| Tishaming, Ontario | 4,000-65,000 | 1,335 | Antevs, 1925 |
| Huntsville, Ontario | 2,000-45,000 | 760 | Antevs, 1925 |
| Bracebridge, Ontario | 3,000-92,000 | 511 | Antevs, 1925 |
| Bracebridge, Ontario, average | 10,900 | 112 | Antevs, 1925 |
| Ancient lakes | |||
| Lake Bonneville, Pleistocene, Utah | 1,800 | 106 | Feth, 1964; Picard & High, 1972 |
| Unita Formation, Eocene, Wyoming | 5.7 | 13.3 x 10⁶ | Feth, 1964; Picard & High, 1972 |
| Green River Formation, Eocene, Wyoming and Colorado | 150 | 4 x 10⁶ | Feth, 1964; Picard & High, 1972 |
| Flagstaff Limestone, Paleocene-Eocene, Utah | 22-110 | 2.75 x 10⁶ | Feth, 1964; Picard & High, 1972 |
| Todilto Limestone, L. Jurassic, New Mexico | 380 | 20,000 | Feth, 1964; Picard & High, 1972 |
| Lockatong Formation, L. Triassic, New Jersey | 225 | 5.1 x 10⁶ | Van Houten, 1964; Picard & High, 1972 |
| Deltaic environments | |||
| Delta topsets, average | 15,000-20,000 | Kukal, 1971 | |
| Mississippi | 2,740,000 | 4 d | Kukal, 1971 |
| Mississippi, channel-mouth bar | 500,000 | 100 | Schindel, 1980 (Coleman, 1976) |
| Mississippi, channel-mouth bar | 340,000 | 195 | Schindel, 1980 (Gould, 1970) |
| Mississippi, delta front | 300,000-450,000 | 1 | Kukal, 1971 |
| Mississippi, prodelta | 60,000-300,000 | 1 | Kukal, 1971 |
| Mississippi, subaerial average | 170,000-200,000 | 600 | Schindel, 1980 (Coleman, 1976) |
| Mississippi, offshore | 200,000 | 100 | Schindel, 1980 (Coleman, 1976) |
| Mississippi, crevasse splay | 30,000-100,000 | 150 | Schindel, 1980 (Coleman, 1976) |
| Mississippi, adjacent shelf | 45,000 | 1 | Kukal, 1971 |
| Mississippi, premodern lobes, average | 20,000-25,000 | 1,000 | Schindel, 1980 (Coleman, 1976) |
| Mississippi, interdistributary bay | 19,600 | 120 | Elliott, 1978 (Gagliano & Van Beck, 1970) |
| Mississippi, Sale Sypremort lobe | 8,300-12,500 | 1,200 | Schindel, 1980 (Coleman, 1976) |
| Mississippi, "maximum" | 10,000 | 11,000 | Lisitzin, 1972 |
| Mississippi, submarine, nearshore | 8,200 | <100 | Schindel, 1980 (Shokes & Presley, 1976) |
| Mississippi, submarine, cont. shelf | 6,100 | <100 | Schindel, 1980 (Shokes & Presley, 1976) |
| Mississippi, submarine, cont. slope | 400 | <100 | Schindel, 1980 (Shokes & Presley, 1976) |
| Mississippi River (Miocene) | 325 | 20 x 106 | Rainwater, 1966 |
| Mississippi River (Miocene), prodelta | 220 | 20 x 106 | Rainwater, 1966 |
| Colorado, Texas | 4,064,000 | 6 | Kanes, 1970 |
| Po, Italy, at shoreline, average | 465,000 | 25 | Nelson, 1970 |
| Po, at shoreline, range | 268,000-653,000 | 19-45 | Nelson, 1970 |
| Rhône | 400,000 | 1 | Kukal, 1971 |
| Rhône | 700 | Schindel, 1980 (Schwarzacher, 1975) | |
| Rhône, river mouth, 50 m depth | 350,000 | 1 | Oomkens, 1970 |
| Rhône, mouth of Grand Rhône | 14,000 | ≈5,000 | Oomkens, 1970 |
| Rhône, mouth of Petit Rhône | 7,600 | ≈5,000 | Oomkens, 1970 |
| Rhône, shoreline | 2,000 | 11,000 | Lisitzin, 1972 |
| Rhône, 45 km offshore | 6,000 | 11,000 | Lisitzin, 1972 |
| Rhône, 75 km offshore | 1,000 | 11,000 | Lisitzin, 1972 |
| Rhine delta, Lake Constance (Bodensee) | 2,500,000 | 10 | Müller, 1966 |
| Rhine delta, Lake Constance, average | 262,800 | 50 | Müller, 1966 |
| Nile, subaerial portion | 10,000 | 1 | Kukal, 1971 |
| Nile | 660 | Schindel, 1980 (Schwarzacher, 1975) | |
| Fraser, Canada | 50,000-300,000 | Kukal, 1971 | |
| Volga, Caspian Sea | 5,000-70,000 | Kukal, 1971 | |
| Tana River, Japan | 30,000-70,000 | 10 | Schindel, 1980 (Ambe, 1972) |
| Alamo River, Salton Sea, USA | 50,000 | 33 | Schindel, 1980 (Amal, 1961) |
| Amu Darya River, Aral Sea, USSR | 25,000 | Kukal, 1971 | |
| Orinoco, Venezuela | 5,000-6,000 | 11,000 | Lisitzin, 1972 |
| Sabine, Texas | 2,930 | 5,200 | Nelson & Bray, 1970 |
| Guadalupe, Texas | 2,100 | 2,000 | Donaldson et al., 1970 |
| Rud Hilla, Persian Gulf | 800-5,000 | <6,000 | Schindel, 1980 (Melguen, 1973) |
| Columbia River, Washington shelf | 1,300-3,900 | ≈100 | Schindel, 1980 (Nittrouer et al., 1979) |
| Huang-He, PRC | 1,500 | Kukal, 1971 | |
| Don, Sea of Azov, USSR, subaerial portion | 1,220 | 1 | Kukal, 1971 |
| Malaysia, tide-dominated delta | 1,000 | 100 | Galloway & Hobday, 1983 (Coleman et al., 1970) |
| Bengal cone (Ganges prodelta) | 62 | 10.2 x 10⁶ | Moore et al., 1974 |
| Tidal flats, coastal wetlands, and beaches | |||
| Tidal flats | |||
| Jade Busen, Germany | 1,450,000 | 8 d | Kukal, 1971 (Reineck, 1960) |
| Jade Busen, Germany | 11,500 | 4 | Kukal, 1971 (Reineck, 1960) |
| Jade Busen, Germany | 2,200 | 1,900 | Kukal, 1971 (Reineck, 1960) |
| The Wash, UK | 16,000-80,000 | 9 mo | Schindel, 1980 (Evans, 1965) |
| Netherlands | 10,000-20,000 | 1 | Kukal, 1971 |
| Laguna Madre, Texas | 250-5,000 | 2,500 | Schindel, 1980 (Miller, 1975) |
| Boundary Bay, British Columbia | 5,000 | 20 | Schindel, 1980 (Kellerhals & Murray, 1969) |
| Boundary Bay, British Columbia | 420 | 4,500 | Schindel, 1980 (Kellerhals & Murray, 1969) |
| Beaches | |||
| Chenier beaches, SW Louisiana | 6,300-21,200 | 400-2,200 | Reineck & Singh, 1975 (Gould and McFarlan, 1959) |
| Padre Island, Texas, barrier beach | 2,100 | 4,000 | Reineck & Singh, 1975 (Fisk, 1959) |
| Galveston Island, Texas, barrier beach | 2,860 | 3,500 | Bernard et al., 1962 |
| Fire Island Inlet, New York | 103,000 | 115 | Kumar & Sanders, 1974 |
| Wangerooge Inlet, North Sea | 88,000 | 68 | Reineck & Singh, 1975 (Reineck, 1958) |
| Nayarit, Mexico | 44,000 | 205 | Reineck & Singh, 1975 (Curray et al., 1969) |
| Christchurch Formation (Holocene), New Zealand, offshore sand | 2,700-3,500 | 5,535 | Suggate, 1968 |
| Wetlands, salt marshes | |||
| Long Island Sound, USA | 4,700-6,300 | <100 | Schindel, 1980 (Annentano & Woodwell, 1975) |
| Denmark | 3,600 | 30 | Schindel, 1980 (Schou, 1967) |
| Connecticut | 2,000-6,500 | 6 | Schindel, 1980 (Harrison & Bloom, 1974) |
| Farm River, Connecticut | 1,600 | 200 | Schindel, 1980 (McCaffrey, 1977) |
| Klang River (Malaysia) | 1,000 | Schindel, 1980 (Coleman, 1976) | |
| SW Louisiana, salt marsh & lagoon | 5,500-27,500 | 400-1,800 | Reinick & Singh, 1975 (Gould and McFarlan, 1959) |
| Wetlands, peat deposits | |||
| UK, Littoral | 9,800 | Kukal, 1971 | |
| Schwabia, S. Germany, high moors | 1,500-1,800 | 1 | Kukal, 1971 |
| North American | 550 | Kukal, 1971 | |
| Bomeo (Kalimantan), coastal swamps | 4,250 | 4,000 | Galloway & Hobday, 1983 (Stach et al., 1975) |
| Everglades, Holocene coastal swamp | 1,200 | 3,460 | Spackman et al., 1964 |
| Olof Jone Damm, Sweden, fresh water | 5,300 | Kukal, 1971 | |
| Bays, lagoons, and estuaries | |||
| Texas, lagoon | 14,300 | 290 | Schindel, 1980 (Moore, 1955) |
| Texas, lagoon | 9,100 | 68 | Schindel, 1980 (Shepard, 1953) |
| Texas, lagoon, clay and eolian sand | 3,800 | Kukal, 1971 | |
| San Antonio Bay, Texas | 3,750 | 100 | Donaldson et al., 1970 (Shepard & Moore, 1960) |
| Texas, lagoon | 2,300 | 9,300 | Schindel, 1980 (Shepard & Moore, 1955) |
| Padre Island, Texas, lagoon | 1,900 | 4,000 | Reineck & Singh, 1975 (Fisk, 1959) |
| Great Bay, USA, estuary | 1,600-7,800 | ≈100 | Schindel, 1980 (Capuzzo & Anderson, 1973) |
| Long Island Sound, USA | 6,000 | 30 | Schindel, 1980 (Thomson & Turekian, 1973) |
| Long Island Sound | 1,000-7,000 | <100 | Schindel, 1980 (Benninger et al., 1977) |
| Long Island Sound | 500-1,000 | 10,000 | Schindel, 1980 (Benninger et al., 1977) |
| Mobile Bay, Alabama | 5,600 | 115 | Schindel, 1980 (Ryan & Goodell, 1972) |
| Mobile Bay, Alabama | 1,640 | 6,000 | Schindel, 1980 (Ryan & Goodell, 1972) |
| Firth of Clyde, Scotland | 5,000 | 12,000 | Schindel, 1980 (Kuenen, 1950) |
| Firth of Clyde, Scotland, clay | 2,400-3,000 | Kukal, 1971 | |
| James River, Virginia, estuary | 1,500-3,000 | 75 | Schindel, 1980 (Nichols, 1972) |
| Sea of Azov, USSR, estuary | 900-2,400 | 11,000 | Lisitzin, 1972 |
| Hampton, New Hampshire, estuary | 1,000-2,300 | 11,000 | Schindel, 1980 (Keene, 1970) |
| Kiel Bay, Germany, sand & silt | 1,500-2,000 | Kukal, 1971 | |
| Drammens Fjord, Sweden | 1,500 | 12,000 | Schindel, 1980 (Kuenen, 1950) |
| San Francisco Bay, USA | 300-1,300 | ≈2,500 | Schindel, 1980 (Story et al., 1966) |
| Gulf of California, Mexico | 1,000 | 12,000 | Schindel, 1980 (Kuenen, 1950) |
| Gulf of California, clay, diatomite | 600-1,000 | Kukal, 1971 | |
| Gulf of Paria, Venezuela, clay | 0-10,000 | 700 | Kukal, 1971 (van Andel & Postma, 1954) |
| Kara-Bougas-Gol, Caspian Sea, clay & salt | 500-700 | Kukal, 1971 | |
| Inland seas | |||
| Black Sea (Messinian), carbonates, some pebbly mudstone | 1,030 | 800,000 | Hsü, 1978 |
| Black Sea, terrigenous clastics | 1,000 | 15,000 | Schindel, 1980 (Stoffers et al., 1978) |
| Black Sea, dolomitic varves | 900 | 81 | Schindel, 1980 (Ross et al., 1978) |
| Black Sea, terrigenous & diatom mud | 600 | 125,000 | Hsü, 1978 |
| Black Sea, terrigenous & diatom mud | 500 | 500,000 | Hsü, 1978 |
| Black Sea, lacustrine carbonates | 310 | 1.1 x 10⁶ | Hsü, 1978 |
| Black Sea, terrigenous mud | 100-400 | 11,000 | Lisitzin, 1972 |
| Black Sea | 50-400 | 7,000 | Schindel, 1980 (Ross et al., 1970) |
| Black Sea, coccolith ooze | 100-300 | 3,000 | Schindel, 1980 (Stoffers et al., 1978) |
| Black Sea | 200 | Kukal, 1971 | |
| Black Sea | 200 | 12,000 | Schindel, 1980 (Kuenen, 1950) |
| Black Sea, brackish sapropel | 100 | 4,000 | Schindel, 1980 (Stoffers et al., 1978) |
| Black Sea, marine, terrigenous mud | 100 | 11,000 | Hsü, 1978 |
| Black Sea (Pliocene) lacustrine chalk | 54 | 3.45 x 10⁶ | Hsü, 1978 |
| Black Sea (pelagic) | 10-40 | 11,000 | Lisitzin, 1972 |
| Black Sea (Miocene) black shale | 26 | 4 x 10⁶ | Hsü, 1978 |
| Mediterranean, Baleric abyssal plain; hemipelagic & turbidites | 160-520 | 20,000 | Rupke, 1975 |
| Mediterranean, Tyrrhenian Sea, calcareous and diatom clay | 100-500 | 12,000 | Schindel, 1980 (Kuenen, 1950) |
| Mediterranean, terrigenous turbidites | 300 | 10,000 | Cita et al., 1978 |
| Mediterranean, ooze & eolian | 200 | Kukal, 1971 | |
| Mediterranean, deep basin | 150 | 1.9 x 10⁶ | Cita et al., 1978 |
| Mediterranean, calcareous ooze | 100 | Kukal, 1971 | |
| Mediterranean, average | 25-90 | 3 x 10⁶ | Cita et al., 1978 |
| Mediterranean, pelagic oozes | 50 | ≈10,000 | Cita et al., 1978 |
| Mediterranean, ridges & basin margins | 25-50 | 1.9 x 10⁶ | Cita et al., 1978 |
| Mediterranean, Adriatic Sea, shells (lag) | 10 | Kukal, 1971 | |
| Mediterranean, pelagic (condensed) | 1 | 1.9 x 10⁶ | Cita et al., 1978 |
| Caspian Sea, mouth of Kura River | 6,000 | 7,000 | Lisitzin, 1972 |
| Caspian Sea, pelagic | 200-600 | 7,000 | Lisitzin, 1972 |
| Caspian Sea, calcareous clays | 100-180 | Kukal, 1971 | |
| Baltic Sea | 200-2,000 | 10,000 | Schindel, 1980 (Alhonen, 1966) |
| Baltic Sea, black organic clays | 300 | Kukal, 1971 | |
| Persian Gulf (eastern basin), terrigenous | 410 | 9,000 | Schindel, 1980 (Seibold et al., 1973) |
| Persian Gulf (central basin), terrigenous and carbonate | 70 | 9,000 | Schindel, 1980 (Seibold et al., 1973) |
| Sea of Okhotsk, W. Pacific, shelf depression and base of slope | 90-250 | 11,000 | Lisitzin, 1972 |
| Sea of Okhotsk, central shelf | 9-45 | 11,000 | Lisitzin, 1972 |
| Gulf of Mexico, upper slope, sandy, silty clays | 70 | Kukal, 1971 | |
| Gulf of Mexico, lower slope, silty clays | 50 | Kukal, 1971 | |
| Gulf of Mexico, basin floor, calcareous clays | 40 | Kukal, 1971 | |
| Milford Sound (New Zealand), sandy silts | 12.5 | Kukal, 1971 | |
| Terrigenous shelf deposits | |||
| North American shelf | 0-400 | Kukal, 1971 | |
| New Jersey shelf, USA, sand | 950-1,300 | 8,000 | Swift et al., 1984 |
| Barents Sea, Arctic Ocean, clays | 8-40 | Kukal, 1971 | |
| North Sea, gale 'Adolph-Bennpohl', sand | 4,200,000 | 36 h | Gadow & Reineck, 1969 |
| North Sea, storm, March 1967, sand | 1,100,000 | 84 h | Gadow & Reineck, 1969 |
| Nompho, Korea, mud | 1,500,000 | 4 | Lisitzin, 1972 |
| Antarctic shelf, sand | 20-60 | 10,000 | Lisitzin, 1972 |
| Antarctic shelf, mud | 200-300 | 10,000 | Lisitzin, 1972 |
| Indochinese shelf | 50-200 | Kukal, 1971 | |
| North Sea sand waves | 2,200-4,300 | 10,000 | Houbolt, 1968 |
| High Island, Gulf of Mexico, nearshore sands | 1,050-1,760 | 5,200 | Nelson & Bray, 1970 |
| High Island, Gulf of Mexico, nearshore muds | 470 | 5,200 | Nelson & Bray, 1970 |
| Shallow-water carbonates | |||
| Individual coral growth rates | |||
| Range, coral growth | 850-150,000 | Schlager, 1981 | |
| Massive coral | 4,000 | Kukal, 1971 | |
| Pristatophyllum, Devonian | 2,000-6,200 | 33 | Faul, 1943 |
| Atlantic corals | |||
| Corals, Florida Bay, leeward | 570 | 528 | Kukal, 1971 |
| Montastrea annularis | |||
| inshore, patch reef, <6 m depth, Florida | 8,200 | 50 | Shinn, Lidz et al., 1989 (Hudson, 1981) |
| offshore, >6 m depth, Florida | 6,300 | 50 | Shinn, Lidz et al., 1989 (Hudson, 1981) |
| platform margin, <3 m depth, Florida, windward | 11,200 | 50 | Shinn, Lidz et al., 1989 (Hudson, 1981) |
| Key West, Florida | 2,800-5,800 | 15 | Weber & White, 1977 |
| Florida, 0-5 m | 6,000 | 3 | Huston, 1985 (Vaughan, 1915) |
| Virgin Islands, 0 m | 9,170 ± 1,330 | Baker & Weber, 1975 | |
| Virgin Islands, 5 m | 9,950 ± 1,430 | Baker & Weber, 1975 | |
| Virgin Islands, 9 m | 10,410 ± 1,240 | Baker & Weber, 1975 | |
| Virgin Islands, 13.5 m | 9,690 ± 1,360 | Baker & Weber, 1975 | |
| Virgin Islands, 18 m | 6,540 ± 3,560 | Baker & Weber, 1975 | |
| Virgin Islands, 22.5 m | 2,060 ± 540 | Baker & Weber, 1975 | |
| Virgin Islands, 27 m | 1,560 ± 200 | Baker & Weber, 1975 | |
| Virgin Islands, 2 m, leeward | 7,600 ± 330 | 4 m | Gladfelter et al., 1978 |
| Virgin Islands, forereef, windward 10 m, | 7,600 ± 820 | 4 m | Gladfelter et al., 1978 |
| Jamaica, 0-1 m | 6,950 | 3 | Huston, 1985 |
| Jamaica, 5 m | 7,400 ± 3,100 | 3 | Huston, 1985 |
| Jamaica, 10 m | 7,430 ± 1,920 | 3 | Huston, 1985 |
| Jamaica, 10 m | 6,680 ± 2,000 | 2 | Dustan, 1979 |
| Jamaica, 20 m | 1,770 ± 700 | 3 | Huston, 1985 |
| Jamaica, 28 m | 1,700 ± 400 | 2 | Dustan, 1979 |
| Jamaica, 30 m | 1,750 ± 330 | 3 | Huston, 1985 |
| Jamaica, 45 m | 1,630 ± 1,200 | 2 | Dustan, 1979 |
| Curacao, 6-15 m | 6,300-7,800 | Huston, 1985 (Bak, 1976) | |
| Belize | 12,000 | Weber & White, 1977 | |
| Caribbean | 3,000-12,000 | Weber & White, 1977 | |
| Caribbean | 6,000 | Ghiold & Enos, 1982 (Macintyre & Smith, 1974) | |
| Pleistocene, Florida | 5,000 | 400 | Shinn, Lidz et al., 1989 |
| Pleistocene, Florida | 5,200 | 31 | Landon,1975 |
| Montastrea cavernosa | |||
| Jamaica, 10 m | 3,600 ± 1,900 | 3 | Huston, 1985 |
| Jamaica, 20 m | 6,840 ± 2,670 | 3 | Huston, 1985 |
| Jamaica, 30 m | 4,100 ± 1,390 | 3 | Huston, 1985 |
| Key West | 2,250-4,050 | 22 | Weber & White, 1977 |
| Florida | 3,200-5,700 | 3 | Ghiold & Enos, 1982 (Vaughn, 1915) |
| Acropora palmata | |||
| Caribbean | 100,000-120,000 | 1 | Shinn, Lidz et al., 1989 (Lewis et al., 1968) |
| Florida, <5 m | 25,000-40,000 | 3 | Huston, 1985 (Vaughan, 1915) |
| Curacao, <5 m | 88,000 | Huston, 1985 (Bak, 1976) | |
| Virgin Islands, 1/2 m, leeward | 56,900 ± 4,100 | 2 m | Gladfelter et al., 1978 |
| Virgin Islands, 1/2 m, windward | 68,500 ± 6,900 | 2 m | Gladfelter et al., 1978 |
| Virgin Islands, 9 m , windward | 77,000 ± 6,900 | 2 m | Gladfelter et al., 1978 |
| Acropora cervicornis | |||
| Jamaica, windward | 266,000 ± 129,000 | 1 | Buddemeier & Kinzie, 1976 (Lewis et al., 1968) |
| Jamaica, <5 m, windward | 109,000-159,000 | 1 | Tunnicliffe, 1983 |
| Jamaica, 6-15 m, windward | 80,000-140,000 | 1 | Tunnicliffe, 1983 |
| Jamaica, 25 m, windward | 92,000-148,000 | 1 | Tunnicliffe, 1983 |
| Virgin Islands, 10 m, windward | 71,000 ± 6,500 | 2 m | Gladfelter et al., 1978 |
| Florida, <5 m, windward | 105,100 ± 16,500 | 1 | Shinn, 1966 |
| Florida, 1 m, leeward | 45,700 ± 18,400 | 9 m | Shinn, 1966 |
| Florida, <5 m | 40,000-45,000 | 3 | Huston, 1985 (Vaughan, 1915) |
| Barbados, leeward | 145,000 ± 559,000 | 1 | Buddemeier & Kinzie, 1976 (Lewis et al., 1968) |
| Colpophyllia natans | |||
| Jamaica, 5 m | 9,000 ± 1,100 | 3 | Huston, 1985 |
| Jamaica, 10 m | 8,100 ± 1,400 | 3 | Huston, 1985 |
| Jamaica, 20 m | 4,200 ± 850 | 3 | Huston, 1985 |
| Diploria spp. | 3,500-10,000 | 3 | Ghiold & Enos, 1982 (Vaughn, 1915) |
| Diploria stringosa, Bermuda | 3,300-3,500 | 50 | Dodge & Vaisnys, 1980 |
| D. labyrinthiformis, Florida | 3,500 ± 600 | 3-27 | Ghiold & Enos, 1982 |
| Solenastrea bournoni, Florida Bay, leeward | 8,900 | 100 | Shinn, Lidz et al., 1989 |
| Porites porites | |||
| Florida | 14,000-17,000 | 6 | Landon,1975 |
| Caribbean | 21,000-36,000 | Landon, 1975 (Lewis et al., 1968) | |
| Pleistocene, Florida | 10,500 | 6 | Landon, 1975 |
| Poritesfurcata, Florida & Bahamas | 9,000-23,000 | 3 | Ghiold & Enos, 1982 (Vaughn, 1915) |
| Porites astreoides | |||
| Jamaica, 0-1 m | 5,030 ± 560 | 3 | Huston, 1985 |
| Jamaica, 5 m | 5,000 ± 1,500 | 3 | Huston, 1985 |
| Jamaica, 10 m | 3,300 ± 770 | 3 | Huston, 1985 |
| Jamaica, 20 m | 2,700 ± 220 | 3 | Huston, 1985 |
| Jamaica, 30 m | 2,300 ± 250 | 3 | Huston, 1985 |
| Virgin Islands, 2 m | 3,450 ± 320 | 8 m | Gladfelter et al., 1978 |
| Virgin Islands, 10 m | 3,000 ± 120 | 3 m | Gladfelter et al., 1978 |
| Florida | 4,300 | Ghiold & Enos, 1982 (Kissling, 1977) | |
| Florida, Bahamas | 5,700-13,000 | 3 | Ghiold & Enos, 1982 (Vaughn, 1915) |
| Dendrogyra cylindrus, Florida | 5,000 | 1 | Shinn, Lidz et al., 1989 |
| Siderastrea sidera | |||
| Jamaica, 10 m | 7,150 | 3 | Huston, 1985 |
| Jamaica, 20 m | 3,000 ± 800 | 3 | Huston, 1985 |
| Jamaica, 30 m | 3,100 | 3 | Huston, 1985 |
| Florida | 2,200-2,700 | 22 | Landon,1975 |
| Pleistocene, Florida | 1,500 | 19 | Landon, 1975 |
| Faviafragum, Florida | 2,900-3,800 | 3 | Ghiold & Enos, 1982 (Vaughn, 1915) |
| Manicina sp. Florida | 2,500-8,700 | 3 | Ghiold & Enos, 1982 (Vaughn, 1915) |
| Agaricia argaricites, Jamaica, 0-30 m | 1,110 ± 270 | ≥3 | Huston, 1985 |
| Agaricia sp, Florida | 3,800 | 3 | Ghiold & Enos, 1982 (Vaughn, 1915) |
| Pacific corals | |||
| Acropora spp | 85,000-226,000 | Buddemeier & Kinzie, 1976 | |
| Acropora spp, Samoa, 0-5 m | 4,000-185,000 | Huston, 1985 (Mayor, 1924) | |
| A. abrantoides, Yapp | 125,000-130,000 | Huston, 1985 (Tamura & Hada, 1932) | |
| A. pulchra | 101,000-172,000 | Huston, 1985 (Tamura & Hada, 1932) | |
| Astreapora myriophythalma | |||
| Enewetak, 6-15 m | 7,500-13,000 | Huston, 1985 (Buddemeier et al., 1974) | |
| Enewetak, 16-25 m | 5,000-5,500 | Huston, 1985 (Buddemeier et al., 1974) | |
| Pocillopora spp., Samoa, 0-5 m | 7,000-35,000 | Huston, 1985 (Mayor, 1924)) | |
| P. damicornis | 13,900-27,800 | Buddemeier & Kinzie, 1976 | |
| Guam, 0-5 m | 33,300 | Huston, 1985 (Neudecker, 1977) | |
| Guam, 6-15 m | 36,700 | Huston, 1985 (Neudecker, 1977) | |
| Guam, >25 m | 18,100 | Huston, 1985 (Neudecker, 1977) | |
| Panama, 3 m | 39,600 ± 1,500 | Glynn, 1976 | |
| Panama, 6 m | 33,600 ± 2,100 | Glynn, 1976 | |
| Panama, 0-15 m | 44,300-59,300 | Huston, 1985 (Wellington, 1982) | |
| P. eydouxi, Enewetak, 0-5 m | 50,000 | Huston, 1985 (Buddemeier et al., 1974) | |
| Psammocora sp., Enewetak, 0-5 m | 30,000 | Huston, 1985 (Buddemeier et al., 1974) | |
| Pavona sp., Samoa, 0-5 m | 32,000 | Huston, 1985 (Mayor, 1924) | |
| P. clavus, Panama, 0-5 m | 15,500-23,000 | Huston, 1985 (Wellington, 1982) | |
| Panama, 6-15 m | 12,000-19,000 | Huston, 1985 (Wellington, 1982) | |
| P. gigantea, Panama, 0-5 m | 10,000-19,500 | Huston, 1985 (Wellington, 1982) | |
| Panama 6-15 m | 8,000-17,000 | Huston, 1985 (Wellington, 1982) | |
| Fungiafungites, Enewetak, 6-15 m | 10,000-12,000 | Huston, 1985 (Buddemeier et al., 1974) | |
| Porites spp, 0-5 m | 7,000-48,500 | Huston, 1985 (various) | |
| P. lutea | |||
| Enewetak, 0-5 m | 5,000-13,500 | Huston, 1985 (Buddemeier et al., 1974) | |
| Enewetak, 6-15 m | 5,000-11,000 | Huston, 1985 (Buddemeier et al., 1974) | |
| Enewetak, 16-25 m | 3,000-9,500 | Huston, 1985 (Buddemeier et al., 1974) | |
| Enewetak, >25 m | 5,000-6,000 | Huston, 1985 (Buddemeier et al., 1974) | |
| P. lobata, Enewetak, 6-15 m | 10,000-11,500 | Huston, 1985 (Buddemeier et al., 1974) | |
| Enewetak, 16-25 m | 5,000-6,000 | Huston, 1985 (Buddemeier et al., 1974) | |
| Favia pallida | |||
| Enewetak, 0-5 m | 5,500-7,500 | Huston, 1985 (Highsmith, 1979) | |
| Enewetak, 6-15 m | 5,000-7,000 | Huston, 1985 (Highsmith, 1979) | |
| Enewetak, 15-25 m | 4,000-7,000 | Huston, 1985 (Highsmith, 1979) | |
| Enewetak, 25-30 m | 4,000-6,500 | Huston, 1985 (Highsmith, 1979) | |
| F. speciosa | |||
| Enewetak, 0-5 m | 4,600 | Huston, 1985 (Buddemeier et al., 1974) | |
| Enewetak, 6-15 m | 5,600-8,500 | Huston, 1985 (Buddemeier et al., 1974) | |
| Enewetak, 16-25 m | 6,500-7,000 | Huston, 1985 (Buddemeier et al., 1974) | |
| Goniastrea retiformis | |||
| Enewetak, 0-5 m | 8,000-10,000 | Huston, 1985 (Buddemeier et al., 1974) | |
| Enewetak, 6-15 m | 5,000-9,500 | Huston, 1985 (Highsmith, 1979) | |
| Enewetak, 16-25 m | 6,000 | Huston, 1985 (Highsmith, 1979) | |
| G. parvistella, 0-5 m | 1,300-12,500 | Huston, 1985 (Buddemeier et al., 1974) | |
| Platygyra laminella, 6-15 m | 6,700-8,000 | Huston, 1985 (Buddemeier et al., 1974) | |
| Reefs | |||
| Coral, atolls, windward | 14,000 | Kukal, 1971 | |
| Atolls, lagoon reefs, leeward | 3,800 | Kukal, 1971 | |
| Range, <5 m depth | 1,100-20,000 | Schlager, 1981 | |
| Range, 10-20 m depth | 500-2,000 | Schlager, 1981 | |
| Range, atolls, outer reefs | 330-910 | Kukal, 1971 | |
| Atlantic reefs | |||
| Alcaran Reef, Mexico, Acropora cervicornis reef | 12,000 | 775 | Macintyre et al., 1977 |
| Alcaran Reef, Mexico, head-coral reefs | 6,000 | 1,175 | Macintyre et al., 1977 |
| Grecian Rocks, Florida, windward | 1,300 | 6,000 | Shinn, 1980 |
| Holocene, Miami, Florida | 6,500 | 2,000 | Lighty et al., 1978 |
| Miami, Florida | 740 | 4,900 | Shinn, Hudson et al., 1977 |
| Bal Harbor, Florida | 380 | 6,300 | Shinn, Hudson et al., 1977 |
| Long Reef, Florida, windward | 650 | 5,600 | Shinn, Hudson et al., 1977 |
| Carysfort Reef, Florida, windward | 860-4,850 | 700-5,250 | Shinn, Hudson et al., 1977 |
| Big Pine Key, Florida, leeward | 490-1,510 | 1,000-7,200 | Shinn, Hudson et al., 1977 |
| Dry Tortugas, Florida | 1,910-4,470 | 130-6,000 | Shinn, Hudson et al., 1977 |
| St. Croix | 15,200 | Adey et al., 1977 | |
| St. Croix, algal ridge | 6,000 | Adey,1977 | |
| Hess Channel, St. Croix | 2,300 | 3,400 | Adey et al., 1977 |
| Galeta Point, Panama, Acropora palmata reef | |||
| range | 1,290-10,810 | 390-4,400 | Macintyre & Glynn, 1976 |
| average | 3,900 | ||
| Galeta Point, reef-flat rubble, windward | 600 | 5,500 | Macintyre & Glynn, 1976 |
| Boo Bee patch reef, Belize lagoon, leeward | 1,600 | 8,800 | Halley et al., 1977 |
| Pacific reefs | |||
| Tarawa Atoll, windward | 8,200 | 550 | Marshall & Jacobson, 1985 |
| Tarawa Atoll, windward | 5,000-5,400 | 2,070 | Marshall & Jacobson, 1985 |
| Nishimezaki Reef, Ryukyus | 3,900 | 7,400 | Takahashi et al., 1988 |
| Kikai-jima, Ryukyus | 2,900-4,000 | 8,720 | Takahashi et al., 1988 (Konishi et al., 1978) |
| Hanauma Reef, Hawaii | 2,900 | 6,970 | Takahashi et al., 1988 (Easton & Olson, 1976) |
| Great Barrier Reef, Holocene | 200-600 | 9,000 | Davies & Marshall, 1979 |
| Great Barrier Reef, algal pavement | 2,800 | alkalinity meas. | Davies & Marshall, 1979 |
| Great Barrier Reef, reef, flat, coral zone, windward | 3,100 | alkalinity, 24 h | Davies & Marshall, 1979 |
| Great Barrier Reef, reef flat, windward | 5,000 | alkalinity, 24 h | Davies & Marshall, 1979 |
| Great Barrier Reef, leeward margin, leeward | 6,000 | alkalinity, 24 h | Davies & Marshall, 1979 |
| Carter Reef, Great Barrier Reef | 260-2,200 | 320-1,940 | Hopley, 1977 |
| Orpheus Island, Great Barrier Reef | 4,000 | 7,300 | Takahashi et al., 1988 (Hopley & Bames, 1985) |
| Northern Great Barrier Reef | 67-100 | 15 x 106 | Davies, 1988 |
| Central Great Barrier Reef | 60-75 | 4 x 10⁶ | Davies, 1988 |
| Southern Great Barrier Reef | |||
| (Heron Island, Wreck Reefs) | 50-75 | 2-3 x 10⁶ | Davies, 1988 |
| Enewetak, Holocene | 320 | 13,000 | Salter, 1984 |
| Chiriqui Gulf, Panama, reef flat, average | 2,640 | 2,825 | Glynn & Mcintyre, 1977 |
| Chiriqui Gulf, Panama, reef flat, range | 1,100-4,800 | 5,585-210 | Glynn & Mcintyre, 1977 |
| Panama Bay, Panama, reef flat | 1,300 | 4,150 | Glynn & Mcintyre, 1977 |
| Other carbonate environments | |||
| Andros Island, storm-tide layers | 320,000-6,750,000 | 1.3-16.5 h | Hardie & Ginsburg, 1977 |
| Stromatolites | 1,460,000 | 24 h | Kukal, 1971 |
| Bermuda stromatolites, subtidal | 365,000 | 1-6 d | Gebelein, 1969 |
| Algal ridge, St. Croix, windward | 6,000 | Adey, 1977 | |
| Calcareous algae | 2,000-7,000 | Kukal, 1971 | |
| Calcareous algae, summer | 12,000 | 1 m | Kukal, 1971 |
| Ooid shoals (range), windward | 550-2,000 | ≈3,000 | Schlager, 1981 |
| Great Bahama Bank, leeward | 800-1,100 | 2,500 | Schindel, 1980 (Cloud, 1962) |
| Great Bahama Bank, Andros lobe, leeward | 200-850 | ≈7,000 | Enos, 1974 |
| Little Bahama Bank | 1,200 | 10,000 | Sarg, 1988 (Hine et al., 1981) |
| Little Bahama Bank, Bight of Abaco (ave.), leeward | 120 | 5,500 | Neumann & Land, 1975 |
| Little Bahama Bank, Bight of Abaco (core dates), leeward | 200-300 | ≈1,000 | Neumann & Land, 1975 |
| Florida, forereef slope | 710 | 10,000 | Enos,1977 |
| Florida outer shelf margin, windward | 490-1,010 | 6,000 | Enos,1977 |
| Florida inner shelf margin | 180-610 | 5,000 | Enos,1977 |
| Florida inner shelf margin | 220 | 10,200 | Stockman et al., 1967 |
| Rodriguez bank, Florida inner shelf margin | 1,000 | 5,000 | Wilson, 1975 (Turmel & Swanson, 1972) |
| Ceasar Creek Bank, Florida inner shelf margin | 1,390 | 4,000 | Warzeski, 1976 |
| Florida Bay, mud banks, leeward | 330 | 3,000 | Stockman et al., 1967 |
| Florida Bay, interbank, leeward | 53 | 3,000 | Stockman et al., 1967 |
| Florida Bay, western mud bank, leeward | 460 | 4,000 | Schindel, 1980 (Scholl, 1966) |
| Florida Bay, western mud banks, leeward | 620 | 4,000 | Wanless & Tagett, 1989; K.K. Mukerji, unpub., 1987 |
| Florida Bay, Cross Bank, leeward | 1,585 | 1,700 | E.A. Shinn & P.R. Rose, unpub., 1963 |
| Florida Bay, Crane Key, leeward | 1,000 | 3,000 | Wilson, 1975 (Stockman et al., 1967) |
| Florida Bay, Cape Sable | 4,000 | 50 | Gebelein, 1977 |
| Belize lagoon, adjacent patch reef | 400-500 | 8,800 | Halley et al., 1977 |
| Galeta Point, Panama, forereef talus | 2,500 | 2,500 | Macintyre & Glynn, 1976 |
| Galeta Point, fore-reef pavement, windward | 600 | 3,750 | Macintyre & Glynn, 1976 |
| Galeta Point, back reef, windward | 670 | 3,000 | Macintyre & Glynn, 1976 |
| Northeast Yucatan, lagoon, leeward | 1,000 | 5,000 | Wilson, 1975 (Brady, 1971) |
| Alcaran Reef, Mexico, coral rubble & sand, windward | 2,500 | 4,500 | Macintyre et al., 1977 |
| Alcaran Reef, Mexico, reef flat, windward | 2,000 | 3,500 | Macintyre et al., 1977 |
| Gulf of Mexico (oyster reef) | 730 | 2,100 | Schindel, 1980 (Shepard & Moore, 1955) |
| Persian Gulf | 5-50 | 10,000 | Schindel, 1980 (Samtheim, 1971) |
| Trucial Coast, Persian Gulf, lagoon, leeward | 140 | 5,000 | Schindel, 1980 (Kinsman, 1969) |
| Great Barrier Reef, sand flats | 200 | alkalinity meas. | Davies & Marshall, 1979 |
| Great Barrier Reef, reticulated lagoon, leeward | 1,000 | alkalinity, 24 h | Davies & Marshall, 1979 |
| Great Barrier Reef, deep lagoon | 300 | alkalinity, 24 h | Davies & Marshall, 1979 |
| Chiriqui Gulf, Panama, forereef slope, ave. | 7,500 | 430 | Glynn & Macintyre, 1977 |
| Chiriqui Gulf, Panama, forereef slope, range | 500-20,800 | 1,065-130 | Glynn & Macintyre, 1977 |
| Tidal flats, range | 400-950 | ≈3,000 | Schlager, 1981 |
| Cape Sable, FLorida, tidal flats | 11,000 | 19 m | Gebelein, 1977 |
| Cape Sable, Florida, tidal flats | 2,000-5,500 | 50 | Gebelein, 1977 |
| Andros Island, Bahamas, tidal flats | 490 | 5,000 | Hardie & Ginsburg, 1977 |
| Andros Island, Bahamas, NW tidal flats | 700 | 2,200 | Wilson, 1975 (Shinn et al., 1965) |
| Andros Island, Bahamas, SW tidal flats | 800 | ≈5,000 | Gebelein, 1975 |
| Trucial Coast, Persian Gulf (intertidal) | 400 | 5,000 | Schindel, 1980 (Kinsman, 1969) |
| Sabkha, Trucial Coast, Persian Gulf | 500 | 5,000 | Wilson, 1975 (Kinsman, 1969) |
| Sabkha, Persian Gulf | 29-94 | 3,000 | Schindel, 1980 (Illing et al., 1965) |
| Sabkha Faishak, Persian Gulf | 1,000 | 4,000 | Wilson, 1975 (Illing et al., 1965) |
| Bathyal and abyssal deposits | |||
| North Atlantic, Holocene, average | 88.5 | 11,000 | Ericson et al., 1961 |
| North Atlantic, Hologene, range | 5-636 | 11,000 | Ericson et al., 1961 |
| North Atlantic, L. Pleistocene, glacial, average | 63 | 50,000 | Ericson et al., 1961 |
| North Atlantic, L. Pleistocene, glacial, range | 10→203 | 50,000 | Ericson et al., 1961 |
| California Borderlands, diatomaceous mud | 880 | Kukal, 1971 | |
| Yellow Sea, Sea of Japan, diatomaceous clay | 50-200 | Kukal, 1971 | |
| East India Sea, calcareous clay | 850 | Kukal, 1971 | |
| Atlantic and Pacific | 10-150 | ≈100,000 | Schindel, 1980 (Ku et al., 1968) |
| North Pacific Ocean | 11 | 7 x 10⁶ | Schindel, 1980 (Dymond, 1966) |
| Barbados (airborne) | 0.6 | 9 m | Schindel, 1980 (Delany et al., 1967) |
| Hemipelagic deposits | |||
| Continental slope, "blue mud", average | 17.8 | Kukal, 1971 | |
| Atlantic Ocean average | 50-100 | Kukal, 1971 | |
| Canadian slope, Atlantic | 30-300 | 10,000 | Lisitzin, 1972 |
| European basin, Atlantic | 485 | 11,000 | Lisitzin, 1972 |
| Senegal continental slope, Atlantic | 200-418 | 11,000 | Lisitzin, 1972 |
| North American basin, west Atlantic | 90-480 | 11,000 | Lisitzin, 1972 |
| Cuban slope, Caribbean | 245-300 | 11,000 | Lisitzin, 1972 |
| Argentine Basin, S. Atlantic | 3-45 | 11,000 | Lisitzin, 1972 |
| Demerara & Ceara Rise, W. equatorial Atlantic | 3-400 | 15,000 | Scholle et al., 1983 (Damuth, 1977) |
| Demerara & Ceara abyssal plain | 15-40 | Lisitzin, 1972 | |
| Ceara abyssal plain, equatorial Atlantic | 200 | Berger, 1974 (Hayes et al., 1972) | |
| Nares abyssal plain (turbidites) | 25-30 | 10,000 | Kuijpers et al., 1987 |
| W. Greater Antilles Outer Ridge, N. Atlantic | 200-300 | Kuijpers et al., 1987 | |
| E. Greater Antilles Outer Ridge, N. Atlantic | 30 | Kuijpers et al., 1987 | |
| Baleric abyssal plain, Mediterranean | 160-520 | 20,000 | Rupke,1975 |
| North American rise, N. Atlantic | 34-68 | 12,000 | Schindel, 1980 (Emery et al., 1970) |
| North American abyssal plain, N. Atlantic | 20 | 12,000 | Schindel, 1980 (Emery et al., 1970) |
| Nares abyssal plain, N. Atlantic | 2.5-10 | 10,000 | Lisitzin, 1972 |
| Sohm abyssal plain, N. Atlantic | 20-360 | 10,000 | Lisitzin, 1972 |
| Cape Verde abyssal plain, mid-Atlantic | 10-40 | 10,000 | Lisitzin, 1972 |
| Pernambuco abyssal plain, S. Atlantic | 0.8 | 10,000 | Lisitzin, 1972 |
| Guinea abyssal plain, E. equatorial Atlantic | 25-50 | 10,000 | Lisitzin, 1972 |
| Niger fan, E. equatorial Atlantic | 25-65 | 10,000 | Lisitzin, 1972 |
| Angola abyssal plain, S. Atlantic | 7.5-23 | 10,000 | Lisitzin, 1972 |
| Cape abyssal plain, S. Atlantic | 1.5-12 | 10,000 | Lisitzin, 1972 |
| Bengal cone, Indian Ocean | 64 | 10.2 x 10⁶ | Moore et al., 1974 |
| North Pacific Ocean, blue mud | 10 | Kukal, 1971 | |
| Bering Straits, gray mud | 80-4,500 | Kukal, 1971 | |
| Bering Sea, basins | 70-360 | 10,000 | Lisitzin, 1972 |
| California borderland | 50-2,000 | Berger, 1974 (Bandy, 1968) | |
| California borderland | 3-400 | 15,000 | Scholle et al., 1983 (Prensky, 1973) |
| California borderland, ridges | 50 | Lisitzin, 1972 (Emery & Bray, 1962) | |
| California borderland, proximal basin | 1,800 | Lisitzin, 1972 (Emery & Bray, 1962) | |
| California borderland, distal basins | 200-400 | Lisitzin, 1972 (Emery & Bray, 1962) | |
| California continental slope | 80 | Lisitzin, 1972 | |
| Kuril-Kamchatka trench | 20-30 | 10,000 | Lisitzin, 1972 |
| Andean trench, E. Pacific | 18-36 | 11,000 | Schindel, 1980 (Lisitzin, 1972) |
| Antarctic slope, gray, silty clay | 10-160 | Kukal, 1971 | |
| Red clay | |||
| Oceanic average | 7-13 | 12,000 | Schindel, 1980 (Kuenen, 1950) |
| North Pacific Ocean | 1-2 | Opdyke & Foster, 1971 | |
| North Pacific (muddy) | 10-15 | Opdyke & Foster, 1971 | |
| North Pacific Ocean | 0.2-6 | 10,000 | Lisitzin, 1972 |
| Tropical North Pacific | 0-1 | Berger, 1974 | |
| Indian Ocean | 0.5-4.6 | 100,000 | Schindel, 1980 (Kuznetsov, 1969) |
| North and South Pacific | 2 | Van Andel et al., 1975 | |
| Nares abyssal plain, N. Atlantic | 5-10 | Kuijpers et al., 1987 | |
| Brown clay | |||
| Oceanic average | 2-10 | Kukal, 1971 | |
| Nares abyssal plain, N. Atlantic | 13-24 | 10-24.8 x 10³ | Kuijpers et al., 1987 |
| Pelagic carbonate | |||
| Oceanic average, Globigerina ooze | 10-80 | Kukal, 1971 | |
| Oceanic average, Globigerina ooze | 8-14 | 12,000 | Schindel, 1980 (Kuenen, 1950) |
| Pacific Ocean, average | 5.5 | 3 x 10⁶ | Davies & Worsley, 1981 |
| Indian Ocean | 10-40 | Scholle et al., 1983 (Goldberg & Koide, 1963) | |
| Indian Ocean average | 11.9 | 3 x 10⁶ | Davies & Worsley, 1981 |
| Atlantic Ocean, average | 17.3 | 3 x 10⁶ | Davies & Worsley, 1981 |
| Mid-Atlantic Ridge (crest) | 1.7-185 | 11,000 | Lisitzin, 1972 |
| Mid-Atlantic Ocean | 29 | 8,000 | Schindel, 1980 (Nozaki et al., 1977) |
| North Atlantic Ocean | 10-80 | Scholle et al., 1983 (Ericson et al., 1961) | |
| North Atlantic, Rockall Bank | 25-75 | 10,000 | Lisitzin, 1972 |
| North Atlantic (40-50°N) | 35-60 | Berger, 1974 (Mcintyre et al., 1972) | |
| North Atlantic (5-20°N) | 14-40 | Berger, 1974 (Schott, 1935) | |
| Equatorial Atlantic Ocean | 20-40 | Berger, 1974 (Schott, 1935; Ericson et al., 1956) | |
| South Atlantic Ocean | 20-50 | Scholle et al., 1983 (Ericson et al., 1961) | |
| South Atlantic, Brazilian slope | 30-50 | 10,000 | Lisitzin, 1972 |
| Caribbean Sea | 24 | 116,000 | Schindel, 1980 (Broecker & van Donk, 1970) |
| Caribbean Sea | 12 | Kukal, 1971 | |
| Caribbean Sea | 20-110 | Lisitzin, 1972 | |
| Caribbean Sea | 10-60 | Scholle et al., 1983 (Prell & Hay, 1976) | |
| Caribbean Sea | 28 | Berger, 1974 (Emiliani, 1966) | |
| Atlantic, Mediterranean | 20-100 | Kukal, 1971 | |
| Menorca Rise, Mediterranean, Quaternary | 108 | 1.8 x 10⁶ | Hsü, Montadert et al., 1978 |
| nanofossil marls | |||
| Black Sea, nannofossil ooze | 100-300 | 3,000 | Schindel, 1980 (Stoffers et al., 1978) |
| Mediterranean, pelagic ooze | 50 | 10,000 | Cita et al., 1978 |
| Panama Basin, eastern equatorial Pacific | 9-100 | Scholle et al., 1983 (Swift, 1977) | |
| Equatorial Pacific Ocean | 10-25 | 10,000 | Lisitzin, 1972 |
| Western equatorial Pacific Ocean | 11-50 | 106 | Scholle et al., 1983 (Berger et al., 1978 |
| Equatorial Pacific Ocean | 5-18 | 106 | Berger, 1974 (Hays et al., 1969) |
| Central equatorial Pacific Ocean | 10-20 | van Andel et al., 1975 | |
| Eastern equatorial Pacific Ocean | 30 | Berger, 1974 (Blackman, 1966) | |
| East Pacific Rise (0-20°S) | 20-40 | Berger, 1974 (Blackman, 1966) | |
| East Pacific Rise (30°S) | 3-10 | Berger, 1974 (Blackman, 1966) | |
| East Pacific Rise (40-50°S) | 10-60 | Berger, 1974 (Blackman, 1966) | |
| Northwest Providence Channel, Bahamas | 15-22 | 183-93 x 102 | Boardman and Neumann, 1984 |
| Northwest Providence Channel, periplatforrn ooze | 69-43 | 1,400-6,550 | Boardman and Neumann, 1984 |
| Biogenic siliceous sediments | |||
| Oceanic average, radiolarian ooze | 5 | Kukal, 1971 | |
| North & equatorial Atlantic Ocean | 2-7 | Berger, 1974 (Turekian, 1965) | |
| South Atlantic Ocean | 3-18 | 10,000 | Lisitzin, 1972 |
| South Atlantic Ocean | 2-3 | Berger, 1974 (Maxwell et al., 1970) | |
| Pacific Ocean, diatom ooze | 5-50 | Kukal, 1971 | |
| Equatorial Pacific, siliceous ooze | 4-5 | 106 | van Andel et al., 1975 |
| Equatorial Pacific, siliceous ooze | 2-5 | Berger, 1974 | |
| Equatorial Pacific Ocean | 2-25 | 10,000 | Lisitzin, 1972 |
| Antarctic Ocean, radiolarian ooze | 11-140 | Scholle et al., 1983 (Hays, 1965) | |
| Antarctic Ocean | 0.7-32 | 10,000 | Lisitzin, 1972 |
| Indian Ocean, diatom ooze | 5-20 | 100,000 | Schindel, 1980 (Kuznetsov, 1969) |
| Gulf of California, varved diatomites | 4,700-5,400 | Lowe, 1976 (Calvert, 1966) | |
| Vancouver Island fiord, varved diatomaceous sediment | 4,000 | Lowe, 1976 (Gross et al., 1963) | |
| Freshwater diatomites (average) | 300-1,000 | Kukal, 1971 | |
| a. General format of the table is after Schindel (1980), as are many of the data. Other major sources are Kukal (1971), who does not generally indicate his sources, methods, or duration of observation, and Lisitzin (1972). The reference given in parentheses is the primary data source; those not listed among the references may be found from the secondary source cited. b. Derived from many different types of measurement and from observations spanning vastly different time intervals. No corrections have been made for compaction. Longer periods ofobservation include some compaction, as well as more lacuna, than observations of shorter duration, a point emphasized by Schindel (1980). Rates are in Bubnoff (mm/103 yr = m/106 yr). c. Time interval of observation is years, unless indicated otherwise. *Thickness of individual flood deposits are reported as yearly rates on the assumption of annual flooding. These are more reasonable figures for modeling than calculated "instantaneous" sedimentation rates; moreover, the actual duration of flooding is rarely reported. It must be noted that most studies of floods are of exceptional events rather than of typical annual floods. For this reason some of the multiyear averages reported may be the most reasonable for simulations. |
|||
All-purpose sedimentation models incorporate accumulation rates for both terrigenous and carbonate sediments. These rates differ in general; they also respond in quite different fashions to changes in many other parameters. A wealth of data is available on rates of sediment accumulation (table 1). Well-documented values span such a range of rates and environments that the problem is in shopping: What are the appropriate values for the conditions to be simulated? The values in table 1 are grouped by depositional setting to facilitate selection. Different groupings, for example, by tectonic setting, may prove more appropriate for some models.
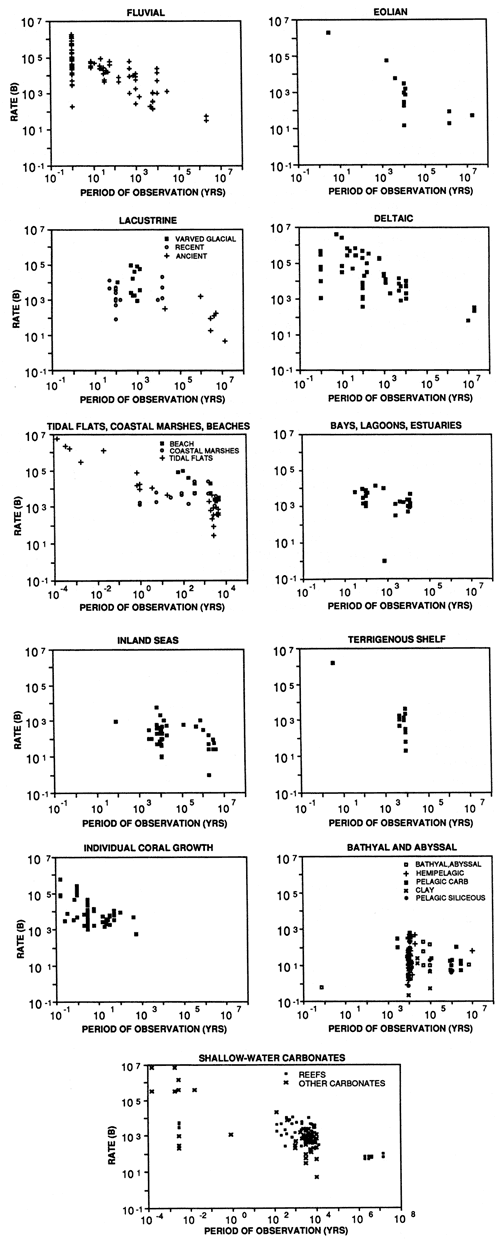
The time span of observation is an important determinant of sedimentation rates [Kukal, 1971; Schindel, 1980; see also Barrell (1917)]. In modeling this means that the time increment of the simulation may be important in choosing the appropriate sedimentation rate. Short-term observations invariably emphasize maximum rates produced by short-term events, such as floods or growth of organisms. It appears as though some rates approach infinity as the time of observation approaches zero (fig. 1). Clearly this is not the case, but the extrapolation emphasizes that short-term observations are not the most relevant to long-term considerations. The importance of duration of observation varies greatly among environments. Environments that suffer few perturbations (e.g., pelagic realms) have essentially uninterrupted sedimentation at rates that are virtually constant. In contrast, environments in which episodic events such as storms, floods, or turbidity currents dominate sedimentation typically have extreme short-term rates but intermittent deposition that modulates long-term averages. Schindel (1980) elegantly illustrated this phenomenon by plotting period of observation versus rate of sedimentation for a variety of environments. Figure 1 presents a series of such plots from the expanded data base of table 1.
Figure 1--Rates of sedimentation versus period of observation. The strong inverse relationship on most plots illustrates the gaps in the geologic record, the "long periods of boredom and short periods of terror" (Ager, 1981, p. 107). High "instantaneous" rates, for example, those generated by floods on floodplains and in deltas, are moderated by extended hiatuses. Note the contrast with more stable abyssal-plain environments. Even lakes show an inverse trend when ancient lacustrine environments are considered. Unfortunately, there seem to be no instantaneous rates on turbidity current deposition. Longer periods of observation include some apparent rate reduction because of compaction. No corrections for compaction have been made. Units of sedimentation rate are Bubnoffs (1 B = 1 mm/103 yr = 1 m/106 yr). Plots are logarithmic. Data from table 1. Expanded from Schindel (1980, fig. 1).
An important consideration incorporated in some two-dimensional programs [e.g., Lawrence et al. (1990)] is whether sediment is input from a point source, such as a river mouth, or a line source, such as a carbonate platform margin, or is uniformly distributed, as in pelagic sedimentation. A related consideration is that of throughput. As illustrated by a deltaic environment, some of the sediment input from the river accumulates in various subenvironments of the delta, but some is redistributed as hemipelagic or turbidite input to deeper environments. Menard (1961) provides some insight into apportionment to different environments in his analysis of diverse drainage basins (table 2).
Table 2--Partitioning of sediment by depositional environment.
| Source Area | Volume of Sediment (106 km3) |
Depositional Sites (% Volume) | ||
|---|---|---|---|---|
| Continental & Shelf |
Continental Rise | Abyssal Plain | ||
| Appalachian Mountains | 7.8 | 29 | 54 | 17 |
| Mississippi drainage basin | 11.1 | 81 | 11 | 8 |
| Himalaya Mountains | 8.5 | 49 | 1 | 50 |
| Data from Menard (1961, p. 159). | ||||
In the carbonate realm sedimentation input from outside sources is typically minor or negligible compared with in situ production. The production rate is thus of prime importance. Carbonate production rates vary so greatly in magnitude and in response to various controlling factors that for some purposes it is desirable to model these responses. Lerche et al. (1987) explored the impact of some major controls on carbonate production rates and modeled their influence on the configuration of carbonate bodies. They introduced depth- and distance-dependent functions for food supply, light ("photosynthetically active radiation"), temperature, salinity, and oxygen concentration. These variables illustrate that, in general, climate can affect production rates, in addition to the character, of carbonate sediments profoundly. There are exceptions to the generalization that carbonate sediments are tropical (Teichert, 1958; Milliman, 1975, p. 204; Lees, 1975; Leonard et al., 1981; Rao, 1981), but data on these production rates are lacking. Carbonate production rates are generally greater in windward settings than in leeward ones, producing an inherent asymmetry in carbonate platforms. The rather sparse data to substantiate this (see table 1, Shallow-Water Carbonates) suggest that rates differ by factors of 2-4. Only the individual coral growth rates and carbonate fixation estimated from alkalinity measurements are truly production rates; other values are accumulation rates in a strict sense, although they may approximate production rates. It is normally more expedient to use accumulation rates; most of the data are in these terms (table 1, Shallow-Water Carbonates, Bathyal and Abyssal Deposits), and accumulation constitutes the sedimentary record (table 3).
Table 3--Sedimentation rates of "chemical" rocks in the geologic record.
| Area | Rate (B)b | Period (yr)c | Reference |
|---|---|---|---|
| Platform carbonates | |||
| Late Cambrian Whipple Cave Fm., Nevada | 60 | ≈9 | Cook & Taylor, 1977 |
| Late Cambrian tidal flats, Appalachians | 25 | 18 | Laporte, 1971 |
| Late Cambrian subtidal, Appalachians | 34 | 18 | Laporte, 1971 |
| Early Ordovician Ellenburger Group, Texas | 15 | 27 | Sarg, 1988 (Loucks & Anderson, 1980) |
| Early Ordovician Arbuckle Group, Oklahoma | 110 | 27 | after Wilson, 1975 |
| Silurian pinnacle reefs, Michigan | 13 | 14 | Sarg, 1988 (Mesolella et al., 1974) |
| Late Silurian, Appalachians | 100 | ≈6 | Laporte, 1971 |
| Late Silurian, Midcontinent, USA | 25 | ≈6 | Laporte, 1971 |
| Early Devonian (Gedinnian) Helderberg Group, New York | 15 | 7 | Laporte, 1971 |
| Middle Devonian Keg River platform, Alberta, Canada | 14 | 11 | Sarg, 1988 (Schmidt et al., 1980) |
| Late Devonian Swan Hills, Alberta, Canada | 122 | 1 | Sarg, 1988 |
| Devonian (Givetian-Famenian), Canning basin | 30 | 20 | Schlager, 1981 (Playford & Lowrie, 1966) |
| Mississippian (Kinderhook-Meramec), Rocky Mountains | 50-80 | 15 | Schlager, 1981 (Rose, 1976) |
| Mississippian (Osage), Indiana | 15 | 2 | Brown et al., 1990 |
| Mississippian (Osage), Indiana, tidal flats | 350,000 | 1 x 10⁻⁶ | Brown et al., 1990 |
| Mississippian (Meramec-Chester), Rocky Mountains | 100-150 | 8 | Schlager, 1981 (Rose, 1976) |
| Pennsylvanian-Permian Nansen Fm. Sverdrup basin, Canada | 37 | 52 | Davies, 1977 |
| Early Permian Wichita Fm., Texas | 50 | 11 | Sarg, 1988 (Silver & Todd, 1969) |
| Early Permian (Longyinian), Yangtze platform China | 33-135 | 7 | Enos, 1992 |
| Early Permian (Qixian), Yangtze platform China | 5-150 | 6 | Enos,1992 |
| Early Permian (Maokouan), Yangtze platform China | 3-67 | 15 | Enos, 1992 |
| Late Permian (Longtan/Changxing), Yangtze platform, China | 7-110 | 15 | Enos, 1992 |
| Permian Clear Fork Fm., Texas | 365 | 1 | Sarg, 1988 (Sarg & Lehmann, 1986) |
| Permian Grayburg Fm., Delaware basin, USA | 160 | 1 | Sarg, 1988 (Sarg & Lehmann, 1986) |
| Permian Capitan Fm., Delaware basin, USA | 75 | 3 | Schlager, 1981 (Harms, 1974) |
| Permian Capitan reef, Delaware basin, USA | 55-83 | 9 | Sarg, 1988 (Silver & Todd, 1969) |
| Permian San Andres Fm., Delaware basin | 180 | 1 | Sarg, 1988 (Sarg & Lehmann, 1986) |
| Triassic (late Anisian-Ladinian) Northern Calcareous Alps | 100 | 7 | Schlager, 1981 (Ott, 1967) |
| Triassic (Early Camian) Dolomites | 300-500 | 4 | Schlager, 1981 |
| Late Triassic, Tethys (Alps, Apennines) | 100 | Bernoulli, 1972 | |
| Early Jurassic, Tethys (Alps, Apennines) | 15-40 | ≈20 | Bernoulli, 1972 |
| Jurassic Haynesville Fm., Texas | 95 | 2 | Sarg, 1988 |
| Late Jurassic Smackover Fm., Arkansas | 83 | 4 | Sarg, 1988 |
| Late Jurassic Friuli platform, southern Alps | 30-45 | 20 | Schlager, 1981 (Winterer & Bosellini, 1981) |
| Early Cretaceous Shuaiba, Middle East | 155 | 1 | Sarg, 1988 |
| Mid-Cretaceous (Albanian-Cenomanian) Golden Lane, Mexico | 100 | 15 | Enos,1977 |
| 80 | 15 | Wilson, 1975 (Coogan et al., 1972) | |
| Cretaceous-Cenozoic, Andros well, Bahamas | 35 | 120 | Wilson, 1975 (Goodell & Garinan, 1969) |
| Cretaceous-Cenozoic, Sunniland field, Florida | 30 | 120 | Wilson, 1975 |
| Mesozoic-Cenozoic, Persian Gulf (maximum) | 30 | 200 | Wilson, 1975 |
| Late Eocene, Enewetak | 170 | 3.4 | Saller, 1984 |
| Early Miocene, Enewetak | 76 | 7.1 | Saller, 1984 |
| Late Miocene Terumbu Fm., S. China Sea | 80-286 | 0.8-5.2 | Sarg, 1988 (Rudolph & Lehmann, 1987) |
| Quaternary, Enewetak | 11.5 | 0.59 | Saller, 1984 |
| Middle Miocene-Holocene, northern Great Barrier Reef 67-100 | 15 | Davies, 1988 | |
| Pelagic and deep-water carbonates | |||
| Late Cambrian Hales Lst. (lower) Nevada | 14 | ≈9 | Cook and Taylor, 1977 |
| Late Cambrian Frederick Lst., Maryland | 50 | 16 | Reinhardt, 1977 |
| Late Pennsylvanian-Early Permian Hare Fiord Fm. (lower), Sverdrup basin, Canada | 16 | 28 | Davies, 1977 |
| Late Cretaceous Marne a Fucoidi (argillaceous) | 15 | ≈15 | Bernoulli, 1972 |
| Early Jurassic (Pliensbachian), High Atlas, Morocco 63-100 | 5-8 | Evans & Kendall, 1977 | |
| Early Jurassic Monte Sant'Angelo Lst., Apennines (including platform debris) | 13 | 20 | Bernoulli, 1972 |
| Early Jurassic, Comiola Fm., Apennines, & Sihiais Lst, Greece, (pelagic & calc. turbidites) | 15-25 | ≈20 | Bernoulli, 1972 |
| Middle Jurassic Lamellibranch Lst, Apennines, S. Alps, Greece 3-8 | 19 | Bernoulli, 1972 | |
| Late Jurassic Oberalm Beds, Austrian Alps | 17-51 | 5-15 | Garrison & Fischer, 1969 |
| Late Jurassic Cat Gap Fm., N. Atlantic | 8-14 | 16 | Jansa et al., 1979 |
| Late Jurassic, Early Cret. Maiolica, Apennines, s. Alps | 10 | ≈23 | Bernoulli, 1972 |
| Late Cretaceous Chalk, UK | |||
| range | 3-60 | 32 | Scholle et al., 1983 (Hancock, 1975) |
| average | 15 | 32 | |
| Late Cretaceous Chalk, Danish trough, North Sea | 100 | Scholle et al., 1983 | |
| Late Cretaceous, Tongue of the Ocean | 8 | ≈30 | Bernoulli, 1972 |
| Cretaceous, Italy | |||
| range | 7-50 | Scholle et al., 1983 (Arthur, 1979) | |
| average | 12 | ||
| Late Cretaceous chalks, Western Interior, USA | |||
| range | 6.5-50 | Scholle et al., 1983 (Kauffman, 1977) | |
| average | 35 | ||
| Early and middle Miocene, nannofossil marls, Menorca Rise, Mediterranean | 103 | 7 | Hsü, Montadert et al., 1978 |
| Miocene Great Abaco Fm, N. Atlantic (intraclastic debris) | 9-43 | 4.6-6.3 | Jansa et al., 1979 |
| DSDP cores, to site 335, 3 my averages | 0.6-17 | 3 | Davies and Worsley, 1981 |
| Pacific Oceanic Plateaus | |||
| Aptian-Quaternary, Ontong Java Plateau | 11.1 | 113 | Jenkyns, 1978 (Moberly & Larsen, 1975) |
| Berriasian-Quaternary, Magellan Rise | 8.9 | 131 | Jenkyns, 1978 (Moberly & Larsen, 1975) |
| Barremian-Quaternary, Manihiki Plateau | 7.8 | 116 | Jenkyns, 1978 (Moberly & Larsen, 1975) |
| Berriasian-Quaternary, Shatsky Rise | 4.9 | 131 | Jenkyns, 1978 (Moberly & Larsen, 1975) |
| Cenomanian-Quaternary, Hess Rise | 3.6 | 96 | Jenkyns, 1978 (Moberly & Larsen, 1975) |
| Condensed Sequences | |||
| Late Devonian Cephalopodenkalk, Germany | 1.5-2 | 14 | Tucker, 1974 |
| Late Devonian Griotte, France | ≈7 | 7 | Tucker, 1974 |
| Late Triassic Hallstatt Lst., Austrian Alps | 0.5-1.5 | 20 | Garrison & Fischer, 1969 |
| Early Jurassic Adnet Beds, Austrian Alps | 0.6-1.0 | 15-25 | Garrison & Fischer, 1969 |
| Early-Middle Jurassic, Ammonitico Rosso, Apennines, s. Alps, Greece | 2.5-6.5 | Bernoulli, 1972 | |
| Early Pliocene nannofossil marls, Cretan Basin, Mediterranean | 9 | 2.4 | Hsü, Montadert et al., 1978 |
| Pliocene nannofossil marls, Menorca Rise, Mediterranean | 16 | 3.4 | Hsü, Montadert et al., 1978 |
| Pleistocene, Mediterranean | 1 | 1.9 | Cita et al., 1978 |
| Siliceous rocks | |||
| Silurian-Mississippian or Devonian Caballos Novaculite, Texas | 0.3-4.5 | 105-48 | Folk & McBride, 1976 |
| Devonian Arkansas Novaculite, Arkansas and Oklahoma (varved) | |||
| range | 1,000-2,500 | 0.1 | Lowe, 1976 |
| average | 1,250 | 0.1 | |
| Jurassic Radiolarite, Apennines | 3-9 | Schlager, 1974 | |
| Middle Jurassic Ruhpolding Radiolarite, Austria | 0.7-1 | 20-30 | Garrison & Fischer, 1969 |
| Tithonian-Barremian Radiolarite Group, s. Alps | 5.4 | 16 | Bernoulli, 1972 |
| Tithonian-Barremian Scisti ad Aptici, Apennines | 5.8 | 16 | Bernoulli, 1972 |
| Tithonian-Barremian U. Posidonia Beds, Greece | 3.1 | 16 | Bernoulli, 1972 |
| Eocene Bermuda Rise Fm, N. Atlantic, chert and siliceous mudstone | 5-8 | ≈10 | Jansa et al., 1979 |
| Miocene Monterey Fm, California, diatomite | 8-200 | Scholle et al., 1983 (Garrison & Douglas, 1981) | |
| Miscellaneous pelagic rocks | |||
| Anhydrite, L. Permian Castile Fm, W. Texas-New Mexico | 1,825 | 0.3 | Dunham, 1972 (Udden, 1924) |
| Carbonaceous clays, Early Cretaceous Hatteras Fm., N. Atlantic | 3-19 | 15-25 | Jansa et al., 1979 |
| Variegated clays, Late Cretaceous, N. Atlantic | 1-3 | 27 | Jansa et al., 1979 |
| Hemipelagic mud, Eocene-Pleistocene Blake Ridge Fm., N. Atlantic | 3-200 | 1.7-2.5 | Jansa et al., 1979 |
| Hemipelagic mud, Pleistocene, Nares Abyssal Plain, N. Atlantic | 400-500 | ≈0.05 | Kuijpers et al., 1987 |
| Evaporites | |||
| Late Silurian, Salina Group, Michigan basin | 180 | ≈6 | Alling & Briggs, 1961 |
| Late Silurian, Salina Group, Appalachians | 150 | ≈6 | Alling & Briggs, 1961 |
| Late Permian Castile Anhydrite, Texas-New Mexico (varved) | 1,825 | 0.3 | Dunham, 1972 (Udden, 1924) |
| Messinian, Sicily | 160 | 1.2 | Decima & Wezel, 1973 |
| Messinian, DSDP Site 124, Baleric basin | 67 | 1.2 | Decima & Wezel, 1973 |
| Messinian, DSDP Site 132, Tyrrhenian Sea | 30 | 1.2 | Decima & Wezel, 1973 |
| a. Bubnoff, 1 B = 1 mm/103 yr = 1 m/106 yr. b. Time intervals for stratigraphic units of Mesozoic and Cenozoic age are from Haq et al. (1987). Paleozoic intervals are from Palmer (1983). c. Not all primary sources are listed in references; see secondary source for original reference. |
|||
Production rates exclude transported sediment, whereas this sediment is inherently incorporated in the accumulation rate. This difference leads to examination of the well-established dogma in carbonate sedimentology that most sediment is produced in situ and that lateral transport is minor or negligible [cf. Wilson (1975, p. 7)]. Scale must again be considered. Lateral transport may be appreciable on the scale of a reef, the nearest approximation of a point source in most carbonate realms. It is generally considered negligible on the scale of a basin or a platform, but it is clear that significant transport is necessary for lateral progradation of the slopes of carbonate platforms (Bosellini, 1984; Playford et al., 1989; Eberli and Ginsburg, 1989). Transport must likewise control sedimentation in tidal flats where in situ production is negligible. Periplatform carbonate ooze (Schlager and James, 1978), an important component of highstand accumulations in proximal portions of basins (Boardman and Neumann, 1984; Droxler and Schlager, 1985; Shinn, Steinen et al., 1989), demonstrates lateral transport of carbonates in suspension. The possibility of some lateral transport must therefore be considered to realistically model carbonate accumulation in two or three dimensions [cf. Spencer and Demicco (1989)].
One-dimensional models, focused on simulation of sequences by vertical accretion, generally ignore lateral transport (Read et al., 1986). This essentially denies the possibility of autocyclic sequences that are controlled by lateral progradation of sediment (Ginsburg, 1971). Current two-dimensional models generally deal with progradation in carbonates in essentially the same way as progradation in terrigenous clastics is treated (Demicco and Spencer, 1989; Lawrence et al., 1990; Bosence and Waltham, 1990). Accumulation produces vertical aggradation until the available space is filled; surplus sediment is then redistributed into adjoining areas.
More data exist for pelagic sedimentation rates in both carbonate and noncarbonate sediments than for any other environment, in part because of the Deep Sea Drilling Project, which calculates accumulation rates for each datable sedimentary interval. Time spans are typically a few million years. Only a reasonable sampling of these data is presented in tables 1 and 3. Impetus to systematically glean rates from the 100-plus volumes of the Deep Sea Drilling Project is reduced by the fact that pelagic sedimentation rates are generally the lowest encountered and the most stable. In some settings, however, basinal sedimentation rates may be of prime importance. Harris (1989) demonstrated the influence of basinal accumulation rates on progradation of Middle Triassic platform margins in the Dolomites of northern Italy. Progradation of platform margins is typically in response to increased shallow-water production rates or reduced accommodation space, but increases in basinal accumulation rates, especially through shifts to siliciclastics, volcanoclastics, or evaporites, also can dramatically increase progradation rates (Harris, 1989).
Mixed carbonate and terrigenous environments are not yet fully integrated into most models, even those capable of dealing with either terrigenous or carbonate sources [cf. Lawrence et al. (1990)]. Several new considerations are introduced. The cumulative sedimentation from both sources influences the overall sedimentation rate. When some threshold in terrigenous input is reached, carbonate productivity and therefore accumulation rate are apparently suppressed (Mount, 1984; Walker et al., 1983). Neither the threshold nor the rate of suppression can be quantitatively defined at present.
It is likely that the type of impinging terrigenous sediment must be considered in addition to its volume. Organisms can probably tolerate accumulation of sand and coarser sediments better than they can tolerate mud. Sand creates unstable, shifting substrates; it probably has little direct impact on the organisms' metabolism. Finer suspended sediment, however, has the more direct influence of fouling the feeding mechanisms of many carbonate-producing organisms or of smothering them (Ginsburg and Shinn, 1964; Wilson, 1975, pp. 1-3), although it may also produce fluid substrates inimical to epifauna. It is nevertheless probable that the tolerance of carbonate organisms to mud is higher than generally recognized. Many carbonate rocks include a high percentage of mud, carbonate or terrigenous, that was introduced over a long period of time. Some carbonate producers were excluded, but others survived or even flourished, and carbonate sedimentation continued [cf. Laporte (1969, p. 115)]. There is no indication that the inhibiting effects of terrigenous mud are any different from those of carbonate mud; carbonate-producing organisms cannot be expected to be mineralogists. Terrigenous mud influxes can, however, include land-derived excess nutrients that could further suppress carbonate productivity (Hallock and Schlager, 1986, p. 394). Productivity suppression from sediments or pollutants introduced by human activity (Weiss and Goddard, 1977; Smith et al., 1981) offers the best possibilities for quantification, an example of Nietzschean serendipity.
Inundation of carbonate platforms during transgression apparently does not lead to the immediate onset of rapid production of carbonate sediment. Stated another way, carbonate production does not reach its full potential for a finite period (Schlager, 1981). Carbonate sediment accumulation therefore tends to lag the relative rate of sea-level rise, resulting in a deepening sequence (Read et al., 1986). The interval between initial inundation and onset of rapid sediment accumulation is the lag time. The formation of shoaling-upward platform cycles so common in the geologic record requires a lag time, according to current concepts of sedimentation (Read et al., 1986; Ginsburg, 1971). Otherwise, rapid carbonate sedimentation would maintain the sediment surface at sea level, and accumulation rates less than the relative rate of sea-level rise would form a continuously deepening sequence. Lag time is also essential to Ginsburg's (1971) autogenic cycles in which carbonate sediment builds up to sea level and progrades toward the platform edge, reducing the area of carbonate production until progradation ceases. To produce a transgression and begin a new cycle rather than maintain a steady-state aggradation, sediment accumulation must drop appreciably below the relative rate of subsidence for a finite period, the lag time.
Lag time has not been considered in terrigenous siliciclastic cycles because the capacity for the in situ production is lacking; sediment input does not necessarily change with submergence. It has been shown by analysis and by simulation that asymmetric shoaling-upward cycles can be produced by symmetric (e.g., sine wave) eustatic oscillations in sea level superposed on constant subsidence and sedimentation rates [cf. Jervey (1988)]. The rate of subsidence plus sea-level fall must exceed the rate of sediment supply near the inflection point of the sea-level curve, the point of maximum rate of fall. Such cycles could also be produced in carbonate sedimentation, of course, if the rate of sediment production were less than the combined maximum rates of sea-level fall and subsidence. Such solutions appear rather contrived, given the demonstrable rapid rates of carbonate production in shallow water (tables 1, Shallow-Water Carbonates; table 3, Platform Carbonates; Schlager, 1981). Moreover, the resulting cycles should invariably terminate with subaerial exposure of the upper part of the cycle and should commonly show a deepening portion of the cycle. Such elements are not rare in shoaling-upward platform cycles, but they do not appear to be the general case.
Although lag time has a profound effect on the character of simulated shoaling-upward cycles [cf. Read et al. (1986, p. 108), Goldhammer et al. (1987), and Koerschner and Read (1989)], processes that may cause sediment accumulation to temporarily lag subsidence are not recognized. It is clear that aggradation of sediment into the supratidal zone terminates carbonate production because of subaerial exposure. It is not clear why sediment production does not recommence immediately upon submergence. One possibility is that extremely shallow water results in temperature fluctuations or periodic exposure that inhibits carbonate production. The well-established increase in carbonate production rates with decreasing depth (fig. 2) may have an upper limit somewhat below sea level.
Figure 2--Carbonate sediment production as a function of depth. This curve is a hybrid, as were the original attempts to illustrate depth-related variations (Garrison and Fischer, 1969, fig. 22; Wilson, 1975, fig. 1-2); those curves have nevertheless proved fertile. This attempt to quantify the curve encountered a paucity of data on in situ production, especially at intermediate depths. These are needed to document the thresholds related to algal productivity, stressed by R. N. Ginsburg [cf. Wilson (1975) and Schlager (1981)], and the lower limit of coral-algal reef growth (≈70 m; James, 1977). In contrast, data on sedimentation rates, as opposed to production rates, in shallow-water and abyssal settings are abundant (table 1). Data used in constraining the curve are: BR, productivity of a Barbados reef in a sheltered setting (Steam et al., 1977). SR, compilation of accretion rates (mm/103 yr) of reefs at less than 5 m (15 ft) depths (Schlager, 1981). DR, compilation of accretion rates of reefs at 10-20 m (3065 ft) depth (Schlager, 1981). EF, EG, and EP, regressions of growth rate versus depth for three species of corals in Enewetak Atoll (Highsmith, 1979). JF and JB, regressions of growth rate versus depth of Acropora cervicornis on the forereef and backreef, respectively, in Jamaica (Tunnicliffe, 1983); these are linear growth rates of a branching coral, so they do not constrain accretion rates, but they should help define the variation with depth. C, T, and B, total productivity of carbonate mudbanks with varying degrees of restriction in south Florida [Upper Cross Bank, Tavernier Key, and Buchanan Banks, respectively (Bosence, 1988,1989)], paired with productivity from adjacent interbank areas (C', T', B'). PA, accumulation rates of pelagic carbonates from the equatorial Pacific; average for last million years and range for past 45 m.y. (van Andel et al., 1975). LY, the lysocline, a threshold of accelerated carbonate dissolution with depth, currently about 3,500-4,800 m (11,000-16,000 ft) (Scholle et al., 1983). CCD, the carbonate compensation depth, which ranges from <4,000 m (<13,000 ft) to >5,000 m (>16,000 ft) in the present oceans (Berger and Winterer, 1974). Benthic production is assumed to approach 0 with the disappearance of red algae at depths of approximately 250 m (800 ft). Pelagic production is a function of surface conditions, so it is shown constant with depth. Pelagic accumulation rates are affected primarily by dissolution on the seafloor. They decrease sharply below the lysocline and drop to 0 at the carbonate compensation depth. The conversion from production rates in grams per square centimeter per 1,000 years to sedimentation rates in Bubnoffs (mm/103 yr) varies with the porosity and mineralogy of the sediment; for example, 1 g/cm2/103 yr would equate to a sedimentation rate of 14.7 B for calcitic sediment with 75% porosity (mud), but only 8.5 B of aragonitic sediment with 40% porosity (sand). The conversion used, 10 B = 1 g/cm2/103 yr, would apply to aragonitic sediment with about 65% porosity.
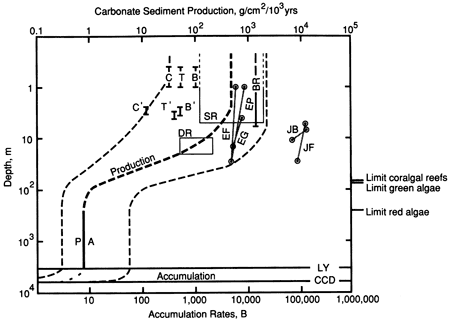
Another possibility is that lag time has a physical basis that reflects lack of accumulation above some profile of equilibrium, such as the wave base (Enos, 1989). Accumulation of modern carbonate sediments in south Florida is confined below a threshold depth that appears to be a function of fetch, suggesting that fair-weather or storm wave base is the control. Critical depths are approximately 3 m (10 ft) in the open shelf margin of south Florida and 2 m (7 ft) in the protected inner shelf of Florida Bay. In the more open Atlantic setting of Antigua, West Indies, the threshold appears to be approximately 5 m (16 ft) (Weiss and Multer, 1988).
If either control, decreased productivity or wave base, is valid, the appropriate parameter is lag depth rather than lag time. The corresponding time is determined by the rate of change in relative sea level, which is a function of eustasy, subsidence, compaction, and accumulation rate. Goldhammer et al. (1987) used a constant lag depth of 1 m (3 ft) in simulations of shoaling-upward cycles in the Middle Triassic of the Dolomites. In contrast, Read et al. (1986) assigned various durations to lag time and observed how this influenced the cycles generated. It is obviously desirable that the lag parameter be an empirical input rather than an unknown. If the lag parameter is closely related to water depth, then the threshold will not be reached simultaneously across a sloping surface. Deeper areas would begin accumulating sediment while shoal areas still lie above the threshold depth. If wave energy is the ultimate control, then sheltered areas would have a shallower lag depth than more exposed areas.
In summary, appropriate lag depth or time cannot be satisfactorily specified at present. Specification will be possible only when the processes are better understood. If the threshold is energy related, it should become possible to make reasonable assumptions if enough is known about the regional setting. It would also be clear what parameters must be studied in modern environments to obtain better definition for modeling.
Accommodation space (or accommodation potential) is the increment of room available for sediment accumulation. The upper limit of the space is the level above which net erosion will occur. In nearshore settings this is generally taken as sea level, although a profile of equilibrium with a basinward slope, a well-established concept in subaerial settings, probably also applies below sea level (Enos, 1977, pp. 106-107). The lower limit is the depositional interface, so the instantaneous accommodation space is approximately water depth. Because this increment varies with sediment accumulation, some arbitrary fixed datum, such as basement, is used to define accommodation space. Accommodation space then increases in response to eustatic rises in sea level, subsidence, and erosion. For some purposes these components can be lumped together in a single accommodation parameter. In general, it is essential to isolate the components and thereby illustrate their influence on accumulation patterns.
The changes in sea level used for simulations are based on simple mathematical models or empirical sea-level curves. Some short-term simulations use a constant sea level or a uniform rate of change. This is realistic only for time spans less that 103-104 years; in fact, small-scale high-frequency oscillations may have durations of only a few hundred years (Dominquez et al., 1987). Sine or cosine functions of various amplitudes and wavelengths, which may be superposed on other functions, are also used (Bice, 1988; Jervey, 1988). Empirical sea-level functions include extrapolations of Quaternary sea-level curves (Watney et al., 1989), inferred from the coupling of glacial ice volume with δ18O content of pelagic foraminifers, reflecting sea-surface temperatures (Matthews, 1984). These data have been extended through the Cenozoic (Prentice and Matthews, 1988; Matthews, 1984). For longer-term simulations sea-level curves derived by sequence stratigraphy (Vail et al., 1977; Haq et al., 1987) have been used, although these also have their critics (Miall, 1986; Burton et al., 1987; Matthews, 1988; Christie-Blick et al., 1988; Gradstein et al., 1988).
Curiously, no one seems to have gone back to the roots and directly applied the complex wave functions resulting from the periodicities in orbital parameters (Milankovich, 1941) to pre-Pleistocene fluctuations in sea level. This would seem particularly appropriate in view of the current overwhelming acceptance of the Milankovich band of orbital fluctuations as a cause of short-term changes in sea level, as inferred from their postulated control on climate (Milankovich, 1941) and thereby on the waxing and waning of glaciers (Denton and Hughes, 1983).
Subsidence also has at least three components: tectonics, isostasy, and compaction. Some models simply assume a constant rate of subsidence at a given point, which translates into a linear boundary (constant slope) in two dimensions [cf. Jervey (1988)]. This simple model essentially incorporates all three components.
Commonly used functions for tectonic subsidence are based on crustal stretching and cooling (McKenzie, 1978; Steckler and Watts, 1978; Sclater et al., 1980; Watts et al., 1982). These functions accurately model the subsidence of passive continental margins as they move away from spreading centers. Subsidence rate depends on the spreading rate and time or distance from the spreading center. Such functions also have been applied to continental-interior and cratonic basins and to oceanic islands and trenches (Watts et al., 1982). A different model for the tectonic component is provided by the theory of flexure of an elastic plate (Turcotte and Schubert, 1982, pp. 125ff). This model, which predicts differential subsidence (including local uplift) across a basin, seems most appropriate to foreland basins subjected to rapid tectonic and sediment loading from adjacent mountain belts.
Differential warping is generally superposed on the stately submergence of passive margins, expressed as local arches and basins. The Cape Hatteras and Cape Fear arches and the Baltimore Canyon basin of the Atlantic margin of North America are examples. Warping, local faulting, and regional subsidence can be empirically adjusted from burial history, which gives temporal changes in depth to basement. On active margins these three factors are typically the dominant components of subsidence. This empirical approach incorporates a second component of subsidence, isostatic adjustment.
The crust subsides isostatically in response to sediment loading. The amount of subsidence can be approximated as the thickness of mantle material with a density of approximately 3.2 g/cm3 that would be displaced by an increment of unconsolidated sediment with the appropriate density. For short spans of time, <104 years, it may be necessary to consider the viscous delay in response to loading.
Isostatic response to loading by water is not normally considered in current modeling programs. It is unlikely to be important in areas that are submerged to depths greater than the increment of sea-level rise so that loading would be uniform. In shallow-water areas, however, water loading is differential and may become a significant parameter as resolution improves through more sophisticated modeling and improved parameter definition.
The magnitude of compaction-induced subsidence can be three-quarters of the total thickness of muddy sediments because initial porosities are 70-80% (Hedberg, 1936; Rieke and Chilingarian, 1974; Enos and Sawatsky, 1981). Compaction-related subsidence can vary drastically with grain size and with degree of grain support, cementation, and sorting within sediments of the same composition. Variations related to composition are generally much less. Terrigenous muds are probably the most homogeneous sediment type in their compactional behavior; they generally show an exponential decline in porosity with depth. Absolute values vary appreciably among different basins, however (fig. 3). Far fewer empirical data are available on sandstones. The most comprehensive data set is that of G. I. Atwater and E. E. Miller (Blatt, 1979); these data indicate a linear rather than an exponential decrease in porosity with depth (fig. 4).
Figure 3--Representative fitted curves of porosity versus depth in mudrock. Locations: (1) Ciscaucasus, USSR. (2) Compilation, Tertiary and Quaternary. (3) Oklahoma, USA, Pennsylvanian and Permian. (4) Japan, Tertiary. (5) Venezuela, Tertiary. (6) Gulf Coast, USA, Tertiary. (7) Japan. (8) Compilation, mainly of locations 3 and 5. (9) Gulf Coast, USA, Tertiary. (10) Gulf Coast, USA, Tertiary. From Rieke and Chilingarian (1974, p. 42); references are given therein.
Figure 4--Porosity versus depth of late Tertiary sandstones from Louisiana, US Gulf Coast. The 17,367 analyses have been averaged in thousand-foot intervals for calculation of the least-squares fit. Unfortunately, no error estimates or petrology are available. Unpublished data of G. I. Atwater and E. E. Miller (1965); from Blatt 979, p. 146).
Compaction of carbonates has generated considerable controversy (Weller, 1959; Pray, 1960; Shinn, Halley et al., 1977; Shinn and Robbin, 1983). For pelagic carbonate muds a tremendous volume of data is available from the porosity versus depth curves generated by the Deep Sea Drilling Project. Available summaries are selective and out of date (fig. 5). The most comprehensive data set for shallow-water carbonates (fig. 6) is that of Schmoker and Halley (1982). Their results do not differentiate porosity loss by cementation from that by physical compaction. This point is important for modeling because changes in bulk volume, not in porosity, determine subsidence. Cement from external sources reduces porosity without reducing bulk volume; thus porosity curves converted to bulk volume loss may exaggerate compaction. This also applies to muddy carbonate rocks and to siliciclastics, although imported cement is probably less common. Conversely, secondary porosity produced by dissolution at depth (Schmidt and McDonald, 1979) might lead to underestimates of compaction. Reef carbonates are typically considered noncompactible in simulations and burial history routines, but even in these lithologies considerable compaction may ensue through pressure solution at depth [Mossop (1972) documents 13% compaction; Anderson and Franseen (1991) document 30%].
Figure 5--Porosity and depth in pelagic carbonates from the Pacific and Indian oceans. The left column is from Deep Sea Drilling Project (DSDP) site 167, Magellan Rise, central North Pacific. The right column has samples with 80% or more calcium carbonate from 11 other DSDP sites. Note that the ages apply only to site 167 (left-hand column). From Schlanger and Douglas (1974, p. 119).
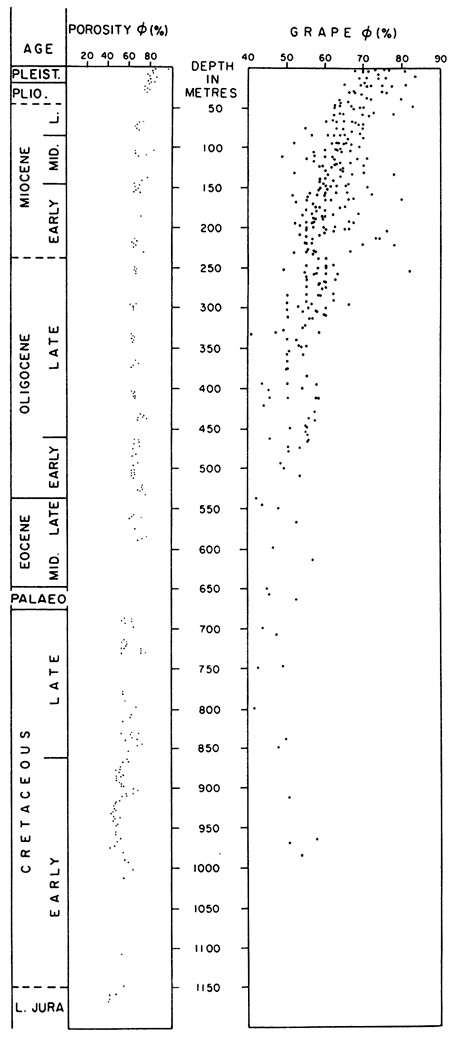
Figure 6--(a) Porosity versus depth from shallow-water carbonates, Pleistocene to Early Cretaceous in age, from south Florida. N = 1,302; 167 data points are gravity data from boreholes at shallow depths; the remainder are data points from porosity logs. From Schmoker and Halley (1982, p. 2,566). (b) Data from part a separated into dolomites (75-100% dolomite; N = 336) and limestones (75-100% CaCO3; N = 489). From Schmoker and Halley (1982, p. 2,569).
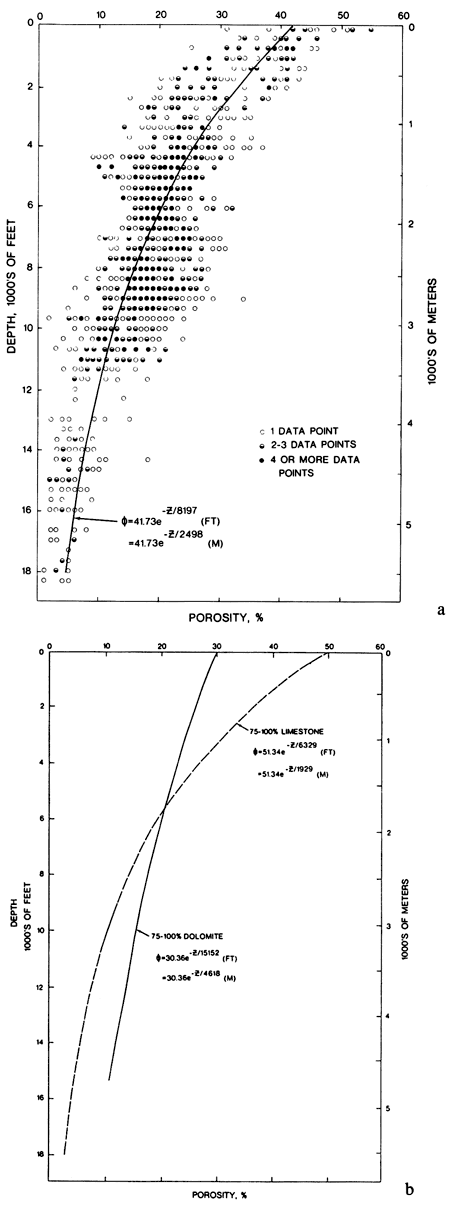
Compaction curves for mixed terrigenous and carbonate sediments have not generally been isolated, although data are certainly available from the Deep Sea Drilling Project, where carbonate content is measured for the same intervals as porosity. Compaction curves of muddy terrigenous and carbonate sediments (figs. 3 and 5) generally do not differ sufficiently to preclude the use of the curve for the dominant sediment type or, preferably, a weighted average of the two curves for mixed sediments. A further consideration in the compaction of mixed sediments, not incorporated into existing models, is the possible effect on pressure solution. Conventional wisdom is that terrigenous clay in excess of approximately 10% enhances the susceptibility of carbonate sediments to pressure solution (Wanless, 1979; Bathurst, 1975; Dunnington, 1967). Documentation is inadequate and the mechanisms are not understood, but good empirical evidence that terrigenous clays do enhance pressure solution has been provided by McNeice (1987). It would be possible to incorporate this threshold in modeling, but there are scant quantitative data on pressure solution versus depth and even less on the relationship between pressure solution and terrigenous content of sediments.
In rapidly accumulating muddy sediments the possible generation of overpressure and the consequent retardation of compaction should be considered (Bradley, 1975; Plumley, 1980; Carstens and Dypvik, 1981; Shi and Wang, 1986). Overpressure resulting from sedimentation in excess of the rate at which pore fluids can escape would be amenable to modeling (Mudford and Best, 1989).
Two environments of erosion must be considered in sedimentary modeling. Subaerial erosion contributes to sediment input and modifies the final configuration of the eroded area. Submarine erosion involves redistribution of sediment and corresponding changes in the final configuration.
Rates of subaerial erosion are complex functions of such factors as elevation, lithology, climate, and vegetation. The first two parameters may evolve from the simulation, and the last two, largely independent of parameters being modeled, are either ignored or indirectly specified by user-selected values. If the factors causing erosion are not a focus of the study, the typically complex interrelations of erosion are best treated by using empirical net rates of erosion. Estimates of erosion rates in various climates, terrains, and lithologies (tables 4-8) are provided by Corbel (1959a,b), Menard (1961), Ritter (1967), and Meybeck (1976). An empirical relationship potentially useful in modeling was derived by Ahnert (1970):
d = 0.1535h, (1)
where d is the rate of denudation in Bubnoff units (mm/103 yr) and h is relief in meters. The relationship proposed by Schumm (1963) for relatively small drainage basins [< 1,500 mi2 (4,000 km2)] in semi-arid areas of the western United States may be more convenient in modeling:
log D = 26.9H - 1.7, (2)
where D is the denudation rate in feet per 1,000 years (305 B) and H is the ratio of relief to the length of a drainage basin. The relief to length ratio is dimensionless and can be represented by the slope of a surface tilted above sea level in a simulation.
Table 4--Erosion rates by relief and climatea
| Relief and Climateb | Rate of Chemical Erosion (B) |
Total Rate of Erosion (B) |
|---|---|---|
| Lowlands | ||
| Periglacial, permafrost (15/yr); Bear Lake, Canada | 13 | 15 |
| Continental, cold (28-75/yr); E. Canada, Sweden | 17 | 19 |
| Maritime, temperate (33/yr); NE Europe | 24 ± 12 | 32 ± 11 |
| Continental, temperate, Mississippi basin | 15 | 59 |
| Missouri basin (4.4/yr) | 6 | 55 |
| Mississippi basin (Ritter, 1967) | 14 | 46.4 |
| Mississippi basin, Quaternary (Menard, 1961) | 42 | |
| Continental, and (0.7/yr); New Mexico | 1 | 12 |
| Tropical desert, central Sahara | 1? | |
| Hot, seasonally wet and dry; Paraguay | 11 | 32 |
| Tropical, humid (38/yr); Congo basin | 15 | 22 |
| Mountains | ||
| Periglacial (20/yr); Brooks Range, Alaska | 12 | 300 |
| Periglacial, humid (250/yr); Norway | 325 | 580 |
| Maritime, humid (482 cm); Juneau, Alaska | 192 | 800 |
| Maritime, cold-temperate (118/yr); glaciated Alps | 99 ± 59 | 203 ± 181 |
| Maritime, temperate; Swiss Alps (Blatt et al., 1980) | 70-910 | |
| Alps, long-term (volume Rhone fan; Blatt et al., 1980) | 400 | |
| Maritime, temperate; Mt. Ranier (Blatt et al., 1980) | 3,000-8,000 | |
| Maritime, temperate; Appalachians (Menard, 1961) | 8 | |
| Appalachians, southern (Blatt et al., 1980) | 41 | |
| Long-term (Cenozoic detrital sed. vol.; Matthews, 1975) | 27 | |
| Appalachians, northern (Blatt et al., 1980) | 48 | |
| Long-term (Cenozoic detrital sed. vol.; Matthews, 1975 | 5 | |
| Mediterranean, high mountains (62/yr); Italy, France | 78 | 449 |
| Mediterranean, semi-arid (60/yr); Italy | 40 | 100 |
| Continental, temperate (90/yr); central Europe | 50 ± 25 | 102 ± 61 |
| Continental, Himalayas (Menard, 1961) | 1,000 | |
| Himalayas, Kosi R. (100/yr) | 1,145 | |
| Himalayas (Blatt et al., 1980) | 720 | |
| Hot and humid (76/yr); Usumacinta, Mexico & Guatemala | 30 | 92 |
| Hot and and (4-10/yr); southeast USA | 7 | 200 |
| Hot and and (0.6/yr), Tunisia | 8 | 130 |
| After Corbel (1959b), except as noted. Corbel assumed rock densities of 2.5 g/cm3 to convert weights of material transported to surface lowering. a. Units of erosion are Bubnoff (mm/103 yr = m/106 yr). b. Figures in parentheses are runoff (precipitation minus evapotranspiration) in centimeters per year. |
||
Table 5--Regional erosion rates in the United States
| Region | Mechanical (B) | Chemical (B) | Total Rate of Erosion (B) |
Period (yrs) |
|---|---|---|---|---|
| North Atlantic | 23.7 | 18.5±2.2 | 42.2 | 4-10 |
| South Atlantic & eastern Gulf of Mexico | 16.8 | 15.9±5.3 | 32.7 | 4-8 |
| Western Gulf of Mexico | 34.6 | 8.1±5.3 | 42.7 | 6-9 |
| Mississippi River basin | 32.4 | 14.0±0.6 | 46.4 | 12 |
| Colorado River basin | 142.8 | 5.9±2.7 | 148.7 | 32 |
| Pacific drainage in California | 71.8 | 15.9±5.5 | 87.7 | 3-13 |
| Columbia River basin | 15.0 | 16.5±3.6 | 31.5 | 2-4 |
| After Ritter (1967). Suspended and dissolved loads only; bed loads not included. Assumed rock densities are 2.64 g/cm3 Erosion rates given in Bubnoff (mm/103 yr = m/106 yr). |
||||
Table 6--Rates of erosion from major drainages of the world
| River | Drainage Area (103 km2) |
Runoff (cm/yr) |
Mechanical Erosion (B) |
Chemical Erosion (B) |
Total Erosion (B) |
|---|---|---|---|---|---|
| Amazon (Brazil) | 6,300 | 88 | 39.9 | 17.6 | 47.5 |
| Congo (Zaire) | 4,000 | 31 | 5.0 | 4.4 | 9.4 |
| Congo (Corbel, 1959b)* | 38 | 6.3 | 14.4 | 20.7 | |
| Mississippi (USA) | 3,267 | 17.8 | 36 | 15 | 51 |
| Mississippi (Corbel, 1959b)* | 42 | 14.2 | 56.2 | ||
| Mississippi (Ritter, 1967) | 32.4 | 14.0 | 46.4 | ||
| Nile (Egypt) | 3,000 | 2.8 | 14 | 2.2 | 16 |
| Parana (Argentina) | 2,800 | 20 | 15 | 7.6 | 23 |
| Parana (Corbel, 1959b)* | 20 | 10 | 30 | ||
| Yenisey (Siberia, USSR) | 2,600 | 21 | 1.9 | 11 | 13 |
| Ob (Siberia, USSR) | 2,500 | 15 | 2.4 | 7.6 | 10 |
| Lena (Siberia, USSR) | 2,430 | 21 | 2.4 | 14 | 16 |
| Yangtze (PRC) | 1,950 | 35 | 186 | >186 | |
| Amur (Heilong) (Siberia) | 1,850 | 19 | 5.2 | 4.1 | 9.3 |
| Mackenzie (Canada) | 1,800 | 17 | 25 | 15 | 39 |
| Madeira (Brazil) | 1,380 | 73 | 59 | 16 | 75 |
| Hsi (Pearl) (PRC) | 1,350 | 18 | 34 | >34 | |
| Volga (Russia, USSR) | 1,350 | 20 | 7.2 | 22 | 29 |
| Zambesi (Mozambique) | 1,340 | 17 | 28 | 4.4 | 33 |
| Niger (Nigeria) | 1,125 | 17 | 23 | 3.4 | 26 |
| Murray (Australia) | 1,070 | 2.1 | 11 | 3.1 | 14 |
| St. Lawrence (Canada) | 1,025 | 32.8 | 1.9 | 20 | 22 |
| Orange (South Africa) | 1,000 | 9.1 | 57 | 4.5 | 61 |
| Ganges (Bangladesh) | 975 | 37.8 | 203 | 30 | 233 |
| Indus (Pakistan) | 950 | 22 | 189 | 25 | 214 |
| Orinoco (Venezuela) | 950 | 100 | 34 | 20 | 54 |
| Danube (Romania) | 805 | 25.2 | 32 | 28 | 60 |
| Mekong (Vietnam) | 795 | 72.5 | 165 | 28 | 193 |
| Negro (Brazil) | 755 | 189 | 3.8 | 3.8 | 7.6 |
| Huang (Yellow) (PRC) | 745 | 10.7 | 814 | >814 | |
| Columbia (USA) | 670 | 37.5 | 16 | 20 | 36 |
| Columbia (Ritter, 1967) | 15.0 | 16.5 | 31.5 | ||
| Kolyma (Siberia, USSR) | 645 | 18.2 | 3.5 | >3.5 | |
| Colorado (USA) | 635 | 3.2 | 330 | 8.7 | 338 |
| Colorado (Corbel, 1959b)* | 4.4 | 207 | 10.7 | 217.8 | |
| Colorado (Ritter, 1967) | 143 | 5.9 | 149 | ||
| Chari (Chad) | 600 | 6.9 | 2.5 | 1.7 | 4.1 |
| Brahmaputra (Bangladesh) | 580 | 104 | 519 | 49 | 568 |
| Xingu (Brazil) | 540 | 45 | 0.3 | 1.1 | 1.4 |
| Tapajós (Brazil) | 500 | 45 | 0.5 | 1.4 | 1.8 |
| Dnieper (Ukraine, USSR) | 500 | 10 | 0.8 | 8.3 | 9.2 |
| Amu-Darya (Uzbekistan, USSR) | 450 | 10 | 79 | 23 | 102 |
| Irrawady (Burma) | 430 | 98 | 265 | - | >265 |
| Don (Russia, USSR) | 420 | 6.6 | 5.2 | 13 | 18 |
| Tigris-Euphrates (Shatt El Arab) (Iraq) | 410 | 14 | 95 | 16 | 110 |
| Maranon (Peru) | 407 | 85 | 95 | 34 | 129 |
| Ucayali (Peru) | 400 | 76 | 116 | 52 | 169 |
| Uruguay (Uruguay) | 350 | 45 | 15 | 8.7 | 24 |
| Magdalena (Colombia) | 240 | 98 | 379 | 44 | 423 |
| Rhine (Corbel, 1959b)* | 225 | 49 | 1.9 | 28.3 | 30.2 |
| After Meybeck (1976) with some additions and comparison. Estimates are based on suspended and dissolved loads only; bed loads are not included, except as noted by asterisks. Converted from weights assuming rock densities of 2.64 g/cm3 (Ritter, 1967). Units of erosion are Bubnoff (mm/103 yr = m/106 yr). *Estimate includes bed load. |
|||||
Table 7--Rates of erosion of rivers fed by glaciers
| River | Rate of Erosion (B) |
|---|---|
| Hidden Glacier (Alaska; rapid advance) | 30,000 |
| Muir (Alaska) | 5,000 |
| Bosson (Chamonix, France) | 1,800 |
| Nant Blanc (French Alps) | 1,600 |
| Heilstuga (Norway) | 1,400 |
| Memurelven (Norway) | 1,600 |
| Auserfjötur (Iceland) | 2,200 |
| Jokullsá (Iceland) | 2,200 |
| Hoffelsjökull (Iceland) | 3,200 |
| Hofsjökull (Iceland) | 1,800 |
| Isortok (Greenland) | 2,500 |
| Saskatchewan (Canada) | 2,000 |
| From Corbel (1959b, p. 16). Includes estimates of bed load. Assumed rock densities are 2.5 g/cm3. B = Bubnoff (mm/103 yr). |
|
Table 8--Average erosion rates by continent.
| Continent | Mechanical | Chemical | Total | |||
|---|---|---|---|---|---|---|
| L/Ka | G&Mb | L/K | G&M | L/K | G&M | |
| North America | 27.9 | 33.0 | 15.0 | 13.0 | 42.8 | 46.0 |
| South America | 35.3 | 23.2 | 20.9 | 11.6 | 56.2 | 34.8 |
| Asia | 62.8 | 122.4 | 16.2 | 12.6 | 79.0 | 134.9 |
| Africa | 17.7 | 6.2 | 9.6 | 9.0 | 27.3 | 15.2 |
| Europe | 16.5 | 9.8 | 11.9 | 18.0 | 28.4 | 27.8 |
| Australia | 12.2 | 10.0 | 4.2 | 1.0 | 16.4 | 10.9 |
| World total | 36.8 | 53.1 | 14.1 | 11.4 | 50.9 | 64.5 |
| World total (Ritter, 1967) |
43-89 | 9.9 | 53-99 | |||
| Units are Bubnoff: 1 B = 1 mm/103 yr = 1 m/106 yr. Estimates in tons per square kilometer per year were converted using 2.64 g/cm3 as the average density of crustal rocks (Ritter, 1967). Continental areas cited by Kukal (1971, p. 30) were used in calculations for uniformity between estimates. a. Estimates from Lopatin (1952), in Kukal (1971, p. 30). b. Estimates from Garrels and Mackenzie (1971, p. 120). |
||||||
Erosion in subaerially exposed carbonate sediments is typically ignored. For short time spans (perhaps 104-105 yr) this is probably justified, because the initial stage of carbonate erosion is typically dissolution, which produces secondary porosity, not a lowering of the land surface. Over more extended periods, however, the collapse of larger pore spaces (e.g., caverns) can result in significant lowering of the landscape, which may be differential and partially predictable (Purdy, 1974). Most of the data on erosion in carbonate terrains are values for net transport of ions by rivers. With simplifying assumptions, these can be expressed as changes in elevation in the landscape (table 9).
Table 9--Rates of chemical erosion of limestones.
| Climate/Location | Runoff (cm/yr) |
Erosion Rate (B) |
|---|---|---|
| Arctic, dry | ||
| Svalbard; Tanana, Alaska | 40 | |
| Victoria Island, Canada | 5 | |
| Somerset I, Canada (A & S) | 10 | 2 |
| Arctic, humid | ||
| Gold Creek, SE Alaska | 530 | |
| Capilano, British Columbia | 420 | |
| Svartisen, northern Norway | 400 | |
| Maritime, cold | ||
| Vercors, French Alps | 240 | |
| Lismore, Scotland | 150 | |
| St. Casimir, Quebec | 160 | |
| St. Théresé, Quebec | 120 | |
| NW England (Sweeting) | 40 | |
| Maritime, temperate | ||
| Derbyshire, England (A & S) | 83 | |
| Fergus R., Ireland (A & S) | 55 | |
| Mendip Hills, England (A & S) | 82 | 63 |
| Thames, England (Sweeting) | 104 | |
| range | 13-288 | |
| Lee, Essex, England (Sweeting) | 63 | |
| range | 23-155 | |
| Derwent, England (Sweeting) | 66-197 | |
| Lesse, Belgium | 27 | |
| Tamis, Yugoslavia | 21 | |
| Alpine | ||
| Triglav, Yugoslavia (A & S) | 280 | 130 |
| Tolminka, Yugoslavia (A & S) | 310 | 102 |
| Tatry Mtns., Czechoslovakia (A & S) | 122 | 50 |
| range | 110-160 | 33-95 |
| Jura Mtns., Switzerland (A & S) | 98 | |
| Continental, cold winters | ||
| Jasper, Alberta | 40 | |
| Whitehorse, Yukon Terr., Canada | 32 | |
| Fort Simpson, Mackenzie Terr., Canada | 40 | |
| Gulf of Bothnia, Finland | 30 | |
| Continental, temperate | ||
| Kentucky (Sweeting) | 64 | |
| range | 3-297 | |
| Coolamon, NSW, Australia (A & S) | 120 | 24 |
| Krakow, Poland | 25 | 20 |
| Texas, U.S.A. | 4 | 5 |
| Mediterranean | ||
| Postojna, Yugoslavia (A & S) | 160 | 110 |
| Bosna, Yugoslavia (A & S) | 150 | 90 |
| Trieste, Italy (A & S) | 70 | 48 |
| Senj, Yugoslavia (A & S) | 46 | 28 |
| Podovi, Yugoslavia (A & S) | 25 | 15 |
| Yugoslavia, karst mountains (humid) | 60 | |
| Marseilles (dry) | 10 | |
| South Algeria (arid) | 6 | |
| Tropical, humid | ||
| Jamaica (A & S) | 105 | 73 |
| range | 55-135 | 40-96 |
| Puerto Rico (A & S) | 70 | 41 |
| Florida (A & S) | 50 | 33 |
| Kissimmee, Florida (Sweeting) | 27 | |
| range | 16-63 | |
| Usumacinta R., Mexico & Guatemala, mountains | 45 | |
| Champoton R., Yucatan, lowland | 16 | |
| Sources: Corbel (1959b, p. 19; 1959a), Sweeting (1964), and Atkinson and Smith (A & S) (1976). Units of erosion are Bubnoff: 1 B = 1 mm/103 yr= 1 m/106 yr. |
||
The erosion of subaerially exposed terrigenous terrains has different implications for modeling than erosion of carbonate terrains in both the erosional and depositional realms. Carbonate material is removed primarily by dissolution and does not directly produce new sediment (Bosence and Waltham, 1990). Eroded terrigenous material must be redistributed and adjusted for any changes in bulk density between the original material and the unconsolidated sediment.
Submarine erosion by waves or by slumping and sliding can be significant. Some modeling programs test for slope stability after each increment of sediment is added and remove material where the simulated slopes are in excess of what is considered stable (Lawrence et al., 1990), a value commonly specified by the user. Marine engineering practice provides some empirical data (Roberts et al., 1980). Angles of large-scale slopes in carbonates and siliciclastics have been summarized by Schlager and Camber (1986); slopes of carbonate platforms tend to be much steeper and to covary with height (fig. 7). Few data are available on submarine erosion rates by waves and other shear forces. Rates of intertidal erosion of carbonates (table 10) (Trudgill, 1985) are apparently the nearest approximations available.
Table 10--Marine erosion: Coastal erosion of limestones
| Location | Substrate | Rate |
|---|---|---|
| Red Sea | Reef limestone | 1,000 |
| Barbados | Beach rock (grazers) | 1,000-2,000 |
| Bikini Atoll, Marshalls | Beachrock | 300 |
| Southwestern Australia | Beachrock | 27,000-67,000 |
| Heron Island, Great Barrier Reef | Beachrock | 500 |
| Aldabra Atoll, Indian Ocean | Reef limestone (intertidal) | 500-4,000 |
| Aldabra Atoll, Indian Ocean | Reef limestone (subaerial) | 260 |
| Aldabra Atoll, Indian Ocean | Reef limestone (with sand) | 1,250 |
| Aldabra Atoll, Indian Ocean | Reef limestone (no sand) | 1,010 |
| From Trudgill (1985, p. 159). Surface lowering in B (mm/103 yr) | ||
Figure 7--Slope angles on large slopes: angle of upper one-third of slope versus height of slope. Contours indicate concentrations of 0.5%, 1%, and 2% of total sample in unit area of 0.25 km x 0.05 tan S, measured as the moving average of 9 unit cells. Carbonate sample includes Bahamas and Marshall Islands (atolls) (N= 413). Siliciclastic sample is based on Atlantic continental slopes (N = 72). Carbonate slopes steepen with height up to at least 5,000 m (15,000 ft). Siliciclastics follow this trend only to 500 m (1,500 ft); slope height above 500 m has no influence on steepness of siliciclastic slopes. Data of Schlager and Camber (1986); from Schlager (1988).
This review was undertaken to summarize optimum sources of input data for sedimentation simulations and to point out where additional data or refinement of concepts is needed from fieldwork. The trinity of parameters-accumulation rates, lag time, and accommodation space-are judged to be the most fundamental. Available data are summarized in the figures and tables. Urgent needs are an elucidation of lag time, quantification of compaction by pressure solution, and evaluation of the effects of siliciclastic influx on both carbonate sedimentation and pressure solution.
Lynn Watney persuaded me to undertake this summary, and Evan Franseen shepherded the later stages of preparation. Hal Wanless made many perceptive criticisms that helped to improve the manuscript, and Tony Simo smoothed some rough edges. Randy Farr was a skilled and patient coach at computer drafting. Special thanks are due to Nuria Wells for processing countless drafts, including the horrendous table 1.
Adey, W. H., 1975, The algal ridges and coral reefs of St. Croix--their structure and Holocene development: Atoll Research Bulletin, v. 187, p. 1-67
Adey, W. H., 1977, Shallow water Holocene bioherms of the Caribbean Sea and West Indies: Third International Coral Reef Symposium, Proceedings, Miami, Florida, v. 2, p. xxi-xxiv
Adey, W. H., Macintyre, I. G., Stuckenrath, R., and Dill, R. F., 1977, Relict barrier reef system of St. Croix--its implications with respect to late Cenozoic coral reef development in the western Atlantic: Third International Coral Reef Symposium, Proceedings, Miami, Florida, v. 2, p. 15-21
Ager, D. V., 1981, The nature of the stratigraphical record: 2d ed., Halstead, New York, 122 p.
Ahnert, F., 1970, Functional relationship between denudation, relief, and uplift in large mid-latitude drainage basins: American Journal of Science, v. 268, p. 243-263
Aigner, T., Doyle, M., Lawrence, D., Epting, M., and Van Vliet, A., 1988, Quantitative modeling of carbonate platforms--some examples; in, Controls on Carbonate Platform and Basin Development, Crevello, P. D., Wilson, J. L., Sarg, J. F., and Read, J. F., eds.: Society of Economic Paleontologists and Mineralogists, Special Publication 44, p. 27-37
Alling, H., and Briggs, L., 1961, Stratigraphy of Upper Silurian Cayugan evaporites: American Association of Petroleum Geologists, Bulletin, v. 45, p. 515-547
Anderson, N. L., and Franseen, E. K., 1991, Differential compaction of Winnipegosis reefs--a seismic perspective: Geophysics, v. 56, no. 1, p. 142-147
Antevs, E., 1925, Retreat of the last ice-sheet in eastern Canada: Geological Survey of Canada, Memoir 146, 142 p.
Arthur, M. A., 1979, Paleoceanographic events--recognition, resolution, and reconsiderations: Reviews of Geophysics, v. 56, no. 1, p.142-147
Atkinson, T. C., and Smith, D. I., 1976, The erosion of limestones; in, The Science of Speleology, Ford, T. D., and Cullingford, C. H. D., eds.: Academic Press, London, p. 151-177
Baker, P. A., and Weber, J. N., 1975, Coral growth rate-variation with depth: Earth and Planetary Science Letters, v. 27, p. 57-61
Barrell, J., 1917, Rhythms and the measurement of geologic time: Geological Society of America, Bulletin, v. 28, p. 745-904
Bathurst, R. G. C., 1975, Carbonate sediments and their diagenesis: 2d ed., Elsevier, New York, 658 p.
Berger, W. H., 1974, Deep-sea sedimentation; in, The Geology of Continental Margins, Burk, C. A., and Drake, C. L., eds.: Springer-Verlag, New York, p. 213-241
Berger, W. H., and Winterer, E. L., 1974, Plate stratigraphy and the fluctuating carbonate line; in, Pelagic Sediments--On Land and under the Sea, Hsü, K. J., and Jenkyns, H. C., eds.: International Association of Sedimentologists, Special Publication 1, p. 1148
Berger, W. H., Killingley, J. S., and Vincent, E., 1978, Stable isotopes in deep-sea carbonates--box core ERDC-92, west equatorial Pacific: Oceanologica Acta, v. 1, p. 203-216
Bernard, H. A., LeBlanc, R. J., and Major, C. F., 1962, Recent and Pleistocene geology of southeast Texas; in, Geology of the Gulf Coast and Central Texas, Rainwater, E. H., and Zingula, R. P., eds.: Houston Geological Society, p. 175-224
Bernoulli, D., 1972, North Atlantic and Mediterranean Mesozoic facies--a comparison; in, Initial Reports of the Deep Sea Drilling Project, Hollister, C. D., Ewing, J. I., et al.: US Government Printing Office, Washington, DC, v. 11, p. 801-871
Bice, D., 1988, Synthetic stratigraphy of carbonate platform and basin systems: Geology, v. 16, no. 8, p. 703-706
Bigarella, J. J., 1972, Eolian environments--their characteristics, recognition, and importance; in, Recognition of Ancient Sedimentary Environments, Rigby, J. K., and Hamblin, W. K., eds.: Society of Economic Paleontologists and Mineralogists, Special Publication 16, p. 12-62
Blatt, H., 1979, Diagenetic processes in sandstones; in, Aspects of Diagenesis, Scholle, P. A., and Schluger, P. R., eds.: Society of Economic Paleontologists and Mineralogists, Special Publication 26, p. 141-157
Blatt, H., Middleton, G., and Murray, R., 1980, Origin of sedimentary rocks: 2d ed., Prentice-Hall, Englewood Cliff, New Jersey, 782 p.
Boardman, M. R., and Neumann, A. C., 1984, Sources of periplatform carbonates--Northwest Providence Channel, Bahamas: Journal of Sedimentary Petrology, v. 54, no. 4, p. 1, 110- 1, 123
Bosellini, A., 1984, Progradation geometries of carbonate platforms--examples from the Triassic of Dolomites, northern Italy: Sedimentology, v. 3 1, no. 1, p. 1-24
Bosence, D. W., 1988, Carbonate budgets for carbonate mounds, Florida, USA: Sixth International Coral Reef Symposium, Proceedings, Townsville, Australia, v. 2, p. 529-534
Bosence, D. W., 1989, Biogenic carbonate production in Florida Bay: Bulletin of Marine Science, v. 44, no. 1, p. 419-433
Bosence, D., and Waltham, D., 1990, Computer modeling the internal architecture of carbonate platforms: Geology, v. 18, no. 1, p. 26-30
Bradley, J. S., 1975, Abnormal formation pressure: American Association of Petroleum Geologists, Bulletin, v. 59, no. 6, p. 957-973
Breed, C. S., Fryberger, S. G., Andrews, S., McCauley, C., Leunartz, F., Gelsel, D., and Horstman, K., 1979, Regional studies of sand seas using Landsat (ERTS) imagery; in, A Study of Global Sand Seas, McKee, E. D., ed.: US Geological Survey, Professional Paper 1052, p. 305-397 [available online]
Bridge, J. S., and Leeder, M. R., 1979, A simulation model of alluvial stratigraphy: Sedimentology, v. 26, p. 617-644
Brown, M. A., Archer, A. W., and Kvale, E. P., 1990, Neap-spring tidal cyclicity in laminated carbonate channel-fill deposits and its implications--Salem Limestone (Mississippian), south-central Indiana, USA: Journal of Sedimentary Petrology, v. 60, no. l,p.152-159
Buddemeier, R. W., and Kinzie, R. A., III, 1976, Coral growth: Oceanography and Marine Biology, Annual Review, v. 4, p. 183-225
Bull, W. B., 1972, Recognition of alluvial-fan deposits in the stratigraphic record; in, Recognition of Ancient Sedimentary Environments, Rigby, J. K., and Hamblin, W. K., eds.: Society of Economic Paleontologists and Mineralogists, Special Publication 16, p. 63-83
Burton, R., Kendall, C. G. St. C., and Lerche, I., 1987, Out of our depth--on the impossibility of fathoming eustasy from the stratigraphic record: Earth Science Reviews, v. 24, p. 237-277
Carstens, H., and Dypvik, H., 1981, Abnormal formation pressure and shale porosity: American Association of Petroleum Geologists, Bulletin, v. 65, p. 344-350
Christie-Blick, N., Mountain, G. S., and Miller, K. G., 1988, Sea level history: Science, v. 241, p. 596
Cita, M. B., Ryan, W. B. F., and Kidd, R. B., 1978, Sedimentation rates in Neogene deep-sea sediments from the Mediterranean and geodynamic implications of their changes; in, Initial Reports of the Deep Sea Drilling Project, Hsü, K. J., Montadert, L., et al.: US Government Printing Office, Washington, DC, v. 42, pt. 1, p. 991-1,002
Cook, H. E., and Taylor, M. E., 1977, Comparison of continental slope and shelf environments in the Upper Cambrian and lowest Ordovician of Nevada; in, Deep-Water Carbonate Environments, Cook, H. E., and Enos, Paul, eds.: Society of Economic Paleontologists and Mineralogists, Special Publication 25, p. 51-81
Corbel, J., 1959a, Erosion en terrain calcaire--vitesse d'erosion et morphologie: Annales de Geographie, v. 68, p. 97-120
Corbel, J., 1959b, Vitesse de l'erosion: Zeitschrift fiir Geomorphologie, n.F., v. 3, p. 1-28
Damuth, J. E., 1977, Late Quaternary sedimentation in the western equatorial Atlantic: Geological Society of America, Bulletin, v. 88,p.695-710
Davies, G. R., 1977, Turbidites, debris sheets, and truncation surfaces in upper Paleozoic deep-water carbonates of the Sverdrup basin, Arctic Archipelogo; in, Deep-Water Carbonate Environments, Cook, H. E., and Enos, Paul, eds.: Society of Economic Paleontologists and Mineralogists, Special Publication 25, p. 221-247
Davies, P. J., 1988, Evolution of the Great Barrier Reef--reductionist dream or expansionist vision: Sixth International Coral Reef Symposium, Proceedings, Townsville, Australia, v. 1, p. 9-17
Davies, P. J., and Marshall, J. F., 1979, Aspects of Holocene reef growth-substrate age and accretion rate: Search, v. 10, p. 276-279
Davies, T. A., and Worsley, T. R., 1981, Paleoenvironmental implications of oceanic carbonate sedimentation rates; in, The Deep Sea Drilling Project--A Decade of Progress, Wanne, J. E., Douglas, R. G., and Winterer, E. L., eds.: Society of Economic Paleontologists and Mineralogists, Special Publication 32, p. 169-179
Decima, A., and Wezel, F. C., 1973, Late Miocene evaporites of the central Sicilian basin, Italy; in, Initial Reports of the Deep Sea Drilling Project, Ryan, W. B. F., Hsü, K. J., et al.: US Government Printing Office, Washington, DC, v. 13, pt. 2, p. 1,2341,239
Demicco, R. V., and Spencer, R. J., 1989, MAPS--A Basic program to model accumulation of platform sediments: Computers and Geosciences, v. 15, p. 95-105
Denton, G. H., and Hughes, T. J., 1983, Milankovitch theory of ice ages--hypothesis of ice-sheet linkage between regional insolation and global climate: Quaternary Research, v. 20, p. 125-144
Dodge, R. E., and Vaisnys, J. R., 1980, Skeletal growth chronologies of recent and fossil corals; in, Skeletal Growth of Aquatic Organisms, Rhoads, D. C., and Lutz, R. A., eds.: Plenum Press, New York, p. 493-517
Dominquez, J. M. L., Martin, L., and Bittencourt, A. C. S. P., 1987, Sea level history and the Quaternary evolution of river mouth-associated beach-ridge plains along the east/southeast coast of Brazil--a summary; in, Sea-Level Fluctuation and Coastal Evolution, Nummedal, D., Pilkey, O. H., and Howard, J. D., eds.: Society of Economic Paleontologists and Mineralogists, Special Publication 4 1, p. 115-128
Donaldson, A. C., Martin, R. H., and Kanes, W. H., 1970, Holocene Guadalupe delta of Texas Gulf Coast; in, Deltaic Sedimentation, Modern and Ancient, Morgan, J. P., ed.: Society of Economic Paleontologists and Mineralogists, Special Publication 15, p. 107-137
Droxler, A. W., and Schlager, W., 1985, Glacial versus interglacial sedimentation rates and turbidite frequency in the Bahamas: Geology, v. 13, p. 799-802
Dunham, R. J., 1972, Guide for the study and discussion for individual reinterpretation of the sedimentation and diagenesis of the Permian Capitan geologic reef and associated rocks, New Mexico and Texas: Permian Basin Section, Society of Economic Paleontologists and Mineralogists, Publication 72-14, 235 p.
Dunnington, H. V., 1967, Aspects of diagenesis and shape change in stylolitic limestone reservoirs: Proceedings, 7th World Petroleum Congress, Mexico, v. 2, p. 339-352
Dustan, P., 1979, Distribution of zooxanthellae and photosynthetic chloroplast pigments of the reef-building coral Montastrea annularis Ellis and Solander in relation to depth on the West Indian coral reef: Bulletin of Marine Science, v. 29, no. 1, p. 7995
Eberli, G. P., and Ginsburg, R. N., 1989, Cenozoic progradation of northwestern Great Bahama Bank, a record of lateral platform growth and sea-level fluctuations; in, Controls on Carbonate Platform and Basin Development, Crevello, P. D., Wilson, J. L., Sarg, J. F., and Read, J. F., eds.: Society of Economic Paleontologists and Mineralogists, Special Publication 44, p. 339-351
Elliott, T., 1978, Deltas; in, Sedimentary Environments and Facies, Reading, H. G., ed.: Elsevier, New York, p. 97-142
Enos, Paul, 1974, Surface sediment facies of the Florida-Bahamas plateau: Geological Society of America, Map Series 5, 4 p.
Enos, Paul, 1977, Holocene sediment accumulations of the south Florida shelf margin; in, Quaternary Sedimentation in South Florida, Enos, Paul, and Perkins, R. D.: Geological Society of America, Memoir 147, p. 1-130
Enos, Paul, 1989, Lag time--is it simply storm wave base? (abs.); in, Sedimentary Modeling--Computer Simulation of Depositional Sequences, Franseen, E. K., and Watney, W. L., eds.: Kansas Geological Survey, Subsurface Geology Series 12, p. 41-42
Enos, Paul, and Sawatsky, L. H., 1981, Pore networks in Holocene carbonate sediments: Journal of Sedimentary Petrology, v. 51, p. 961-985
Ericson, D. B., Ewing, M., Wollin, G., and Heezen, B. C., 1961, Atlantic deep-sea sediment cores: Geological Society of America, Bulletin, v. 72, p. 193-286
Evans, I., and Kendall, C. G. St. C., 1977, An interpretation of the depositional setting of some deep-water Jurassic carbonates of the central High Atlas Mountains, Morocco; in, Deep-Water Carbonate Environments, Cook, H. E., and Enos, Paul, eds.: Society of Economic Paleontologists and Mineralogists, Special Publication 25, p. 249-261
Faul, H., 1943, Growth-rate of a Devonian reef-coral (Pristatophyllum): American Journal of Science, v. 24 1, p. 579-582
Feth, J. H. F., 1964, Review and annotated bibliography of ancient lake deposits (Precambrian to Pleistocene) in the western states: US Geological Survey, Bulletin 1080, 119 p.
Fisher, W. L., 1969, Facies characterization of Gulf Coast basin delta systems, with some Holocene analogues: Gulf Coast Association of Geological Societies, Transactions, v. 19, p. 239-261
Folk, R. L., and McBride, E. F., 1976, The Caballos Novaculite revisited--pt. 1, origin of novaculite members: Journal of Sedimentary Petrology, v. 46, no. 3, p. 659-669
Gadow, S., and Reineck, H. E., 1969, Ablandiger Sandtransport bei Sturmfluten: Senckenbergiana Maritima, v. 1, p. 63-78
Galloway, W. E., and Hobday, D. K., 1983, Terrigenous clastic depositional systems: Springer-Verlag, New York, 423 p.
Garrels, R. M., and Mackenzie, F. T., 1971, Evolution of sedimentary rocks: Norton, New York, 397 p.
Garrison, R. E., and Fischer, A. G., 1969, Deep-water limestones and radiolarites of the alpine Jurassic; in, Depositional Environments in Carbonate Rocks, Friedman, G. M., ed.: Society of Economic Paleontologists and Mineralogists, Special Publication 14, p. 20-56
Gebelein, C. D., 1969, Distribution, morphology, and accretion rate of recent subtidal algal stromatolites, Bermuda: Journal of Sedimentary Petrology, v. 39, no. 1, p. 49-69
Gebelein, C. D., 1975, Holocene sedimentation and stratigraphy, southwest Andros Island, Bahamas: 9th International Sedimentology Congress, Nice, France, Theme 5, v. 1, p. 193-198
Geitzenauer, K. R., Roche, M. R., and McIntyre, A., 1976, Modern Pacific coccolith assemblages--derivation and application to Late Pleistocene paleotemperature analysis; in, Investigation of Late Quaternary Paleooceanography and Paleoclimatology, Cline, R. M., and Hays, J. D., eds.: Geological Society of America, Memoir 145, p. 423-448
Ghiold, J. and Enos, Paul, 1982, Carbonate production of the coral Diploria labyrinthiformis in south Florida patch reefs: Marine Geology, v. 45, p. 281-296
Ginsburg, R. N., 1971, Landward movement of carbonate mud--new model for regressive cycles in carbonates (abs.): American Association of Petroleum Geologists, Bulletin, v. 55, no. 2, p. 340
Ginsburg, R. N., and Shinn, E. A., 1964, Distribution of the reef-building community in Florida and the Bahamas (abs.): American Association of Petroleum Geologists, Bulletin, v. 48, p. 527
Gladfelter, E. H., Monahan, R. K., and Gladfelter, W. B., 1978, Growth rates of five reef-building corals in the northeastern Caribbean: Bulletin of Marine Science, v. 28, no. 4, p. 728-734
Glynn, P. W., 1976, Some physical and biological determinants of coral community structure in the eastern Pacific: Ecological Monographs, v. 46, p. 431-456
Glynn, P. W., and Macintyre, I. G., 1977, Growth rate and age of coral reefs on the Pacific coast of Panama: Third International Coral Reef Symposium, Proceedings, Miami, Florida, v. 2, p. 252-259
Goldberg, E. D., and Koide, M., 1963, Rates of sediment accumulation in the Indian Ocean: Earth Science and Meteorology, no. 5, p. 90-102
Goldhammer, R. K., Dunn, P. A., and Hardie, L. A., 1987, High-frequency glacio-eustatic sea level oscillations with Milankovitch characteristics recorded in Middle Triassic platform carbonates in northern Italy: American Journal of Science, v. 287, p. 853-892
Gradstein, F. M., Agterberg, F. P., Aubry, M.-P., Berggren, W. A., Flynn, J. J., Hewitt, R., Kent, D. V., Klitgord, K. D., Miller, K. G., Obradovitch, J., Ogg, J. G., Prothero, D. R., and Westerman, G. E. G., 1988, Sea level history: Science, v. 241, p. 599-601
Halley, R. B., and Schmoker, J. W., 1983, High-porosity carbonate rocks of south Florida--progressive loss of porosity with depth: American Association of Petroleum Geologists, Bulletin, v. 67, no.2,p.191-200
Halley, R. B., Shinn, E. A., Hudson, H. J., and Lidz, B., 1977, Recent and relict topography of Boo Bee patch reef, Belize: Third International Coral Reef Symposium, Proceedings, Miami, Florida, v. 2, p. 29-35
Hallock, P., and Schlager, W., 1986, Nutrient excess and the demise of coral reefs and carbonate platforms: Palaios, v. 1, no. 4, p. 389-398
Hancock, J. M., 1975, The petrology of the chalk: Proceedings of the Geological Society of London, v. 86, p. 499-535
Haq, B. V., Hardenbol, J., and Vail, P. R., 1987, Chronology of fluctuating sea levels since the Triassic: Science, v. 235, p. 1,156-1,166
Harbaugh, J. W., 1966, Mathematical simulation of marine sedimentation with IBM 7090/7094 computers: Kansas Geological Survey, Computer Contribution 1, 52 p.
Harbaugh, J. W., and Bonham-Carter, G., 1970, Computer simulation in geology: Wiley Interscience, New York, 575 p.
Hardie, L. A., and Ginsburg, R. N., 1977, Layering--the origin and environmental significance of lamination and thin bedding; in, Sedimentation on the Modern Carbonate Tidal Flats of Northwest Andros Island, Bahamas, Hardie, L. A., ed.: Johns Hopkins University, Studies in Geology 22, p. 50-123
Harris, M. T., 1989, Modeling carbonate-progradation geometry and sediment-accumulation rates-a comparison Of MARGIN results and field data; in, Sedimentary Modeling--Computer Simulation and Depositional Sequences, Franseen, E. K., and Watney, W. L., eds.: Kansas Geological Survey, Subsurface Geology Series 12, p. 11-13
Hays, J. D., 1965, Radiolaria and late Tertiary and Quaternary history of Antarctic seas: American Geophysical Union, Antarctic Research Series, v. 5, p. 124-184
Hedberg, H. D., 1936, Gravitational compaction of clays and shales: American Journal of Science, ser. 5, v. 3 1, p. 241-287
Helland-Hansen, W., Kendall, C. G. St. C., Lerche, I., and Nakayama, K., 1988, A simulation of continental basin margin sedimentation in response to crustal movements, eustatic sea level change, and sediment accumulation rates: Mathematical Geology, v. 20, p. 777-802
Highsmith, R. C., 1979, Coral growth rates and environmental control of density banding: Journal of Experimental Marine Biology and Ecology, v. 37, p. 105-125
Hopley, D., 1977, The age of the outer ribbon reef surface, Great Barrier Reef, Australia--implications for hydro-isostatic models: Third International Coral Reef Symposium, Proceedings, Miami, Florida, v. 2, p. 24-28
Houbolt, J. J. H. C., 1968, Recent sediments in the southern bight of the North Sea: Geologie en Mijnbouw, v. 47, p. 245-273
Hsü, K. J., 1978, Stratigraphy of the lacustrine sedimentation in the Black Sea; in, Initial Reports of the Deep Sea Drilling Project, Ross, D. A., Neprochnov, Y. P., et al.: US Government Printing Office, Washington, DC, v. 42, pt. 2, p. 509-524
Hsü, K. J., Montadert, L., et al., 1978, Initial Reports of the Deep Sea Drilling Project: US Government Printing Office, Washington, DC, v. 42, pt. 1, 1,249 p.
Huston, M., 1985, Variation in coral growth rates with depth at Discovery Bay, Jamaica: Coral Reefs, v. 4, p. 19-25
James, N. P., 1977, The deep and the past: Third International Coral Reef Symposium, Proceedings, Miami, Florida, v. 2, p. xxv-xxvii
Jansa, L. F., Enos, Paul, Tucholke, B. E., Gradstein, F. M., and Sheridan, R. E., 1979, Mesozoic-Cenozoic sedimentary formations of the North American Basin; western North Atlantic; in, Deep Drilling Results in the Atlantic Ocean--Continental Margins and Paleoenvironment, Talwani, M., Hay, W., and Ryan, W. B. F., eds.: American Geophysical Union, Maurice Ewing Series 3, p. 1-57
Jenkyns, H. C., 1978, Pelagic environments; in, Sedimentary Environments and Facies, Reading, H. G., ed.: Elsevier, New York, p. 314-371
Jervey, M. T., 1988, Quantitative geological modeling of siliciclastic rock sequences and their seismic expression; in, Sea-Level Changes--An Integrated Approach, Wilgus, C. K., Hastings, B. S., Kendall, C. G. St. C., Posamentier, H. W., Ross, C. A., and Van Wagoner, J. C., eds.: Society of Economic Paleontologists and Mineralogists, Special Publication 42, p. 47-69
Kanes, W. H., 1970, Facies and development of the Colorado River delta in Texas; in, Deltaic Sedimentation, Modern and Ancient, Morgan, J. P., ed.: Society of Economic Paleontologists and Mineralogists, Special Publication 15, p. 78-106
Kauffman, E. G., 1977, Cretaceous facies, faunas, and paleoenvironments across the Western Interior basin: Mountain Geologist, v. 14, p. 75-99
Koerschner, W. F., III, and Read, J. F., 1989, Field and modelling studies of Cambrian carbonate cycles, Virginia Appalachians: Journal of Sedimentary Petrology, v. 89, no. 5, p. 654-687
Kuijpers, A., de Lange, G. J., Duin, E. J. T., 1987, Areal sedimentation rate patterns of the southern Nares Abyssal Plain, western N Atlantic; in, Geology and Geochemistry of Abyssal Plains, Weaver, P. P. E., and Thomson, J., eds.: Geological Society of London, Special Publication 31, p. 13-22
Kukal, Z., 1971, Geology of recent sediments: Academic Press, London, 490 p.
Kumar, N., and Sanders, J. E., 1974, Inlet sequence, a vertical succession of sedimentary structures and textures created by lateral migration of tidal inlets: Sedimentology, v. 21, p. 491532
Landon, S. M., 1975, Environmental controls on growth rates in hermatypic corals from the lower Florida Keys: M.S. thesis, State University of New York, Binghamton, 86 p.
Laporte, L. F., 1969, Recognition of a transgressive carbonate sequence within an epeiric sea--Helderberg Group (Lower Devonian) of New York State; in, Depositional Environments in Carbonate Rocks, Friedman, G. M., ed.: Society of Economic Paleontologists and Mineralogists, Special Publication 14, p. 98-119
Laporte, L. F., 1971, Paleozoic carbonate facies of the central Appalachians: Journal of Sedimentary Petrology, v. 41, no. 3, p. 724740
Lawrence, D. T., Doyle, M., and Aigner, T., 1990, Stratigraphic simulation of sedimentary basins--concepts and calibration: American Association of Petroleum Geologists, Bulletin, v. 74, no. 3, p. 273-295
Lees, A., 1975, Possible influence of salinity and temperature on modern shelf carbonate sedimentation: Marine Geology, v. 19, p. 159-198
Leonard, J. E., Canneron, B., Pilkey, O. H., and Friedman, G. M., 1981, Evaluation of cold-water carbonates as a possible paleoclimatic indicator: Sedimentary Geology, v. 28, no. 1, p. I 28
Lerche, I. Dromgoole, F., Kendall, C. G. St. C., Walter, L. M., and Scaturo, D., 1987, Geometry of carbonate bodies-a quantitative investigation of factors influencing their evolution: Carbonates and Evaporites, v. 2, p. 14-42
Lighty, R. G., Macintyre, I. G., and Stukenrath, R., 1978, Submerged early Holocene barrier reef, southeast Florida shelf: Nature, v. 275, no. 5683, p. 59-60
Lisitzin, A. P., 1972, Sedimentation in the world ocean: Society of Economic Paleontologists and Mineralogists, Special Publication 17, 218 p.
Lopatin, G. V., 1952, River deposits in the USSR: Gos. izd-vo Geogr. Lit-ry, Moscow, 366 p. (in Russian)
Lowe, D. R., 1976, Nonglacial varves in lower member of Arkansas Novaculite (Devonian), Arkansas and Oklahoma: American Association of Petroleum Geologists, Bulletin, v. 60, p. 2,1032,116
Macintyre, I. G., and Glynn, P. W., 1976, Evolution of modern Caribbean fringing reef, Galeta Point, Panama: American Association of Petroleum Geologists, Bulletin, v. 60, p. 1,054-1,072
Macintyre, I. G., Burke, R. B., and Stuckenrath, R., 1977, Thickest recorded Holocene reef section, Isla Perez core, Alacran Reef, Mexico: Geology, v. 5, no. 12, p. 749-754
Marshall, J. F., and Jacobson, G., 1985, Holocene growth of a mid-Pacific atoll--Tarawa, Kiribati: Coral Reefs, v. 4, p. 11-17
Matthews, R. K., 1984, Oxygen isotopic record of ice-volume history--100 million years of glacio-eustatic sea-level fluctuation; in, Interregional Unconformities and Hydrocarbon Accumulation, Schlee, J. S., ed.: American Association of Petroleum Geologists, Memoir 36, p. 97-107
Matthews, R. K., 1988, Sea level history: Science, v. 241, p. 597-599
Matthews, W. H., 1975, Cenozoic erosion and erosion surfaces in eastern North America: American Journal of Science, v. 275, p. 818-824
McKenzie, D., 1978, Some remarks on the development of sedimentary basins: Earth and Planetary Science Letters, v. 40, p. 25-32
McNeice, B. T., 1987, Clay-rich zones in Upper Pennsylvanian (Missourian-Virgilian) shelf limestones, eastern Kansas: M.S. thesis, University of Kansas, Lawrence, 84 p.
Menard, H. W., 1961, Some rates of regional erosion: Journal of Geology, v. 69, p. 154-161
Meybeck, M., 1976, Total mineral dissolved transport by world major rivers: Bulletin des Sciences Hydrologiques, v. 21, p. 265-284
Miall, A. D., 1986, Eustatic sea level changes interpreted from seismic stratigraphy--a critique of the methodology with particular reference to the North Sea Jurassic record: American Association of Petroleum Geologists, Bulletin, v. 70, no. 2, p. 131-137
Milankovich, M., 1941, Kanon der Erdbestrahlung und seine Anwendung auf das Eiszeitproblem: Academie Royale Serbe (Srpska Akademija Nauka i Umetnosti), Classe des Sciences Mathematiques et Naturelles, Edicion Special, v. 132, 633 p.
Milliman, J. D., 1975, Marine carbonates: Springer-Verlag, Berlin, 375 p.
Moore, D. G., Curray, J. R., Raitt, R. W., and Emmel, F. J., 1974, Stratigraphic-seismic section correlations and implications to Bengal Fan history; in, Initial Reports of the Deep Sea Drilling Project, von der Borch, C. C., Sclater, J. G., et al.: US Government Printing Office, Washington, DC, v. 22, p. 403-412
Mossop, G. D., 1972, Origin of the peripheral rim, Redwater reef, Alberta: Bulletin of Canadian Petroleum Geology, v. 20, p. 238280
Mount, J. F., 1984, Mixing of siliciclastic and carbonate sediments in shallow shelf environments: Geology, v. 12, p. 432-435
Mudford, B. S., and Best, M. E., 1989, Venture gas field, offshore Nova Scotia--case study of overpressuring in region of low sedimentation rate: American Association of Petroleum Geologists, Bulletin, v. 73, no. 11, p. 1,383-1,396
Müller, G., 1966, The new Rhine delta in Lake Constance; in, Deltas, Shirley, M. L., and Ragsdale, J. A., eds.: Houston Geological Society, Houston, Texas, p. 107-124
Müller, G., and Gees, R. A., 1970, Distribution and thickness of Quaternary deposits in the Lake Constance basin: Sedimentary Geology, v. 4, p. 81-87
Nelson, B. W., 1970, Hydrography, sediment dispersal, and recent historical development of the Po River delta, Italy; in, Deltaic Sedimentation, Modern and Ancient, Morgan, J. P., ed.: Society of Economic Paleontologists and Mineralogists, Special Publication 15, p. 152-184
Nelson, H. F., and Bray, E. E., 1970, Stratigraphy and history of the Holocene sediments in the Sabine-High Island area, Gulf of Mexico; in, Deltaic Sedimentation, Modern and Ancient, Morgan, J. P., ed.: Society of Economic Paleontologists and Mineralogists, Special Publication 15, p. 48-77
Neumann, A. C., and Land, L. S., 1975, Lime mud deposition and calcareous algae in the Bight of Abaco, Bahamas--a budget: Journal of Sedimentary Petrology, v. 45, no. 4, p. 763-786
Oomkens, E., 1970, Depositional sequences and sand distribution in the postglacial Rhone delta complex; in, Deltaic Sedimentation, Modern and Ancient, Morgan, J. P., ed.: Society of Economic Paleontologists and Mineralogists, Special Publication 15, p. 198-212
Opdyke, N. D., and Foster, J. H., 1971, The paleomagnetism of cores in the North Pacific: Geological Society of America, Memoir 126, 83 p.
Palmer, A. R., comp., 1983, The Decade of North American Geology, 1983 geologic time scale: Geology, v. 11, no. 9, p. 503-504
Picard, M. D., and High, L. R., Jr., 1972, Criteria for recognizing lacustrine rocks; in, Recognition of Ancient Sedimentary Environments, Rigby, J. K., and Hamblin, W. K., eds.: Society of Economic Paleontologists and Mineralogists, Special Publication 16, p. 108-145
Playford, P. E., Hurley, N. F., Kerans, C., and Middleton, M. F., 1989, Reefal platform development, Devonian of the Canning basin, Western Australia; in, Controls on Carbonate Platform and Basin Development, Crevello, P. D., Wilson, J. L., Sarg, J. F., and Read, J. F., eds.: Society of Economic Paleontologists and Mineralogists, Special Publication 44, p. 187-202
Plumley, W. J., 1980, Abnormally high fluid pressure--survey of some basic principles: American Association of Petroleum Geologists, Bulletin, v. 64, p. 414-422
Pray, L. C., 1960, Compaction in calcisiltites (abs.): Geological Society of America, Bulletin, v. 71, p. 1,946
Prell, W. L., and Hays, J. D., 1976, Late Pleistocene faunal and temperature patterns of the Colombia basin, Caribbean Sea; in, Investigation of Late Quaternary Paleoceanography and Paleoclimatology, Cline, R. M., and Hays, J. D., eds.: Geological Society of America, Memoir 145, p. 201-220
Prentice, M. L., and Matthews, R. K., 1988, Cenozoic ice-volume history--Aevelopment of a composite oxygen isotope record: Geology, v. 16, no. 11, p. 963-966
Purdy, E. G., 1974, Reef configurations--cause and effect; in, Reefs in Time and Space, Laporte, L. F., ed.: Society of Economic Paleontologists and Mineralogists, Special Publication 18, p. 976
Rainwater, E. H., 1966, The geological importance of deltas; in, Deltas, Shirley, M. L., and Ragsdale, J. A., eds.: Houston Geological Society, Houston, Texas, p. 1-15
Rao, C. P., 1981, Criteria for recognition of cold-water carbonate sedimentation--Berriedale Limestone (Lower Permian), Tasmania, Australia: Journal of Sedimentary Petrology, v. 5 1, no. 2, p. 491-506
Read, J. F., Grotzinger, J. P., Bone, J. A., and Koerschner, W. F., 1986, Models for generation of carbonate cycles: Geology, v. 14, p. 107-110
Read, W. A., and Forsyth, I. H., 1989, Allocycles and autocycles in the upper part of the Limestone Coal Group (Pendleian E1) in the Glasgow-Stirling region of the Midland Valley of Scotland: Geological Journal, v. 24, no. 2, p. 121-137
Reineck, H. E., and Singh, I. B., 1975, Depositional sedimentary systems: Springer-Verlag, Berlin, 439 p.
Reinhardt, J., 1977, Cambrian off-shelf sedimentation, central Appalachians; in, Deep-Water Carbonate Environments, Cook, H. E., and Enos, Paul, eds.: Society of Economic Paleontologists and Mineralogists, Special Publication 25, p. 83-112
Rieke, H. H., III, and Chilingarian, G. V., 1974, Compaction of argillaceous sediments: Advances in Sedimentology 16, Elsevier, Amsterdam, p. 424
Ritter, D. F., 1967, Rates of denudation: Journal of Geological Education, v. 15, p. 154-159
Roberts, H. H., Suhayda, J. N., and Coleman, J. M., 1980, Sediment deformation and transport on low-angle slopes: Mississippi delta; in, Thresholds in Geomorphology, Coates, D. R., and Vitek, J. D., eds.: Allen and Unwin, London, p. 131-167
Rupke, N. A., 1975, Deposition of fine-grained sediments in the abyssal environment of the Algero-Balearic basin, western Mediterranean Sea: Sedimentology, v. 22, p. 95-109
Saller, A. H., 1984, Diagenesis of Cenozoic limestones on Enewetak Atoll: Ph.D. dissertation, Louisiana State University, Baton Rouge, 363 p.
Samoilov, I. V., 1952, River mouths: Moscow, 524 p. (in Russian)
Sarg, J. F., 1988, Carbonate sequence stratigraphy; in, Sea-Level Changes--An Integrated Approach, Wilgus, C. K., Hastings, B. S., Kendall, C. G. St. C., Posamentier, H. W., Ross, C. A., and Van Wagoner, J. C., eds.: Society of Economic Paleontologists and Mineralogists, Special Publication 42, p. 155-181
Scaturo, D. M., Strobel, J. S., Kendall, G. G. St. C., Wendte, J. C., Biswas, G., Bezdek, J., and Cannon, R., 1989, Judy Creek-a case study for a two-dimensional sediment deposition simulation; in, Controls on Carbonate Platform and Basin Development, Crevello, P. D., Wilson, J. L., Sarg, J. F., and Read, J. F., eds.: Society of Economic Paleontologists and Mineralogists, Special Publication 44, p. 63-76
Schindel, D. E., 1980, Microstratigraphic sampling and the limits of paleontologic resolution: Paleobiology, v. 6, no. 4, p. 408-426
Schlager, W., 1974, Preservation of cephalopod skeletons and carbonate dissolution on ancient Tethyan sea floors; in, Pelagic Sediments-On Land and under the Sea, Hsü, K. J., and Jenkyns, H. C., eds.: International Association of Sedimentologists, Special Publication 1, p. 49-70
Schlager, W., 1981, The paradox of drowned reefs and carbonate platforms: Geological Society of America, Bulletin, v. 92, p. 197-211
Schlager, W., 1988, Drowning unconformities on carbonate platforms; in, Controls on Carbonate Platform and Basin Development, Crevello, P. D., Wilson, J. L. Sarg, J. F., and Read, J. F., eds.: Society of Economic Paleontologists and Mineralogists, Special Publication 44, p. 15-25
Schlager, W., and Camber, O., 1986, Submarine slope angles, drowning uncomformities, and self-erosion of limestone escarpments: Geology, v. 14, no. 9, p. 762-765
Schlager, W., and James, N. P., 1978, Low-magnesium calcite limestones forming at the sea floor, Tongue of the Ocean, Bahamas: Sedimentology, v. 25, p. 675-702
Schlanger, S. O., 1981, Shallow-water limestones in ocean basins as tectonic and paleoceanographic indicators; in, The Deep Sea Drilling Project--A Decade of Progress, Warme, J. E., Douglas, R. G., and Winterer, E. L., eds.: Society of Economic Paleontologists and Mineralogists, Special Publication 32, p. 209-226
Schlanger, S. O., and Douglas, R. G., 1974, Pelagic ooze-chalklimestone transition and its implications for marine stratigraphy; in, Pelagic Sediments--On Land and under the Sea, Hsü, K. J., and Jenkyns, H. C., eds.: International Association of Sedimentologists, Special Publication 1, p. 117-148
Schmidt, V., and McDonald, D. A., 1979, The role of secondary porosity in the course of sandstone diagenesis; in, Aspects of Diagenesis, Scholle, P. A., and Schluger, P. R., eds.: Society of Economic Paleontologists and Mineralogists, Special Publication 26, p. 175-207
Schmoker, J. W., and Halley, R. B., 1982, Carbonate porosity versus depth-a predictable relation for south Florida: American Association of Petroleum Geologists, Bulletin, v. 66, no. 12, p. 2,561-2,570
Scholle, P. A., Arthur, M. A., and Ekdale, A. A., 1983, Pelagic environment; in, Carbonate Depositional Environments, Scholle, P. A., Bebout, D. G., and Moore, C. H., eds.: American Association of Petroleum Geologists, Memoir 33, p. 619-691
Schumm, S. A., 1963, The disparity between present rates of denudation and orogeny: US Geological Survey, Professional Paper 454-H, 13 p. [available online]
Sclater, J. G., Royden, L., Horvath, F., Burchfiel, B. C., Semken, S., and Stegena, L., 1980, The formation of the intra-Carpathian basins as determined from subsidence data: Earth and Planetary Science Letters, v. 51, p. 139-162
Shi, Y., and Wang, C. Y., 1986, Pore pressure generation in sedimentary basins--overloading versus aquathennal: Journal of Geophysical Research, v. 91, no. B2, p. 2,153-2,162
Shinn, E. A., 1966, Coral growth-rate, an environmental indicator: Journal of Paleontology, v. 40, no. 2, p. 233-240
Shinn, E. A., 1980, Geologic history of Grecian Rocks, Key Largo Coral Reef Marine Sanctuary: Bulletin of Marine Science, v. 30, no. 3, p. 646-656
Shinn, E. A., and Robbin, D. M., 1983, Mechanical and chemical compaction in fine-grained shallow-water limestones: Journal of Sedimentary Petrology, v. 53, no. 2, p. 595-618
Shinn, E. A., Halley, R. B., Hudson, J. H., and Lidz, B. H., 1977, Limestone compaction--an enigma: Geology, v. 5, no. 1, p. 2 I24
Shinn, E. A., Hudson, J. H., Halley, R. B., and Lidz, B. H., 1977, Topographic control and accumulation rate of some Holocene coral reefs--South Florida and Dry Tortugas: Third Intemational Coral Reef Symposium, Proceedings, Miami, Florida, v. 2, p. 1-7
Shinn, E. A., Steinen, R. P., Lidz, B. H., and Swart, P. K., 1989, Whitings, a sedimentologic dilemma: Journal of Sedimentary Petrology, v. 59, no. 1, p. 147-161
Shinn, E. A., Lidz, B. H., Kindinger, J. L., Hudson, J. H., and Halley, R. B., 1989, Reefs of Florida and the Dry Tortugas: International Geological Congress, Washington, DC, Field Guide T-1 76, 53 p.
Shinn, E. A., Hudson, J. H., Halley, R. B., Lidz, B. H., Robbin, D. M., and Macintyre, I. G., 1982, Geology and sediment accumulation rates at Carrie Bow Cay, Belize; in, The Atlantic Barrier Reef Ecosystem at Carrie Bow Cay, Belize--1, Structure and Communities, Rützler, K., and Macintyre, I. G., eds.: Smithsonian Contributions to the Marine Sciences, no. 12, p. 63-75
Smith, S. V., Kimmerer, W. J., Laws, E. A., Brock, R. E., and Walsh, T. W., 1981, Kaneoho Bay sewage diversion experiment--perspectives on ecosystem responses to nutritional perturbation: Pacific Science, v. 35, p. 279-395
Spackman, W., Scholl, D. W., and Taft, W. H., 1964, Environments of coal formation in south Florida: Geological Society of America, Field Trip Guidebook, 67 p.
Spencer, R. J., and Demicco, R. V., 1989, Computer models of carbonate platform cycles driven by subsidence and eustasy: Geology, v. 17, p. 165-168
Steam, C. W., Scoffin, T. P., and Martindale, W., 1977, Calcium carbonate budget of a fringing reef on the west coast of Barbados--pt. 1, zonation and productivity: Bulletin of Marine Science, v. 27, no. 3, p. 479-5 10
Steckler, M. S., and Watts, A. B., 1978, Subsidence of the Atlantic-type margin off New York: Earth and Planetary Science Letters, v.4l,p.1-13
Stockman, K. W., Ginsburg, R. N., and Shinn, E. A., 1967, The production of lime mud by algae in south Florida: Journal of Sedimentary Petrology, v. 37, no. 2, p. 633-648
Suggate, R. P., 1968, Post-glacial rise in the Christchurch metropolitan area, New Zealand: Geologie en Mijnbouw, v. 47, no. 4, p. 291-297
Sweeting, M. M., 1964, Some factors in the absolute denudation of limestone terrain: Erdkunde, v. 18, p. 92-95
Swift, D. J. P., McKinney, T. F., and Stahl, L., 1984, Recognition of transgressive and post-transgressive sand ridges on the New Jersey continental shelf--discussion; in, Siliciclastic Shelf Sediments, Tillman, R. W., and Seimers, C. T., eds.: Society of Economic Paleontologists and Mineralogists, Special Publication 34, p. 25-36
Swift, S. A., 1977, Holocene rates of sediment accumulation in the Panama basin, eastern equatorial Pacific--pelagic sedimentation and lateral transport: Journal of Geology, v. 85, p. 301-319
Takahashi, T., Koba, M., and Kan, H., 1988, Relationship between reef growth and sea level of the northwest coast of Kume Island, the Ryukyus--data from drill holes on the Holocene coral reef: Sixth International Coral Reef Symposium, Proceedings, Townsville, Australia, v. 3, p. 491-496
Teichert, C., 1958, Cold- and deep-water coral banks: American Association of Petroleum Geologists, Bulletin, v. 42, p. 2,718-2,744
Trudgill, S., 1985, Limestone geomorphology: Longman, New York, 196 p.
Tucker, M. E., 1974, Sedimentology of Palaeozoic pelagic limestones--the Devonian Griotte (southern France) and Cephalopodenkalk (Germany); in, Pelagic Sediments--On Land and under the Sea, Hsü, K. J., and Jenkyns, H. C., eds.: Intemational Association of Sedimentologists, Special Publication 1, p. 71-92
Tunnicliffe, V., 1983, Caribbean staghorn coral populations--pre-Hurricane Allen conditions in Discovery Bay, Jamaica: Bulletin of Marine Science, v. 33, no. 1, p. 132-151
Turcotte, D. L., and Schubert, G., 1982, Geodynamics: John Wiley, New York, 450 p.
Vail, P. R., Mitchum, R. M., Jr., Todd, R. G., Widmier, J. M., Thompson, S., III, Sangree, J. B., Bubb, J. N., and Hatlelid, W. G., 1977, Seismic stratigraphy and global changes in sea level; in, Seismic Stratigraphy--Applications to Exploration, Payton, C. E., ed.: American Association of Petroleum Geologists, Memoir 26, p. 49-212
van Andel, T. H., Heath, G. R., and Moore, T. C., 1975, Cenozoic history and paleo-oceanography of the central equatorial Pacific Ocean: Geological Society of America, Memoir 143, 134 p.
Van Houten, F. B., 1964, Cyclic lacustrine sedimentation, Upper Triassic Lockatong Formation, central New Jersey and adjacent Pennsylvania; in, Symposium on Cyclic Sedimentation, Merriam, D. F., ed.: Kansas Geological Survey, Bulletin 169, p. 497-531 [available online]
Walker, K. R., Shanmugan, G., and Ruppel, S. C., 1983, A model for carbonate to terrigenous clastic sequences: Geological Society of America, Bulletin, v. 94, p. 700-712
Wanless, H. R., 1979, Limestones responses to stress: solution and dolomitization: Journal of Sedimentary Petrology, v. 49, no. 2, p. 437-462
Wanless, H. R., and Tagett, M. G., 1989, Origin, growth, and evolution of carbonate mud banks in Florida Bay: Bulletin of Marine Science, v. 44, no. 11, p. 454-489
Warzeski, E. R., 1976, Growth history and sedimentary dynamics of Caesars Creek bank: M.S. thesis, University of Miami, Coral Gables, Florida, 195 p.
Watney, W. L., French, J. A., and Wong J.-C., 1989, Computer simulation of coastal-marine sedimentary sequences influenced by glacial-eustatic sea-level fluctuations; in, Sequence Stratigraphic Interpretations and Modeling of Cyclothems in the Upper Pennsylvanian (Missourian) Lansing and Kansas City Groups in Eastern Kansas, Watney, W. L., French, J. A., and Franseen, E. K., eds.: Kansas Geological Society, 41st Annual Field Trip, p. 75-85
Watts, A. B., Kamer, G. D., and Steckler, M. S., 1982, Lithosphere flexure and the evolution of sedimentary basins: Philosophical Transactions of the Royal Society of London, ser. A., v. 305, p. 249-281
Weber, J. N., and White, E. W., 1977, Caribbean reef corals Montastrea annularis and Montastrea cavernosa--long-term growth data as determined by skeletal X-radiography; in, Reefs and Related Carbonates--Ecology and Sedimentology, Frost, S. H., Weiss, M. P., and Saunders, J. B., eds.: American Association of Petroleum Geologists, Studies in Geology 4, p. 171-179
Weiss, M. P., and Goddard, D. A., 1977, Man's impact on coastal reefs-an example from Venezuela; in, Reefs and Related Carbonates--Ecology and Sedimentology, Frost, S. H., Weiss, M. P., and Saunders, J. B., eds.: American Association of Petroleum Geologists, Studies in Geology 4, p. 111-124
Weiss, M. P., and Multer, H. G., 1988, Map of modern reefs and sediments of Antigua, West Indies: Department of Geology, Northern Illinois University, DeKalb, scale 1:40,000.
Weller, J. M., 1959, Compaction of sediments: American Association of Petroleum Geologists, Bulletin, v. 43, p. 273-3 10
Wilson, J. L., 1975, Carbonate facies in geologic history: Springer-Verlag, Berlin, 471 p.
Kansas Geological Survey
Comments to webadmin@kgs.ku.edu
Web version March 12, 2010. Original publication date 1991.
URL=http://www.kgs.ku.edu/Publications/Bulletins/233/Enos/index.html