| Original published in D. W. Steeples, ed., 1989, Geophysics in Kansas: Kansas Geological Survey, Bulletin 226, pp. 9-29 | ||
Kansas Geological Survey
The article is also available as an Acrobat PDF file.
Kansas has been a part of a stable craton since at least the beginning of the Paleozoic some 550 m. y. ago. The majority of the sedimentary rocks deposited during the last 550 m. y. are products of numerous inundations by shallow seas. Interspersed with these transgressions were periods of erosion, many coinciding with widespread uplift. The distribution of reservoir-quality rocks has been controlled by the varying structural and depositional settings in both time and space. The identification of these reservoirs begins with a knowledge of the geologic history as detailed by the vast subsurface information base, mainly wire line logs and completion records, that is available for Kansas. Seismic profiling has been and will continue to be used effectively to resolve structural traps. The trend in exploration in the midcontinent has been to strengthen the search for reservoirs associated with more subtle structures and difficult-to-find stratigraphic traps. Stratigraphic traps will become increasingly important, particularly within established production trends. The many unconformities in the midcontinent stratigraphic column afford numerous types of trapping geometry such as truncation beneath an unconformity, traps associated with buried valleys, discontinuous onlap onto erosion surfaces, and porosity pinchouts due to changes in original depositional conditions and diagenetic alteration. The most widespread petroleum accumulations in Kansas occur in structural and stratigraphic traps associated with the pre-Pennsylvanian unconformity. Production associated with the unconformity includes numerous lower Paleozoic pay zones which subcrop directly beneath the unconformity in the Sedgwick, Salina, and Anadarko basins; the Arbuckle production on the Central Kansas uplift; and numerous fields which payout from either conglomerates or weathered zones along the unconformity. Considerable production also occurs farther up-section with the Cherokee and Lansing-Kansas City groups, and down-section in the Viola Formation and Simpson Group. In order to demonstrate the potential use of the seismic method in defining subtle traps, synthetic seismograms were produced for selected strata in central Kansas. Critical attributes of reservoir rock and associated strata conducive to seismic stratigraphic processing include the thickness of a potential reservoir bed and its velocity and density contrast with adjacent strata. Thicker strata such as the Morrow and most lower Paleozoic formations may be more easily defined by seismic-stratigraphic methods. In contrast, the stratigraphy of the Pennsylvanian and Permian cyclothems may not be amenable to definition by seismic methods because these units contain heterogenous reservoirs interbedded with other thin strata of similar composition.
Since the first symposium on geophysics in Kansas in 1959 (Hambleton, 1959), great technological strides have been made in reflection seismology. As experimentation and improvements continue, the seismic-reflection technique will be even more effective as an oil- and gas-finding tool. A major area of experimentation at the Kansas Geological Survey is in the production, propagation, and recording of high-frequency seismic energy. Use of high-frequency seismic sources increases the subsurface detail that can be seen in seismic sections and thereby may be of use in opening up new exploration plays or at least increasing efficiency in the search for reserves in established producing trends. It is still speculative how exploration for new and established plays may benefit by using high-resolution seismic techniques. However, some general conclusions can be made on its potential and which parts of the Kansas stratigraphic column may reveal the greatest detail by its use.
To facilitate the discussion on high-resolution seismic applications in Kansas, this paper is divided into interrelated sections. First, an overview is given on the major characteristics of Kansas geology and its existing petroleum distribution. The second section then compares conventional and high-resolution seismic data, and by example, illustrates how high-resolution seismic data may be used to define difficult-to-find stratigraphic traps in Kansas.
The Kansas portion of the central stable region of the continent is characterized by broad basins and domes covering thousands of square kilometers. The dips of strata within this province are typically small. Prominent uplift and subsidence occurred episodically throughout the Phanerozoic (approximately 550 m.y.), separated by periods of gradual deformation. These periods of active tectonic movement were usually times of low sea level and subsequent erosion. The record of sedimentation in Kansas is thus episodic, interrupted by significant unconformities.
The two prominent structural upwarps that affect the Paleozoic rock column in Kansas are the northeast-southwest-trending Nemaha uplift (NU); and northwest-southeast-trending Cambridge arch (CA) and Central Kansas uplift (CKU), and the southerly projection of the CKU, the Pratt anticline (PA) (fig. 1). These structures represent significant Early Pennsylvanian (pre-Desmoinesian) deformation probably associated with similarly aged plate convergence along on orogenic belt now defined as the Ouachita Mountains of Arkansas. The crests of these uplifts in Kansas are sites of extensive erosion and truncation of the prePennsylvanian strata. Locally, Upper Pennsylvanian strata lie directly on Precambrian-age granite and quartzite. Earlier episodes of uplift along portions of these same structures are recognized by thinning or local truncation of lower Paleozoic strata.
Figure 1--Major structural features of Kansas. The stipple pattern represents absence of Mississippian rocks. Smaller subsidiary structures are shown by anticlinal and synclinal trend lines. Figure is from Merriam (1963).
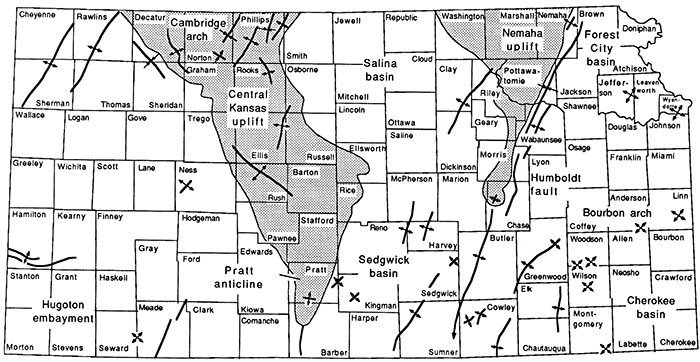
The NU is fault-bounded on the east with a gently dipping western flank. Maximum displacement along this east-bounding fault (the Humboldt fault) is approximately 3,000 ft (900 m). The width of the NU, as defined by the truncated margin of the Mississippian strata around it, varies from 40 mi (64 km) on the north to only a few miles in the south. The top of the Precambrian comes to within 600 ft (180 m) of the surface along the northern reaches of the NU in Kansas. Across the state line in southeast Nebraska, the Precambrian surface is as shallow as 429 ft (130 m) (R. R. Burchett, personal communication, 1984). In southern Kansas, the Precambrian lies below 3,900 ft (1,200 m) along the crest of the N U. The uplift appears to have moved as a series of blocks. Rhombic fault-bounded horsts and grabens form its infrastructure (Berendsen and Blair, 1986). Locally the trend of the NU also is offset where it intersects with prominent basement cross-faults and structural lineaments.
The Cambridge arch and CKU, separated from each other by only a narrow sag, also are defined by the truncated edge of the Mississippian strata (Morgan, 1932). These features are broader than the NU and contain many secondary anticlines, some of which are faulted. These secondary structures generally conform to the trend of the major structures but with some important exceptions.
The Humboldt fault forms the western limit of the Forest City basin, an asymmetric depression filled with as much as 4,000 ft (1,200 m) of Paleozoic strata adjacent to the NU in Brown County, Kansas. The Cherokee basin is also bordered on its west side by the NU and is separated from the Forest City basin to the north by the low-relief Bourbon arch. Paleozoic sedimentary rocks thicken westward to a maximum of 3,600 ft (1,100 m) in the extreme southwestern portion of the basin. The Salina basin is a broad, asymmetrical, late Paleozoic-age basin in north-central Kansas. Paleozoic strata in this basin dip gently westward off the NU and eastward off the Cambridge arch and CKU. The axis of the Salina basin trends northwest-southeast close to the Cambridge arch-CKU in the western part of the basin. Approximately 4,600 ft (1,400 m) of Mesozoic and Paleozoic strata are presently preserved in the Salina basin in Smith, Jewell, and Osborne counties.
The Sedgwick basin lies south of the Salina basin and is separated from it by a small unnamed structural arch. Paleozoic strata dip and thicken south and southwestward across the basin toward the Anadarko basin in Oklahoma. Up to 5,600 ft (1,700 m) of Paleozoic strata are present at the Oklahoma-Kansas state line. The Sedgwick basin, much like the Hugoton embayment to the west, is a zone of transition between the stable craton to the north and the less stable Anadarko basin lying immediately to the south.
The Hugoton embayment covers much of western Kansas. It is separated from the Sedgwick basin by the CKU and the Pratt anticline and is bordered on the west in Colorado by the Las Animas arch. The basin plunges southward into the Anadarko basin where as much as 9,500 ft (2,900 m) of Paleozoic and Mesozoic strata are present at the southern border of Kansas.
A majority of these major basins, arches, and lesser structures are a consequence of the major deformation that occurred during the Early Pennsylvanian (pre-Desmoinesian). Earlier uplifts and basins which significantly affected the distribution of lower Paleozoic strata lie buried in the subsurface. For example, the Salina and Forest City basins were combined as part of a much more extensive basin (the North Kansas basin) during the Ordovician through Late Mississippian when sedimentary rocks such as the Simpson, Viola, Maquoketa, and Hunton thickened northward toward a depocenter in Nebraska and Iowa. The basin was bordered on the south by the broad Chautauqua arch, now the site of the Cherokee basin, and to the west by the ancestral CKU (Merriam, 1963). The distribution of pre-Mississippian reservoir rocks and potential sources of petroleum are significantly affected by these earlier configurations.
The majority of sedimentary rocks in Kansas are of Paleozoic age. This abundance is a function of the history of subsidence and uplift of the area. While the Permian and Pennsylvanian represent only 23% of Paleozoic time, the rocks deposited during this interval represent 45-75% of those rocks now preserved in Kansas. A significant amount of subsidence is inferred during the late Paleozoic, following the post-Mississippian/pre-Desmoinesian tectonic activity. Watney (1985a, b) attributes the high rate of subsidence to the climactic downwarping of the Anadarko basin. This deformation in turn may have been significantly affected by overthrusting in the Wichita Mountains as a response to nearby plate convergence along the Ouachita orogenic belt (Brewer et al., 1983). Subsequent tectonic events in Kansas have been only minor epeirogenic uplift and subsidence.
In general, the sedimentary rock record is broken by numerous episodes of nondeposition or erosion which have significantly affected the distribution of strata. Merriam (1963) estimates that only between 15 and 50% of geologic time bracketed by the rock column in Kansas is actually represented by preserved rock. The distribution of the strata below the pre-Pennsylvanian unconformity is particularly affected by the several periods of uplift and subsidence.
For geophysical purposes the Phanerozoic rock column can be first separated into two major divisions: those rocks below the pre-Pennsylvanian unconformity and those above. The strata below the pre-Pennsylvanian unconformity can be further subdivided based on three major, longterm transgressions of the sea onto the craton. The sedimentary sequence resulting from the oldest Paleozoic transgressions was named by Sloss (1963) as the Sauk sequence. This inundation of the sea initially brought the accumulation of the relatively thin Reagan Sandstone followed by the dolomites of the thicker Arbuckle Group. Sea level then fell and exposed these rocks to weathering. Local uplifts such as the southeast Nebraska arch over the northern reaches of the present-day NU removed any sediment that might have been previously deposited over this feature. The next transgression resulted in the deposition of the Tippecanoe sequence on a shelf somewhat modified in configuration from that during the previous transgression. Initially, the sandstones and shales of the Simpson Group were deposited, followed by the Viola Limestone, Maquoketa dolomite and shale, and the Silurian-age Hunton dolomites. The prominent North Kansas basin was actively subsiding during this period.
Following the Tippecanoe transgression, the sea retreated and another period of erosion occurred. The third major transgression of the sea during the Paleozoic resulted in accumulation of the Kaskaskia sequence consisting of the Devonian Hunton dolomite, Chattanooga Shale, and the Mississippian limestones. This deposition, interrupted by several minor fluctuations in sea level, was followed by an episode of extensive uplift and erosion during a low stand in sea level.
The Permian and Pennsylvanian strata above the pre-Pennsylvanian unconformity were deposited as a consequence of another inundation by the sea. These strata, in contrast to those in the earlier Paleozoic, consist of alternating, thin-bedded successions of shale, sandstone, and limestone typifying cyclothemic deposition. The Early and Middle Pennsylvanian-age Morrowan and Cherokee groups are predominantly composed of shales and sandstones with increasing limestone abundance toward western Kansas. The Morrowan sedimentary rocks were the first sediments to cover the pre-Pennsylvanian unconformity as sea level rose. They are restricted to southwestern Kansas in proximity to the rapidly subsiding Anadarko basin. The succeeding Pennsylvanian sediments progressively onlapped the Central Kansas and Nemaha uplifts until these structures were covered during the Late Pennsylvanian. The uppermost Middle and Upper Pennsylvanian and the earliest Lower Permian sedimentary rocks are limestone-shale successions. Evaporite deposition became significant in the later Permian as the sea withdrew. The overlying Cretaceous shales, sandstones, and chalks are the youngest units in Kansas with any significant petroleum potential. The Cretaceous is separated from the Permian by a significant, regional unconformity. In western Kansas thin, areally restricted, unconformity-bounded Triassic and Jurassic units are situated between the Permian and Cretaceous strata.
In general, the strata below the pre-Pennsylvanian unconformity are more thickly bedded and richer in carbonate rocks than the overlying Permian and Pennsylvanian units. As previously discussed, the pre-Pennsylvanian strata are also more deformed. The major long-term rise in sea level that accounts for the Sloss sequence is attributed to a decrease in the volume of the ocean basin due to an increase in the seafloor-spreading rate and associated swelling of the midocean ridges (Hallam, 1963). The thick marine limestones and dolomites are indicative of sustained highstand in sea level over a gently subsiding shelf. Sedimentation was again episodically interrupted by sea-level withdrawal. Subsequent alteration of carbonate strata due to weathering and erosion enhanced porosity development in these units.
The thinly bedded (less than 15 m) but widespread (over lO's and l00's of km) cyclothemic successions of the Permian and Pennsylvanian have been attributed to third-order rise and fall of sea level due to the periodic melting and building of massive continental glaciers on the supercontinent Gondwana (Crowell, 1978). Eighty-five marine cycles are recognized (Merriam, 1963). Sustained subsidence of the shelf during the fluctuating sea levelled to preservation of a thick aggregate stratigraphic section. Subsidence was greater closer to the Anadarko basin and less over the areas of existing uplifts. Regional truncation or attenuation due to minor erosion during the glacially induced sea-level lowstands is insignificant in these Permian and Pennsylvanian strata. Moreover, subtle variation in depositional environments and resultant lithofacies, and early diagenesis of the carbonate rocks are very important factors affecting the distribution of petroleum reservoirs (Watney, 1984).
Kansas is a mature producing province where over 150,000 wells have been drilled in the search for oil and gas. Over 16 billion barrels are estimated to have been originally in place with over five billion of that produced. Annual oil production peaked in 1956 at 125 million barrels and declined steadily until 1975, when an increase in production began. Since 1979, production increased over 25% to 71.6 million barrels in 1983. In 1982, 9,199 wells were drilled, an all-time record in Kansas. Sixty-six percent of these were development wells. The number of wells completed in 1983 was still very high (7,406 wells), but the percentage of development wells increased to 76%. Successful exploratory wells comprised 23% in 1983, while 70% of the development wells drilled were producible.
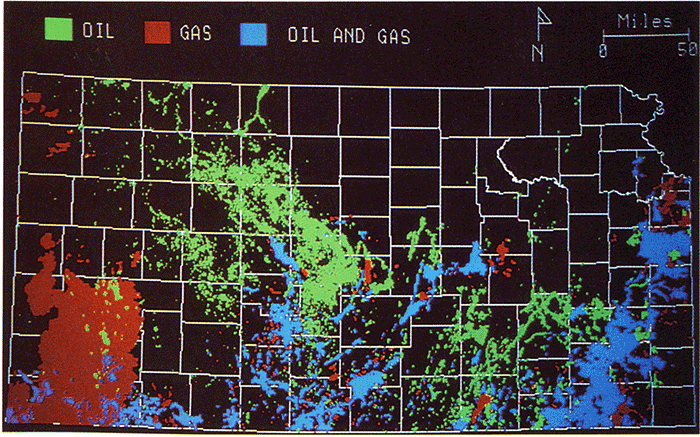
All basins and uplifts produce oil except for the central portion of the Salina basin (fig. 2). Nearly a third of all wells in 1983 in Kansas were drilled on the Central Kansas uplift, one of the most active and heavily drilled provinces in the United States. The Cherokee basin and southern Forest City basins account for another third of the wells drilled in 1983. Significant new discoveries have been realized in all basins and uplifts due to the surge in drilling in the early 1980's. Favorable results with modest drilling costs have sustained the elevated level of activity in spite of the recent decline in the price of oil.
Figure 2--Oil and gas wells in Kansas as of 1982.
All of the major stratigraphic units below the pre-Pennsylvanian unconformity produce oil or gas, these being the Arbuckle, Simpson, Maquoketa, Viola, Hunton, Misener at the base of the Chattanooga Shale, and various divisions of the Mississippian limestones. These strata have been particularly good exploration targets where juxtaposed beneath the pre-Pennsylvanian unconformity.
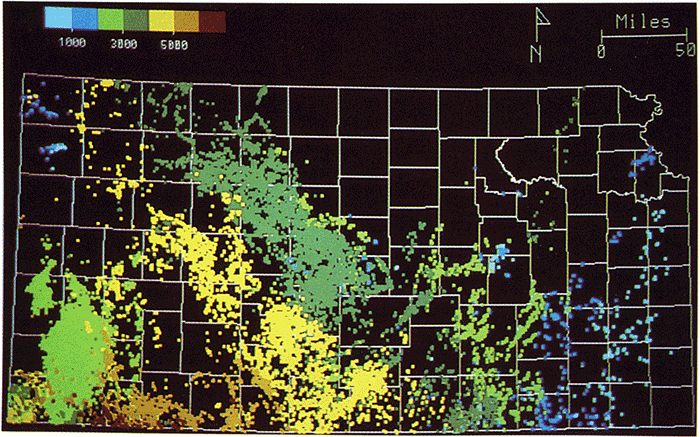
Many zones above the pre-Pennsylvanian unconformity produce oil and gas, particularly the sandstones within the Morrowan Kearny Formation and the Desmoinesian Marmaton and the Missourian Kansas City and Lansing groups. Significant gas production is limited to the Wolfcampian Permian, namely the Chase and Council Grove groups. Petroleum reservoirs are generally less than 3 m (10 ft) thick and more commonly, are less than 2 m (7 ft) thick. The depth to these pays varies from less than 1,000 ft (300 m) in eastern Kansas in oil- and gas-bearing sandstones of the Cherokee Group, to more than 6,500 ft (1,980 m) for Morrowan and Mississippian pays in the Hugoton embayment (fig. 3).
Figure 3--Depths to deepest pay. the depths shown on this map are depths from the surface in feet. The depths are a function of both the geologic structure in an area and the overlying surface topography. The deepest production occurs in southwestern Kansas in the Hugoton embayment. The shallowest production in the state occurs in the Cherokee basin and Bourbon arch areas of eastern Kansas.
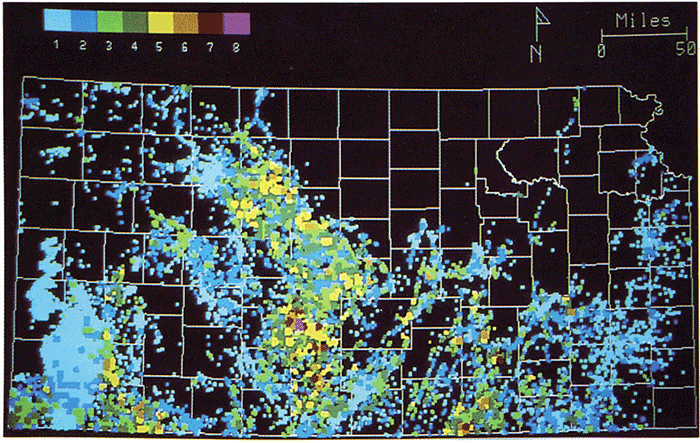
The area with the greatest number of pays is in Stafford County on the southern limit of the CKU and northern Pratt anticline (fig. 4). The CKU-Pratt anticline is one of the first major structures north of the Anadarko basin. Paleo-relief is indicated as far back as the early Paleozoic according to Bornemann et al. (1982). There are also other areas with several stacked pays which correspond to prolific fields such as El Dorado, Augusta, Voshell, and other anticlinal structures including those in southwestern Kansas.
Figure 4--Number of producing zones per township. This map represents a computer search which counted the number of pay zones at each well in Kansas and included any other pays that might have been present in wells within 3 mi distance. A maximum number of 12 producing zones corresponding to the individual production maps in this report are possible. Counts of pay zones according to this hierarchy can produce some anomalies. For instance, if more than one zone produces in a given well from the Lansing-Kansas City Group, it would be counted only once as Missourian production. Conversely, if a producing unit such as the Simpson subcrops beneath the pre-Pennsylvanian unconformity and is in hydraulic continuity with a Cherokee sand developed on the unconformity in a nearby well, both zones would be counted as separate producing horizons even though only one zone is, for practical purposes, productive.
The series of maps shown in figs. 5-16 illustrate the distribution of producing wells through 1983. Pays illustrated include the Arbuckle and sub-Arbuckle; Simpson; Viola and Maquoketa; Hunton; Chattanooga and Misener; Mississippian-age limestones; Morrowan and Atokan; Desmoinesian Cherokee and Marmaton groups; the Missourian-age Lansing, Kansas City, and Pleasanton groups; the Virgilian-age Shawnee and Wabaunsee groups; Lower Permian strata; and Cretaceous strata. Each square on the maps is approximately 4 mi2 (3.2 x 3.2 km) and represents a producing or abandoned oil and gas well. Please note that records from early wells drilled in eastern Kansas are sparse. Records are more complete in western Kansas, so for this area the individual production maps better reflect the producing trends and individual field outlines.
Figure 5--Arbuckle (Cambrian and Ordovician) and sub-Arbuckle. Most Arbuckle production is from the Central Kansas uplift where dolomites of this unit subcrop on several structural and topographic highs beneath the pre-Pennsylvanian unconformity (Walters, 1958). Over 1.4 billion barrels of oil have been produced from the Central Kansas uplift Cambrian and Ordovician rocks (Adler, 1971). Pre-Arbuckle production includes local production from the underlying Reagan Sandstone (Miller, 1968) and locally fractured granites which produce from buried Precambrian hills in Barton County (Walters, 1946).
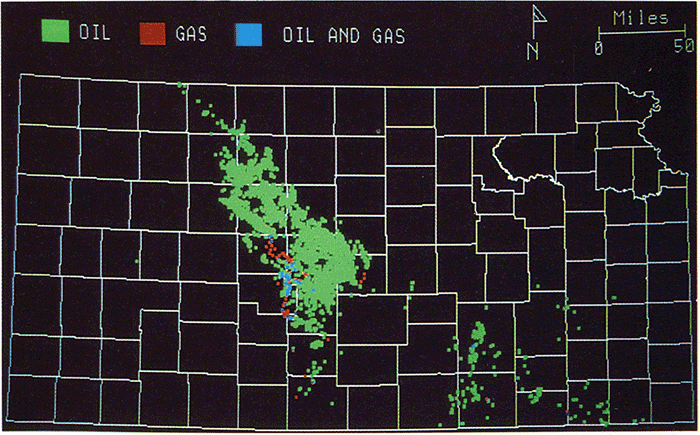
Figure 6--Simpson (Middle Ordovician). The Simpson Group is primarily composed of shales and well-rounded quartz sands deposited as the basal unit of a significant marine transgression in Ordovician time (Adler, 1971). Production is primarily found along the periphery of the Central Kansas uplift and along the Pratt anticline where the Simpson subcrops beneath the pre-Pennsylvanian unconformity. The Simpson is a main component of the Stapleton zone, a porous unit locally developed beneath the pre-Pennsylvanian unconformity at the El Dorado field in Butler County (Jewett, 1954). The El Dorado field, discovered in 1915, is the most prolific oil field in Kansas.
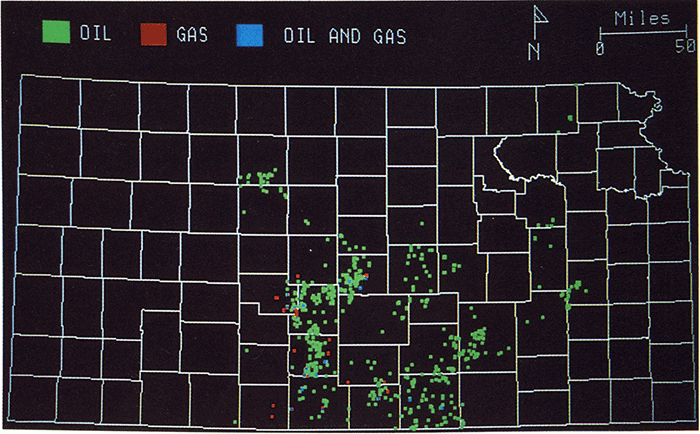
Figure 7--Viola and Maquoketa (Middle and Upper Ordovician). The Viola Limestone (and the Hunton Formation further upsection) are the main pay zones in the Forest City basin in northeastern Kansas. Major production occurs in Saline and McPherson counties in a series of structural traps (Gillberg, Salina, Olsson, and Lindsborg fields), in the large Zenith-Peace Creek stratigraphic trap in Stafford County (Imbt, 1941; Kornfeld, 1943), and in the El Dorado field in Butler County (Reeves, 1929). Porous dolomites comprise the main reservoir rock in the Maquoketa and production from this unit is primarily limited to the fields in Saline and McPherson counties.
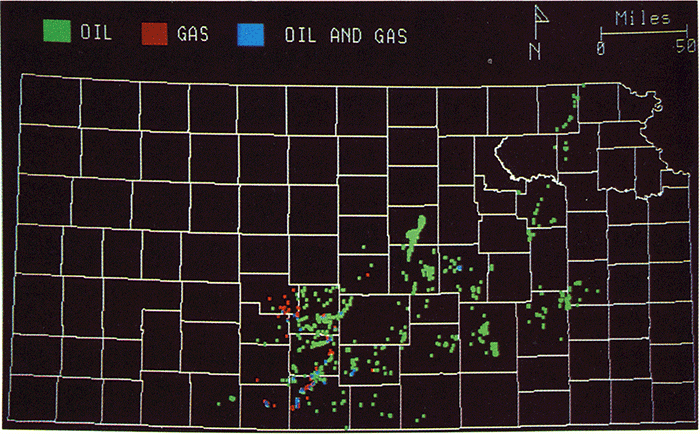
Figure 8--"Hunton" (Silurian and Middle Devonian). The Hunton is the informal name given to the zone of limestones and dolomites situated between the overlying Chattanooga Shale and the underlying Maquoketa Shale. The Hunton, together with the Viola formation, comprises the main pay zone in the Forest City basin. Several structural-stratigraphic traps payout from the Hunton in Marion and McPherson counties. In this area, the Hunton is truncated to the north by a large east-west-trending valley filled by Chattanooga Shale. The Chattanooga Shale forms the updip seal in these traps (Brown, 1960).
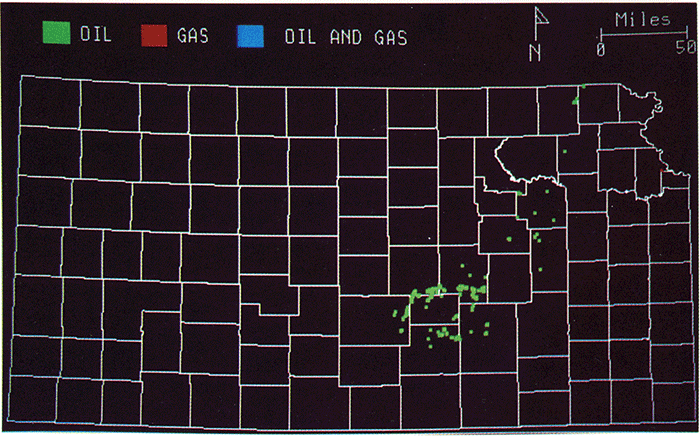
Figure 9--Chattanooga and Misener (Upper Devonian and Lower Mississippian). The Misener sandstone (sometimes called "Kinderhookian sand") is developed at or near the unconformity at the base of the Chattanooga Shale. The Misener is a discontinuous unit and produces from several scattered localities in south-central Kansas. The major production in this unit occurs in two stratigraphic traps where the Misener subcrops beneath the pre-Pennsylvanian unconformity. These traps are the Wi! field in eastern Edwards County (Stevens, 1960) and the West Lyons field in Rice County (Ehm, 1965).
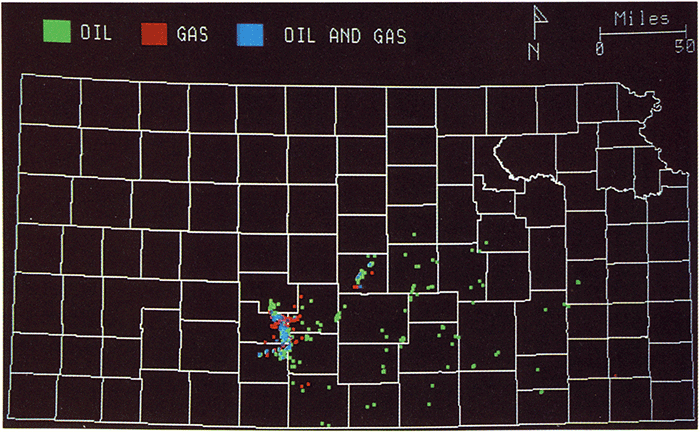
Figure 10--Mississippian fields producing from the Mississippian limestones are very widespread over the state. A major pay zone is the Mississippian "chat," a cherty, weathered and conglomeratic porous zone which is developed beneath the pre-Pennsylvanian unconformity. The chat pays out in several large fields, including the Lost Springs field, a stratigraphic trap in Marion County (Shenkel, 1955); the Wherry and Welch-Bornholdt fields, stratigraphic traps in Rice County (Clark et al., 1947); the Spivy-Grabs-Basil field, a stratigraphic trap in Kingman and Harper counties (Frensley and Darmstetter, 1965); the Wil field, a stratigraphic trap in Edwards County (Stevens, 1960); and the Voshell field, a structural trap in McPherson County (Hiestand, 1933). In southwestern Kansas, several fields are associated with the truncation edges of various Mississippian limestone units (Ebanks et al., 1977; Watney and Paul, 1983).
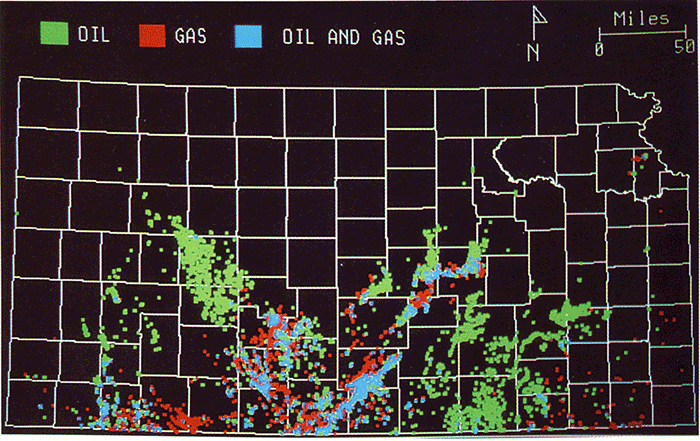
Figure 11--Morrow and Atoka (Lower and Middle Pennsylvanian). Morrowan and Atokan strata are primarily limited to southwestern Kansas where they form a wedge of sediments thickening southward into the Hugoton embayment. Morrowan reservoir rocks are dominantly channel or lenticular sandstones such as those at the McKinney field in Clark and Meade counties (Jamieson, 1959) and the Harper Ranch field in Clark County (Waite, 1956). Sand trends in the Morrow are presently attracting considerable exploration interest in southwestern Kansas.
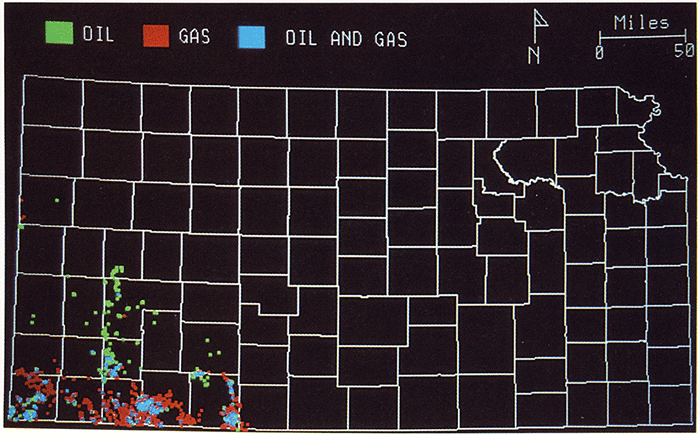
Figure 12--Desmoinesian (Middle Pennsylvanian). Desmoinesian-age strata in Kansas include the Cherokee and Marmaton groups. Most Cherokee production is from lenticular channel sandstones in eastern Kansas. These reservoir rocks are sometimes called "shoestring" or "squirrel" sands (Jewett, 1954). Marmaton production is dominantly from carbonate rocks in structural and stratigraphic traps in western Kansas (Adler, 1971). Cherokee channel sands are some of the oldest exploration plays in the midcontinent. Some of the more important shoestring sand fields in eastern Kansas include the Smock-Sloss, Weaver, and Fox-Bush fields in Butler County and the Sail yards pool in Greenwood County (Jewett, 1954). Drill records are incomplete in extreme eastern Kansas, hence the pattern of wells in this area will not strictly follow known "field outlines.
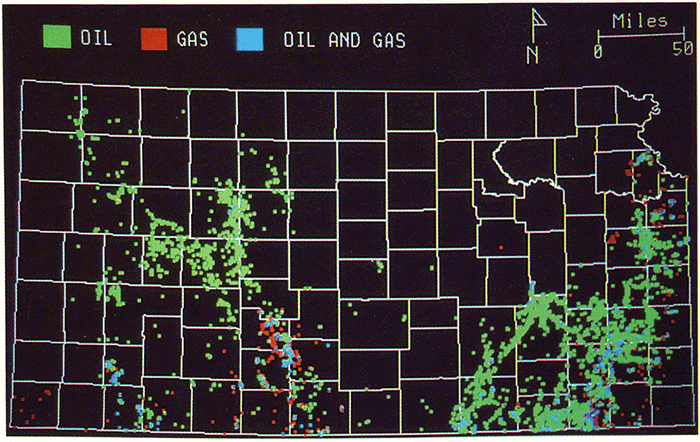
Figure 13--Missourian (Upper Pennsylvanian). Missourian-age strata in Kansas include the Lansing-Kansas City and Pleasanton groups. Major production from these units occurs primarily over the Central Kansas uplift. Pay zones are generally thin carbonate grainstones. Several separate zones can be productive in a given area (Watney, 1980). Accumulations are largely localized in structural or combination structural-stratigraphic traps (Rascoe and Adler, 1983). Important Lansing-Kansas City production occurs in the Bemis-Shutts field in Ellis County, the Hall-Gurney field in Russell County, the Trapp field in Russell and Barton counties, and the Kraft-Prusa field in Barton County.
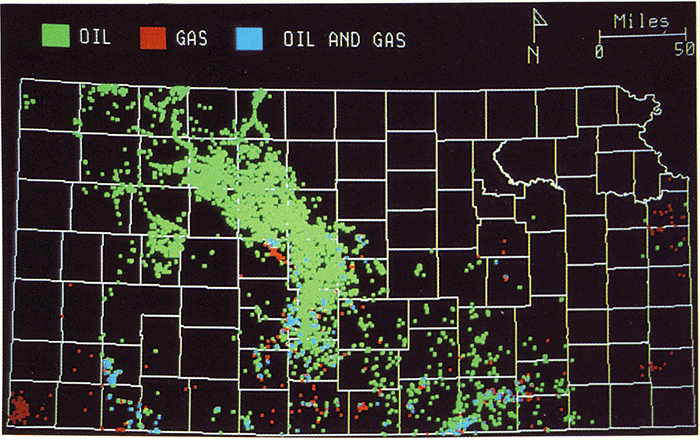
Figure 14--Virgilian (Upper Pennsylvanian). Virgilian-age strata in Kansas include the Douglas, Shawnee, and Wabaunsee groups. Several separate pay zones, both sandstone and limestone, may produce from these units. Scattered oil production occurs over the Central Kansas uplift. The most important gas production from Virgilian rocks is at the Greenwood field in Morton County. This field is a stratigraphic trap where several thin porous limestones make a transition westward to impermeable limestones (Wingerter, 1968).
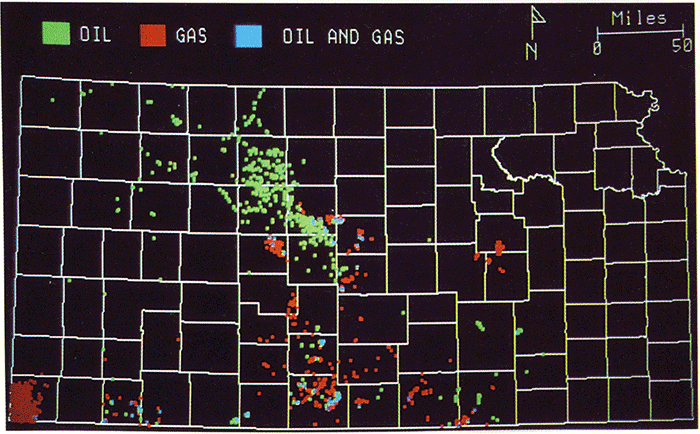
Figure 15--Permian. Permian-age strata in Kansas include the Admire, Council Grove, Chase, Sumner, and Nippewalla groups. Gas production occurs in scattered structural and stratigraphic traps in south-central Kansas, including minor production over the NV in Morris and Chase counties from the Wilde and Wilsey fields (Smith, 1960). The giant Hugoton field in southwestern Kansas pays out from several porous limestones in the Chase Group. Along the western side of the Hugoton field in Kansas is the Panoma field which produces from the underlying porous limestones of the Council Grove Group. The Hugoton field, a large stratigraphic trap discovered in the early 1920's extending down into the panhandles of Texas and Oklahoma, is one of the world's largest gas fields.
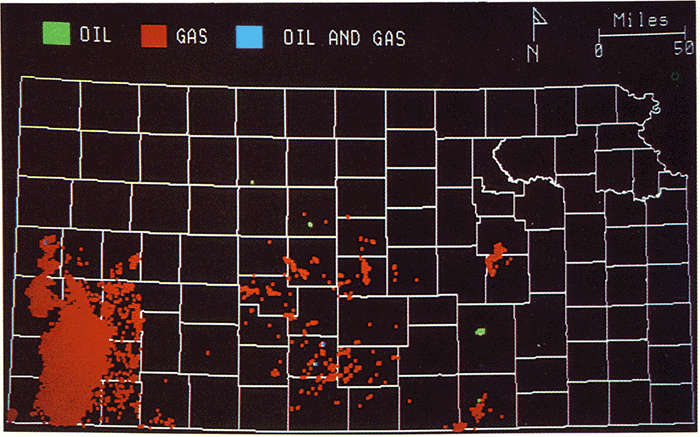
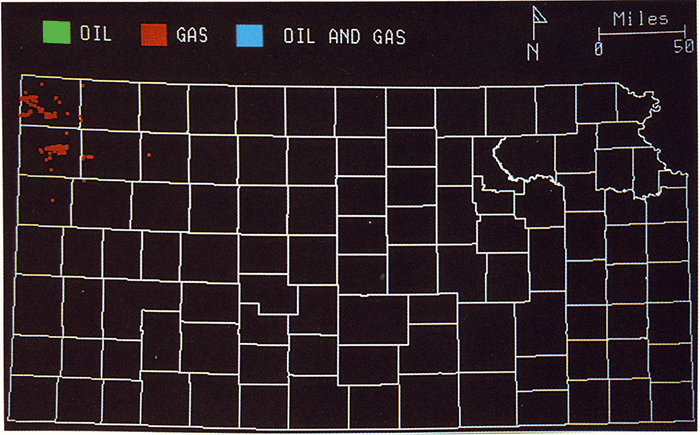
Figure 16--Mesozoic. Mesozoic gas comes from porous chalks of the Cretaceous Niobrara Formation. The chalks produce from small low-relief structures in the northwestern part of the state (Pollastro and Scholle, 1984). Significant commercial exploration of the Niobrara gas in northwestern Kansas has been active only since the early 1970's. It is expected that the production limit of the Mesozoic gas fields in Kansas could be considerably extended over the next few years.
The most widespread pay in Kansas, which also contains over 24% of the original oil-in-place, is the Mississippian-age limestones (fig. 10). The Mississippian limestones pinch out around the edges of the major uplifts and form broad subcrop bands in the adjacent basins beneath the pre-Pennsylvanian unconformity. The Arbuckle Group dolomites are present throughout most of the state and contain 47% of the original oil-in-place. Significant production in the Arbuckle occurs where it lies directly beneath the pre-Pennsylvanian unconformity on major uplifts including most of the CKU and the portions of the southern Nemaha uplift.
The distribution of the Morrowan Kearny formation is limited to southwestern Kansas as previously discussed. Lenticular sandstone reservoirs within this interval have been prolific oil and gas producers and the focus of high-resolution seismic exploration. Ben and Larry Rummerfield describe production from this interval in this volume.
Production from sandstones in the Cherokee Groups comes primarily from shallow depths in eastern Kansas (fig. 12), although Cherokee production is also becoming increasingly important from greater depths off the western edge of the CKU. The activity in eastern Kansas is almost exclusively that of independents and individuals. Seismic surveys have not been commonly used but geophysics could play a larger role in search of exploration targets in this interval in both eastern and western Kansas. Papers are presented in this volume on the use of gravity and magnetic (Stander, this volume) and seismic methods (Ready and Knapp, this volume) in detecting these lenticular sandstones.
The Lansing and Kansas City groups (fig. 13) consist of a dozen cyclothems where reservoirs are generally thin, discontinuous, skeletal, grain-rich units at the tops of limestones. A major portion of the production from these units is from the CKU, but significant exploration and development is taking place in western Kansas in the northern Hugoton embayment.
A major part of the Hugoton-Panoma-Panhandle gas area, the largest gas field in the conterminous United States, is found in southwestern Kansas (fig. 15). Wells producing from the Permian Chase and Council Grove groups are spaced 1 mi (1.6 km) apart at depths averaging 2,500 ft (750 m). Many small, shallow, gas wells were completed in western Kansas during a brief increase in demand and price in the late 1970's.
As a petroleum province such as the midcontinent matures, most of the obvious traps are tested so exploration emphasis gradually shifts to what Halbouty (1982) refers to as the search for the "subtle trap." A subtle trap is a trap without significant and readily noticeable structural expression, usually a stratigraphic, unconformity, or paleogeomorphic trap. Kansas, being a part of the midcontinent province, is a hunting ground for such subtle traps. As outlined in the previous section on the distribution of petroleum production in Kansas, several sub-unconformity stratigraphic traps have been found in the state. More subtle traps will undoubtedly be found but the search for them will not be easy.
A variety of subsurface prospecting methods are available to the explorationist to search for petroleum, including structure, isopach, and lithofacies maps based on well information. Geophysics has also been used to explore for petroleum in Kansas. Some of the earlier studies are outlined in the volume for the first symposium on geophysics in Kansas (Hambleton, 1959). The primary use for reflection geophysics at that time was a means for defining geologic structures. Reflection seismology, until the late 1960's, had limited use as a tool for finding stratigraphic traps (Lyons and Dobrin, 1972), particularly subtle features such as sand lenses and updip porosity pinchouts.
Reflection seismology, however, has made several quantum advances in recent years. These advances, which include common depth point (CDP) stacking, digital computer processing, better energy sources, and more efficient recording equipment, have greatly increased the ability of the seismic method to detect subtle traps by essentially enhancing the signal-to-noise ratio of the data. No matter how good the signal-to-noise ratio of the data becomes, though, a hard physical reality which controls the resolution, or the ability of the seismic method to "see" thinner beds, is the wavelet-pulse width (Ricker, 1953). Several factors influence pulse-time width, but most basic is the relationship that pulse width cannot be less than the reciprocal of the frequency bandwidth. This is the scaling property of Fourier transform theory (Brigham, 1974). It is, therefore, desirable to record data with frequency bandwidth of at least a couple of octaves.
If we approach the pulse width-frequency bandwidth question in terms of octaves, it is clear that a bandwidth of two octaves has greater resolving power if the bandwidth is high in frequency. For instance, typical or standard seismic-reflection data might have a bandwidth of 15 to 60 hertz (Hz) (two octaves, the high-frequency cutoff is four times the low-frequency cutoff). The frequency bandwidth is 45 Hz which suggests an optimum wavelet pulse width of about 22 milliseconds (msec). High-resolution seismic-reflection data, on the other hand, might have a bandwidth of 50-200 Hz, again two octaves. The frequency bandwidth is 150 Hz and the optimum pulse width will be about 7 msec, roughly three times the resolving power of standard data. (Note that in practice, wavelet pulses are probably twice as long as this theoretical lower limit.)
With the understanding that we have to record broad-band data, the discussion should be shifted to one of wavelength. When broad-band data are recorded, the wavelet pulse has an apparent or dominant frequency of roughly two-thirds the high-frequency cutoff value (Kallweit and Wood, 1982). Note that the apparent frequency of our two previous examples is 40 and 133 Hz, respectively. This value is typically determined by measuring the period between successive peaks (or troughs) on the wavelet.
Although dominant frequency of a wavelet is measured on the seismic section, when the wavelet is propagating through the earth its length is measured by its wavelength, assuming we have a concise wavelet (at least two octaves bandwidth). The resolution of rock thickness is related to the apparent wavelength of the wavelet. Wavelength is controlled by the velocity of the rocks and the apparent frequency of the seismic signal where:
wavelength = velocity/frequency.
The above equation simply states that the wavelength of the seismic pulse is directly proportional to the velocity of the seismic signal in the rocks through which it travels and is inversely proportional to its apparent frequency. High velocities in rocks will cause the wavelength of a pulse of a specific frequency to spread out, thereby decreasing its efficiency in seeing thin beds. Similarly, low-frequency seismic data will be able to resolve less detail than seismic data based on higher frequency seismic sources.
The apparent frequency content of most reflection exploration geophysical data today ranges between 25 and 40 Hz (Sheriff, 1977). The resultant wavelengths corresponding to this frequency range will vary according to the velocity of the rock through which the energy travels. The average velocity of the Paleozoic rocks in Kansas is approximately 12,000 ft/sec (3,600 m/sec), The wavelengths that result when 25-40 Hz energy is propagated through rock of this velocity range from 480 to 300 ft (145-90 m). On most Kansas seismic sections, a wavelet which represents a single reflector will therefore be the expression of a seismic pulse with a wavelength of several hundred feet.
On a smaller scale, bed-to-bed changes in rock velocity and density govern whether or not a downward-traveling seismic pulse will be reflected upward and what the intensity of the reflected pulse will be. The amplitude and polarity of a reflected pulse is proportional to the reflection coefficient:
reflection coefficient = F [ (ρ2V2 - ρ1V1) / (ρ2V2 + ρ1V1)]
where ρ1, V1, and ρ2, V2 are density and velocity values respectively for an overlying bed (bed 1) and a directly subjacent bed (bed 2). The product ρV is known as the acoustic impedance. The highest amplitude reflections occur where two adjacent beds have considerable differences in acoustic impedance. An interface such as a shale overlying a nonporous limestone therefore will be characterized by a higher amplitude reflection than an interface between a slightly porous limestone and a nonporous limestone.
A seismic-reflection horizon, as viewed on a seismic section, may also be the summation of several individual reflections derived from numerous thin beds. The longer the apparent wavelength, or the thinner the beds, the more probable a reflection on a seismic section will be a composite of several closely spaced reflectors, each with its own characteristic reflection coefficient. If higher frequency energy sources are used to generate a seismic pulse, the wavelet pulse will be shorter, thereby increasing the probability that a seismic reflector will be derived from a single interface rather than several interfaces. The increased resolution provided by higher frequency energy sources enables the seismic interpreter to better follow changes in thickness and reflection character of individual beds, rather than packages of beds. The observation and interpretation of lithologic variations by seismic reflections is, of course, the essence of seismic stratigraphy.
The minimum thickness of a single bed which can be detected by the seismic-reflection method is determined to be one-quarter of the dominant wavelength of a seismic pulse. Below one-quarter wavelength, the peak-to-trough separation of a seismic wavelet becomes constant, and individual reflections from the top and base of a bed cannot be separately identified. For beds with thicknesses below 1/4 of a wavelength, thickness information sometimes can be extracted from the amplitude of the reflection (Widess, 1973; Meckel and Nath, 1977).
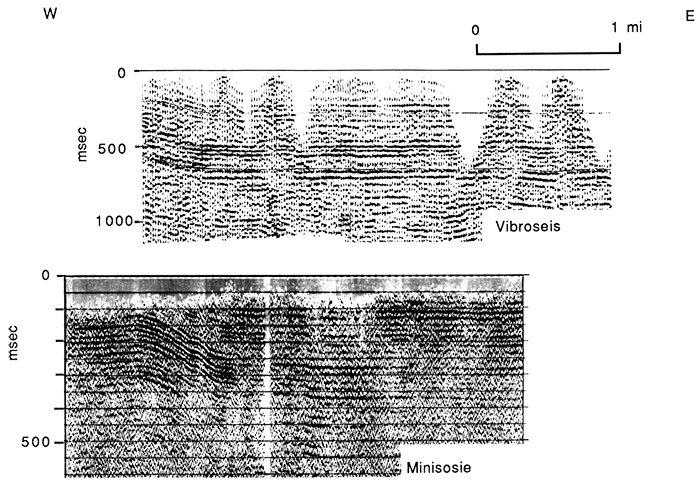
An unfortunate disadvantage is inherent in using higher frequency seismic sources. Although use of higher frequencies will yield better resolution, seismic wavelets associated with higher frequencies are attenuated preferentially over those associated with lower frequencies. It is therefore more difficult to obtain deeper reflections with high-frequency seismic sources. Illustrating this point are two seismic sections recorded in eastern Kansas across the Humboldt fault (fig. 17). Both sections were shot at the same locality using Vibroseis and MiniSOSIE seismic sources. The dominant frequency content of the Vibroseis line is approximately 30 Hz, while the MiniSOSIE system generates waves with approximately 80-Hz frequency content. Vibroseis, by virtue of its greater energy content and lower frequency, sees deeper than the MiniSOSIE system. The trade-off is that the MiniSOSIE line shows four or five more individual reflections within a given time interval.
Figure 17--Humboldt fault seismic lines. These two seismic lines were shot along the same trace and illustrate the trade-off between penetration and resolution that commonly occurs with low- versus high-frequency seismic data. The Vibroseis line has a lower frequency content than the MiniSOSIE line. Several closely spaced shallow reflectors can be seen on the MiniSOSIE line but due to the selective attenuation of the high-frequency energy, deeper reflectors cannot be seen as they are on the Vibroseis line. A discussion of the MiniSOSIE line is found in Stander (this volume).
A major problem which confronts geophysicists experimenting with high-frequency reflection geophysical studies is the development of louder seismic sources which will send a high-frequency pulse deeper into the earth. Considerable effort has been dedicated to this at the Kansas Geological Survey under the direction of Don Steeples and Ralph Knapp. Some success has been achieved with high-velocity projectiles such as 50-caliber bullets (Steeples, 1984). Data in the 80-Hz range has been successfully recorded from reflectors at 3,500 ft (1,070 m) by a MiniSOSIE system (Roehl et al., this volume).
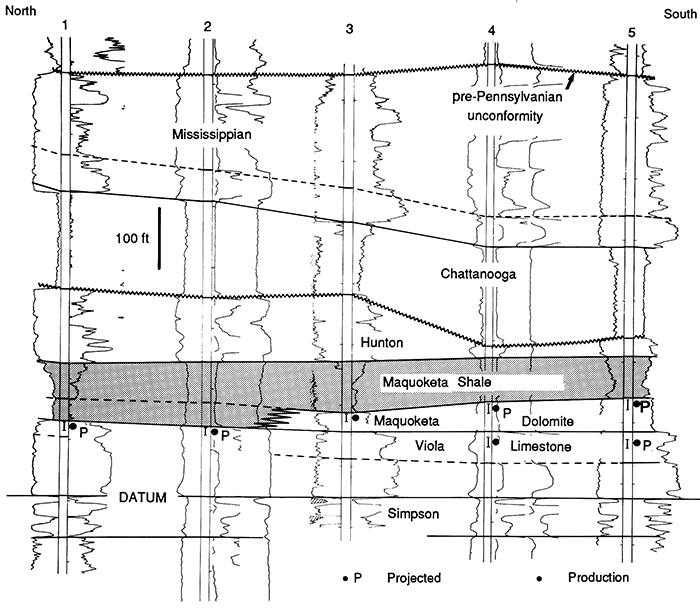
What then will be the potential use of 100-Hz seismic information in Kansas and how can it be used to define difficult -to-detect stratigraphic traps? The application of the method, of course, varies with the individual circumstance but a hint of its potential use is exemplified by its ability to detect a stratigraphic pinchout in lower Paleozoic strata from an area in central Kansas. This test area is in Saline County along the Salina-Lindsborg oil-field trend (fig. 18). These fields, which payout from porous zones within the Simpson, Viola, and Maquoketa formations, are located over a series of structural closures at the southern flank of the Salina basin (Brewer, 1959). A regional well-log correlation line (fig. 19) reveals a stratigraphic pinchout along this trend, which simulates a type of stratigraphic trap that possibly could be explored by high-resolution reflection geophysics. In this example, a 26-ft (8-m)-thick porous dolomite abruptly changes northward to a shale stratigraphically equivalent to the lower part of the Middle Ordovician Maquoketa Shale. Although the pinchout of this particular porous dolomite bed actually may be related to local syndepositional differential growth between various structures in the Salina-Lindsborg trend, it could also be an expression of a type of stratigraphic trap that could be more widespread in the pre-Pennsylvanian section of Kansas.
Figure 18--Base map showing the location of the stratigraphic cross section in fig. 19 and the location of the USGS-KGS #1 Geis well.
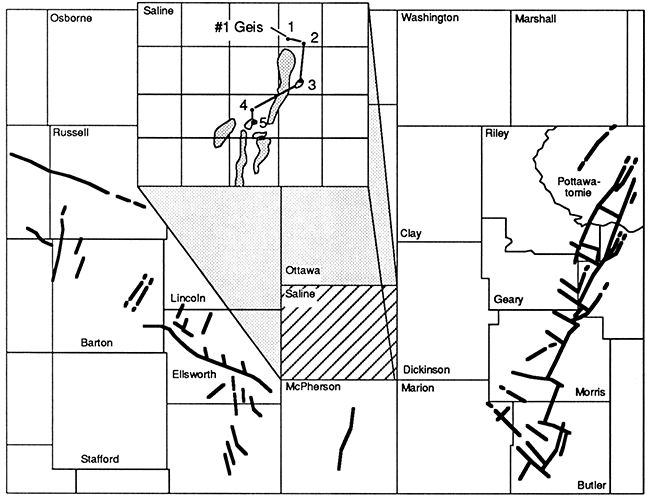
Figure 19--North-south stratigraphic cross section showing facies transition of a porous dolomite in the Maquoketa Formation to an equivalent shale. The logs are either gamma ray-neutron or SP-resistivity logs. The horizontal scale is not constant, but the total distance from the northernmost to the southernmost well is 15 mi (24 km).
A digitized sonic log that displays the porous dolomite is selected from the #1 Geis, a research well drilled cooperatively by the U. S. Geological Survey and Kansas Geological Survey in 1980 in SW sec. 32, T. 13 S., R. 2 W. (fig. 18). In order to simulate the stratigraphic change of the porous dolomite to shale, it is only necessary to change the velocity of the dolomite (13,350 ft/sec; 4,070 m/sec) to a velocity expected of shale (10,000 ft/sec; 3,050 m/sec). The expected seismic response of both stratigraphic sections (shale vs. porous dolomite) can be simulated by comparing synthetic seismograms generated from both the original and altered sonic logs. The synthetic seismograms are prepared using the Kansas Geological Survey KOALA computer program for well-log analysis (Doveton and Cable, 1980), which utilizes a sonic log to initially generate a series of reflection coefficients. A Ricker wavelet is then convolved down this series of reflection coefficients to produce the synthetic seismograms. Although changes in density are neglected in computing the synthetic seismograms, the seismograms should still be reasonable approximations of the expected seismic response.
Fig. 20 indicates that a 30-Hz zero-phase Ricker wavelet convolved over both the original and altered sonic logs does not yield any readily observable differences in their respective seismic responses. The 30-Hz wavelet approximates the frequency used in most conventional seismicreflection data (Sheriff, 1977). The thickness of the porous dolomite (26 ft; 8 m) corresponds to about 1/15 wavelength (30 ft; 9.1 m). This is thinner than the 1/4-wavelength thickness necessary to attain actual separation of the wavelets representing the top and bottom of the bed in question.
Figure 2O--Comparison of seismic response of stratigraphic transition between porous dolomite and shale at the USGS-KGS #1 Geis well. Partly due to the long wavelength of the 30-Hz signal, there is no significant difference in the seismic response between the two logs at this frequency.
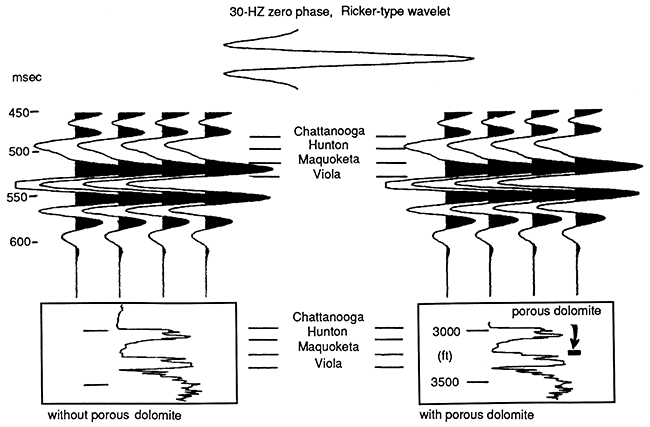
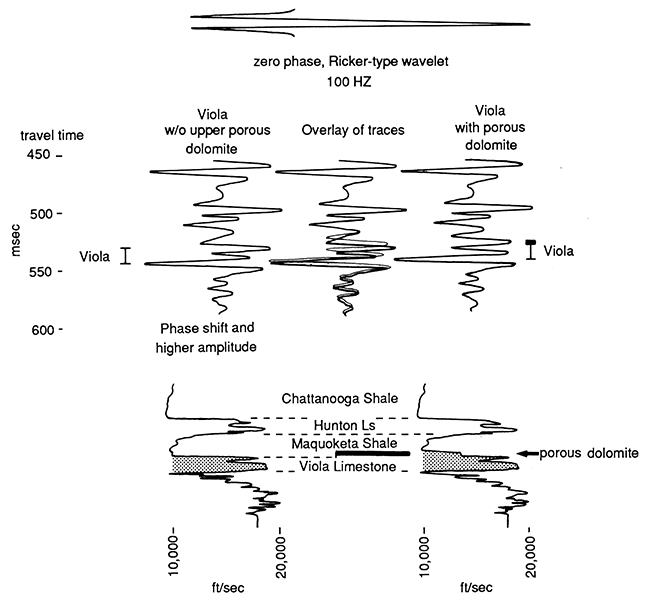
Fig. 21 compares the seismic response of a 100-Hz Ricker wavelet convolved over the same logs shown in fig. 20. The difference in seismic response of the porous dolomite versus the shale is subtle but observable by two characteristics. First, the peak at the base of the porous dolomite, corresponding to the velocity contrast between the dolomite and the underlying non-porous Viola Limestone, increases in amplitude as the dolomite makes its transition to shale. The increase is attributed to the greater velocity contrast the shale has with respect to the underlying Viola Limestone. Second, due to the lower velocity of the shale, reflections from beds below the shale are displaced downward by approximately 5 msec. Mapping using high-resolution seismic data could possibly determine the transition line between the porous dolomite and shale by mapping either of these changes, or a combination of both. The most likely stratigraphic trap would occur where the facies-transition line crosses a structural nose, provided that the porous dolomite is in the downdip direction.
Figure 21--Comparison of shale and porous dolomite at 100-hz frequency. Subtle changes are evident in the seismic response: an increase in the amplitude of the reflection at the base of the porous dolomite and a 5-msec time delay for all reflectors below the porous dolomite.
Although the utility of high-resolution seismic data for detecting stratigraphic changes in the lower Paleozoic section of Kansas is apparent, application of the same technique to detecting the stratigraphic limits of the reservoir units in the Pennsylvanian and Permian rocks will be difficult because these cyclothem-dominated units generally contain thinner reservoirs than the underlying lower Paleozoic rocks.
Furthermore, although Permian and Pennsylvanian strata in Kansas are stratigraphically bounded by marked suprajacent and subjacent angular unconformities, no major angular unconformities are present within these systems. With the exception of channels (see Roehl etaI., this volume), stratigraphic traps associated with any angular unconformities present within the Permian and Pennsylvanian sections will be difficult to detect on short seismic sections that would probably be used to define a small- to moderate-size prospect characteristic of the midcontinent geologic province. Permian-Pennsylvanian strata at depths associated with most oil accumulations will probably be characterized on such seismic lines by several parallel reflecting horizons. Except in unusual circumstances, most of these seismic reflectors will represent several interfaces from numerous thin beds rather than a single interface between the thick homogeneous beds.
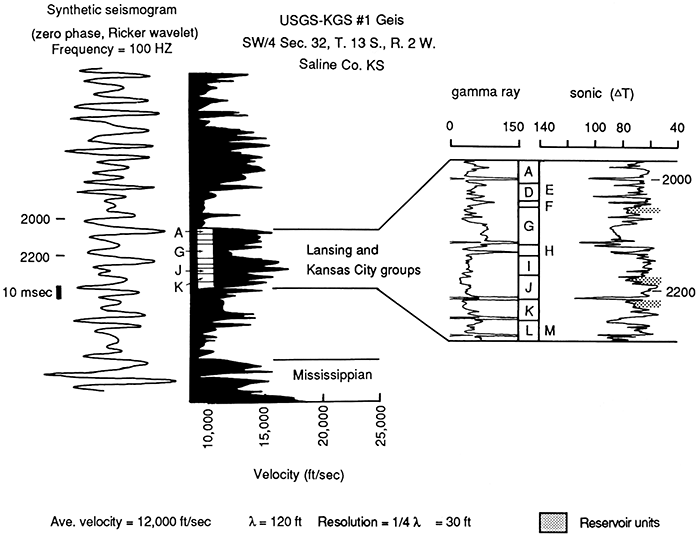
The seismic expression of Pennsylvanian strata using a simulated 100-Hz energy source is shown in fig. 22. A segment of the Lansing-Kansas City section taken from the USGS-KGS #1 Geis well in Saline County is used in this example and is typical of the upper Paleozoic cyclothemic strata in Kansas. The geophysical well log shown in this figure shows several alternations of shale and porous to nonporous limestone. The beds with the lowest average velocities correspond to organic-rich, high-gamma-ray shales, which generally range in thickness from 4 to 6 ft (1.2-2.0 m). Porous limestones, the potential reservoir rocks, are slightly thicker, ranging from 10 to 14 ft (3-4.3 m) thick. A 1/4 wavelength slice of a 100-Hz pulse traveling through this strata (12,000 ft/sec; 3,660 m/sec average velocity) corresponds to a thickness of 30 ft (9 m). This value is two to three times the thickness of the potential reservoir units shown on the log. The breadth of the reflections on the synthetic seismogram compared to the stratigraphy in fig. 22 also graphically illustrates that it would be very difficult to follow the pinchout of any of these thin porous units by noting any separation of reflections respectively generated from the base and top of a single reservoir. Pulses of 200 Hz or greater would be needed before the reservoir units could be detected within the Lansing-Kansas City groups by following discrete reflections respectively from their base and top.
Figure 22--100-Hz seismic response of Lansing-Kansas City groups. The trace of the synthetic seismogram shows no appreciable stratigraphic detail. Observing lateral facies changes of the porous zones in the Lansing-Kansas City cyclothems would probably be very difficult with the 100-Hz seismic information.
Although the thin reservoir beds of the Permian-Pennsylvanian section may not be detectable with conventional seismic sections, thickness information may be ascertained by analysis and comparison of waveforms (Widess, 1973; Meckel and Nath, 1977). Unconventional data presentation illustrating such attributes as velocity, phase angle, and apparent polarity (Taner and Sheriff, 1977) may also have utility, but application of such techniques is dependent on acquisition of relatively "clean" data and is subject to how effective such techniques may be in a given geologic situation. Unusual costs attendant to unusual seismic processing may also erase the close profit margins of some smaller prospects.
Our understanding of the geology of Kansas is undergoing a revolutionary change in perspective. Plate tectonics now provides mechanisms for deformation in the craton and a means of producing episodic widespread changes in sea level which help explain the patterns of sedimentation observed in the Paleozoic strata of the state. Reflections geophysics has seen a similar advancement in both technology, with improved resolution and lower costs, and in interpretation. Seismic computer modeling in conjunction with geologic interpretation is providing new perspectives to the solution of stratigraphic problems. Experimentation with high-frequency seismic sources shows potential for application to petroleum exploration in Kansas, particularly in the search for subtle traps. At present, technological levels though, even high-resolution seismic methods, may not be useful in readily detecting pinch-outs of thin reservoirs typical of Permian and Pennsylvanian cyclothems. However, pre-Pennsylvanian reservoirs such as those in the Mississippian, Hunton, Viola, and Arbuckle carbonate rocks have stratigraphic attributes that appear to be distinguishable with this new seismic technology. Such technology will be useful, economic, and successful in Kansas, provided incentives for exploration of small and subtle prospects persist.
The authors wish to thank Mike Lambert, Mark Zell, Talat Abdullah, Renate Hensiek, Jennifer Sims, and Pat Acker for their help in preparing the illustrations; John Doveton for assisting with the synthetic seismograms; and Charles Ross and Rick Brownrigg for assisting with the computer programming necessary to generate the production maps. The production maps were created using the facilities of the Automated Cartography Laboratory at the Kansas Geological Survey. We also give our thanks to Lea Ann Davidson for typing the manuscript.
Adler, F. J., 1971, Future petroleum provinces of the mid-continent, region 7; in, Future Petroleum Provinces of the United States--Their Geology and Potential: American Association of Petroleum Geologist, Memoir 15, p. 985-1,120.
Berendsen, P., and Blair, K., 1986, Subsurface structural maps over the Central North American rift system (CNARS), central Kansas, with discussion: Kansas Geological Survey, Subsurface Geology Series 8, 16 p., 7 maps. [available online]
Bornemann, E., Doveton, J. H., and St. Clair, P. N., 1982, Lithofacies analysis of the Viola Limestone in south-central Kansas: Kansas Geological Survey, Petrophysical Series 3, 44 p. [available online]
Brigham, E. O., 1974, The fast Fourier transform: Prentice-Hall, Englewood Cliffs, New Jersey, p. 32-37.
Brown, A. R., 1960, Unger Field; in, Kansas Oil and Gas Fields, v. 3: Kansas Geological Society, p. 142-148.
Brewer, R. R., Jr., 1959, A geophysical case history of the Lindsborg pool, McPherson County, Kansas; in, Symposium on Geophysics in Kansas: Kansas Geological Survey, Bulletin 137, p. 287-295.
Brewer, J. A., Good, R., Oliver, J. E., Brown, L. D., Kaufman, S., 1983, COCORP profiling across the southern Oklahoma aulacogen: overthrusting of the Wichita Mountains and compression within the Anadarko basin: Geology, v. 11, p. 109-114.
Clark, S. K., Arnett, C. L., and Royds, J. S., 1947, Geneseo uplift, Rice Ellsworth, and McPherson counties, Kansas; in, Structure of Typical American Oil Fields, v. 3: American Association of Petroleum Geologists, p. 225-248.
Crowell, J. C., 1978, Gondwana glaciation, cyclothems, continental positioning, and climate changes: American Journal of Science, v. 278, p. 1,345-1,372.
Doveton, J. H., and Cable, H. W., 1980, KOALA--Kansas on-line automated log analysis system: Kansas Geological Survey, Petrophysical Series 2, 190 p.
Ebanks, W. J., Jr., Euwer, R. M., and Nodine-Zeller, D. E., 1977, Mississippian combination trap, Bindley field, Hodgeman County, Kansas: American Association of Petroleum Geologists Bulletin, v. 61, p. 309-330.
Ehm, A. E., 1965, Lyons West field; in, Kansas Oil and Gas Fields, v.4: Kansas Geological Society, p. 146-156.
Frensley, R. W., and Darmstetter, J. C., 1965, Spivey-Grabs field; in, Kansas Oil and Gas Fields, v. 4: Kansas Geological Society, p. 221-228.
Halbouty, M. T., 1982, The time is now for all explorationists to purposefully search for the subtle trap; in, The Deliberate Search for the Subtle Trap: American Association of Petroleum Geologists, Memoir 32, p. 1-10.
Hallam, A., 1963, Major epeirogenic and eustatic changes since the Cretaceous and their possible relationship to crustal structure: American Journal of Science, v. 261, p. 397-423.
Hambleton, W. W., ed., 1959, Symposium on geophysics in Kansas: Kansas Geological Survey, Bulletin 137, 375 p.
Hiestand, T. C., 1933, Voshell field, McPherson County, Kansas: American Association of Petroleum Geologists Bulletin, v. 17, p.169-191.
Imbt, W. C., 1941, Zenith pool, Stafford County, Kansas, an example of stratigraphic trap accumulation; in, Stratigraphic Type Oil Fields: American Association of Petroleum Geologists, Tulsa, Oklahoma, p. 139-165.
Jamieson, J. J., 1959, McKinney field; in, Kansas Oil and Gas Fields, v. 2: Kansas Geological Society, p. 104-111.
Jewett, J. M., 1954, Oil and gas in eastern Kansas: Kansas Geological Survey, Bulletin 104,397 p.
Kallweit, R. S., and Wood, L. C., 1982, The limits of resolution of zero phase wavelets: Geophysics, v. 47, p. 1,035-1,046.
Kornfeld, J. A., 1943, Peace Creek field (Kansas), a stratigraphic trap: World Petroleum, v. 14, no. 13, p. 38-47.
Lyons, P. L., and Dobrin, M. B., 1972, Seismic exploration for stratigraphic traps; in, Stratigraphic Oil and Gas Fields: American Association of Petroleum Geologists, Memoir 16, p. 440-452.
Meckel, L. D., Jr., and Nath, A. K., 1977, Geologic considerations for stratigraphic modeling and interpretation; in, Seismic Stratigraphy--Applications to Hydrocarbon Exploration: American Association of Petroleum Geologists, Memoir 26, p. 417-438.
Merriam, D. F., 1963, The geologic history of Kansas: Kansas Geological Survey, Bulletin 162, 317 p. [available online]
Miller, R. R., 1968, Geology of Otis-Albert field, Rush and Barton counties, Kansas; in, Natural Gases of North America; Part 3, Natural Gases in Rocks of Paleozoic Age: American Association of Petroleum Geologists, Memoir 9, v. 2, p. 1,588-1,615.
Morgan, L. C., 1932, Central Kanas uplift: American Association of Petroleum Geologists, Bulletin, v. 16, p. 483-484.
Peterson, R. A., Fillipone, W. R., and Coker, F. B., 1955, The synthesis from well log data: Geophysics, v. 20, p. 516-538.
Pollastro, R. M., and Scholle, P. A., 1984, Hydrocarbon exploration, development from low-permeability chalks-Upper Cretaceous Niobrara formation, Rocky Mountains region: Oil and Gas Journal, April 23, 1984, p. 140-145.
Rascoe, B., Jr., and Adler, F. J., 1983, Permo-Carboniferous hydrocarbon accumulations, midcontinent, U.S.A.: American Association of Petroleum Geologists Bulletin, v. 67, p. 979-1,00 I.
Reeves, J. R., 1929, El Dorado oil field, Butler County, Kansas; in, Structure of Typical American Oil Fields, v. 2: American Association of Petroleum Geologists, p. 160-167.
Ricker, N., 1953, Wavelet contraction, wavelet expansion, and the control of seismic reflection: Geophysics, v. 18, p. 769-792.
Shenkel, C. W., Jr., 1955, Geology of the Lost Springs pool area, Marion and Dickinson counties, Kansas: Kansas Geological Survey, Bulletin 114, pt. 6, p. 168-193. [available online]
Sheriff, R. E., 1977, Limitations on resolution of seismic reflections and geologic detail derivable from them; in, Seismic Stratigraphy--Applications to Hydrocarbon Exploration: American Association of Petroleum Geologists, Memoir 26, p. 3-14.
Sloss, L. L., 1963, Sequences in the cratonic interior of North America: Geological Society of America Bulletin, v. 74, p. 93-114.
Smith, R. D., 1960, Wilsey and Wilde fields; in, Kansas Oil and Gas Fields, v. 3: Kansas Geological Society, p. 180-192.
Steeples, D. W., 1984, High-resolution seismic reflections at 200 Hz: Oil and Gas Journal, Dec. 3, 1984, p. 86--92.
Stevens, H. W., Jr., 1960, Stratigraphic oil production in Wil pool area, Edwards County, Kansas: American Association of Petroleum Geologists Bulletin, v. 44, p. 130.
Taner, M. T., and Sheriff, R. E., 1977, Application of amplitude, frequency, and other attributes to stratigraphic and hydrocarbon determination; in, Seismic Stratigraphy--Applications to Hydrocarbon Exploration: American Association of Petroleum Geologists, Memoir 26, p. 301-327.
Waite, G., 1956, The Harper Ranch pool; in, Kansas Oil and Gas Fields, v. 1: Kansas Geological Society, p. 50-56.
Walters, R. F., 1946, Buried Precambrian hills in northeastern Barton County, central Kansas: American Association of Petroleum Geologists, Bulletin, v. 30, no. 5, p. 660-710.
Walters, R. F., 1958, Differential entrapment of oil and gas in Arbuckle dolomite of central Kansas: American Association of Petroleum Geologists Bulletin, v . 42, p. 2,133-2,173.
Watney, W. L., 1980, Cyclic sedimentation of the Lansing-Kansas City Groups in northwestern Kansas and southwestern Nebraska: Kansas Geological Survey, Bulletin 220, 72 p. [available online]
Watney, W. L., 1984, Recognition of favorable reservoir trends in Upper Pennsylvanian cyclic carbonates in western Kansas; in Limestones of the Midcontinent, N. J. Hyne, ed.: Tulsa Geological Society, Special Publication no. 2, p. 201-246.
Watney, W. L., 1985a, Evaluation of the significance of tectonic, sedimentary control versus eustatic control of Upper Pennsylvanian cyclothems in the western midcontinent; in, Recent Interpretations of Late Paleozoic Cyclothems: Proceedings of the Third Annual Meeting and Field Conference, Midcontinent Section, Society of Economic Paleontologists and Mineralogists, p. 105-140.
Watney, W. L., 1985b, Origin and development of four Upper Pennsylvanian (Missourian) sedimentary cycles in the subsurface of western Kansas: Kansas Geological Survey, Open-file Report 85-2, 506 p.
Watney W. L., and Paul, S. E., 1983, Oil exploration and production in Kansas--present activity and future potential: Oil and Gas Journal, July 25, 1983, p. 193-198; Kansas Geological Survey, Open-file Report 83-16.
Widess, M. B., 1973, How thin is a thin bed?: Geophysics, v. 38, p. 1,176-1,180.
Wingerter, H. R., 1968, Greenwood gas field, Kansas, Colorado, and Oklahoma; in, Natural Gases in Rocks of Paleozoic Age: American Association of Petroleum Geologists, Memoir 9, v. 2, p. 1,557-1,566.
Kansas Geological Survey
Comments to webadmin@kgs.ku.edu
Web version July 20, 2013. Original publication date 1989.
URL=http://www.kgs.ku.edu/Publications/Bulletins/226/Newell/index.html