Kansas Geological Survey, Bulletin 134, pt. 7, originally published in 1959
Originally published in 1959 as Kansas Geological Survey Bulletin 134, pt. 7. This is, in general, the original text as published. The information has not been updated. An Acrobat PDF version (5 MB) is also available.
In 1958, for the third consecutive year, the value of Kansas mineral production exceeded $500,000,000. Minerals produced in the state were valued at $514,234,445, or approximately $19,859,000 less than in 1957, a decrease of 3.7 percent. Of this total, $440,976,227 or 85.7 percent was derived from sale of mineral fuels and associated products, $72,052,368 or 14 percent was contributed by the nonmetals excluding mineral fuels, and $1,205,850 or 0.3 percent by the metals. Salt brine, cement, both natural and portland, coal, diatomaceous marl, LP gases, propane, sand and gravel, and stone were produced in greater quantity in 1958 than in the previous year, and the values of brine, carbon black, cement, coal, gypsum, marl, sand and gravel, stone, and vermiculite produced in 1598 were greater than those of the same minerals produced in 1957.
Only 3 of the 105 counties in Kansas reported no mineral production in 1958. Oil, gas, or both were produced in 78 counties, sand and gravel in at least 66 counties, and stone in 46 counties. In 1958, each of 54 counties produced minerals worth $1,000,000 or more. As in 1957, Barton County, with a production value of $35,293,535, continued to lead all others. Ellis County, with $34,177,827, was second, and Russell County, with $27,228,855 was third. Only seven of the counties producing $1,000,000 or more in mineral wealth in 1958 produced mainly nonfuel minerals, and six of these are in eastern Kansas. The counties that produced the greatest dollar value of minerals are those in which oil is found, mainly western Kansas counties. Counties that exploited the most different minerals were Barber, Bourbon, Cherokee, Cowley, Reno, Sedgwick, and Wilson. Most important minerals produced per dollar value were oil, natural gas, cement, stone, clay and clay products, salt, sand and gravel, natural gasoline, carbon black, coal, propane, and butane. This report gives the production and value of all minerals produced in the state in 1958 and compares them with 1957, and it also includes directories of mineral producers on record as of December 31, 1958.
For the third consecutive year, mineral production in Kansas in 1958 exceeded $500,000,000. Total value of all minerals produced in the state in 1958 was $514,234,445 or $19,858,640 less than in 1957, a decrease of 3.7 percent. Since 1932 Kansas has ranked among the first 10 states in the value of mineral commodities produced annually. Within the state 22 minerals are produced commercially; 5 others are available but currently are not exploited, at least 6 others are known to occur but have not been studied sufficiently to determine their commercial possibilities; at least 2 minerals are processed into useful mineral commodities from raw materials shipped into the state from outside sources. Table 1 presents data on mineral production in Kansas for 1957 and 1958, together with the rank of each mineral with respect to the other minerals produced in the state.
Table 1—Quantity and value of Kansas mineral production, by commodities, 1957 and 1958
| Commodity | Unit | 1957 | 1958 | 1958 Rank |
|||
|---|---|---|---|---|---|---|---|
| Quantity | Value ($) | Quantity | Value ($) | ||||
| Carbon black | Pound | 76,419,500 | 5,131,569 | 75,443,750 | 5,261,142 | 9 | |
| Cement (masonry) | 376-lb. bbl. | 313,706 | 1,221,292 | 320,270 | 1,204,594 | 13 | |
| Cement (natural) | 376-lb. bbl. | * | * | * | * | 20 | |
| Cement (portland) | 376-lb. bbl. | 7,863,624 | 23,593,482 | 9,298,427 | 28,843,139 | 3 | |
| Clay (raw) | Short ton | 908,693 | 1,239,789 | 875,441 | 1,144,983 | 14 | |
| Clay and clay products | Short ton | 10,000,000 | 10,500,000 | 5 | |||
| Coal | Short ton | 754,439 | 3,470,419 | 830,329 | 3,818,042 | 10 | |
| Diatomaceous marl | Short ton | * | * | * | * | 24 | |
| Gypsum (crude) | Short ton | * | * | * | * | 17 | |
| Helium—shipments | Cu. ft. | 36,743,000 | 569,517 | 27,888,000 | 432,264 | 19 | |
| Lead (recoverable content of ores) | Short ton | 4,257 | 1,217,502 | 1,299 | 303,966 | 21 | |
| Natural gas | M cu. ft. | 580,698,954 | 63,876,885 | 535,937,434 | 58,953,118 | 2 | |
| Natural gas liquids | |||||||
| Butane | 42-gal. bbl. | 1,004,614 | 2,461,304 | 993,269 | 1,539,567 | 12 | |
| Natural gasoline | 42-gal. bbl. | 2,820,738 | 7,108,260 | 2,600,607 | 6,007,402 | 8 | |
| LPG | 42-gal. bbl. | 296,131 | 728,428 | 404,027 | 626,242 | 18 | |
| Propane | 42-gal. bbl. | 1,202,764 | 2,958,799 | 1,363,436 | 2,113,326 | 11 | |
| Perlitea | Short ton | * | * | * | * | 23 | |
| Petroleum (crude) | 42-gal. bbl. | 124,054,043 | 380,845,912 | 119,942,094 | 362,225,124 | 1 | |
| Pumicite (volcanic ash) | Short ton | * | * | * | * | 25 | |
| Salt (brine) | Short ton | * | * | * | * | 16 | |
| Salt (common) | Short ton | 1,018,027 | 10,353,119 | 867,924 | 9,827,759 | 6 | |
| Sand and gravel | Short ton | 9,334,908 | 6,174,757 | 10,578,668 | 7,044,966 | 7 | |
| Sandstone (dimension) | Short ton | * | * | * | * | 25 | |
| Stone (limestone, sandstone, chat) | Short ton | 10,411,500c | 11,926,238c | 12,505,060 | 15,039,385 | 4 | |
| Vermiculitea | Short ton | * | * | * | * | 22 | |
| Zinc (recoverable content of ores, etc.) | Short ton | 15,859 | 3,679,288 | 4,421 | 901,884 | 15 | |
| * Undistributed | 1,300,691 | 2,056,660 | |||||
| Total value | $536,093,085b | $514,234,445b | |||||
| (a) Minerals processed but not mined in Kansas. (b) Totals adjusted to eliminate duplication in the value of clays and stone. (c) Excludes sandstone, value of which is included under "Undistributed." * Quantity and value of individual commodities cannot be revealed. |
|||||||
Minerals are widely distributed in the state; oil, gas, or both were produced in 78 counties, two fewer than in the previous year; sand and gravel were produced in at least 66 counties instead of 70 as in 1957, and stone in 46 counties instead of 43 as in 1957. Coal is currently being mined in 7 eastern counties, Labette County having produced no coal in 1958. Salt and gypsum known to underlie at least 40 central and southwestern counties are currently being produced in only 6 counties. Another salt producing county, Barton, will be added to the list in 1959.
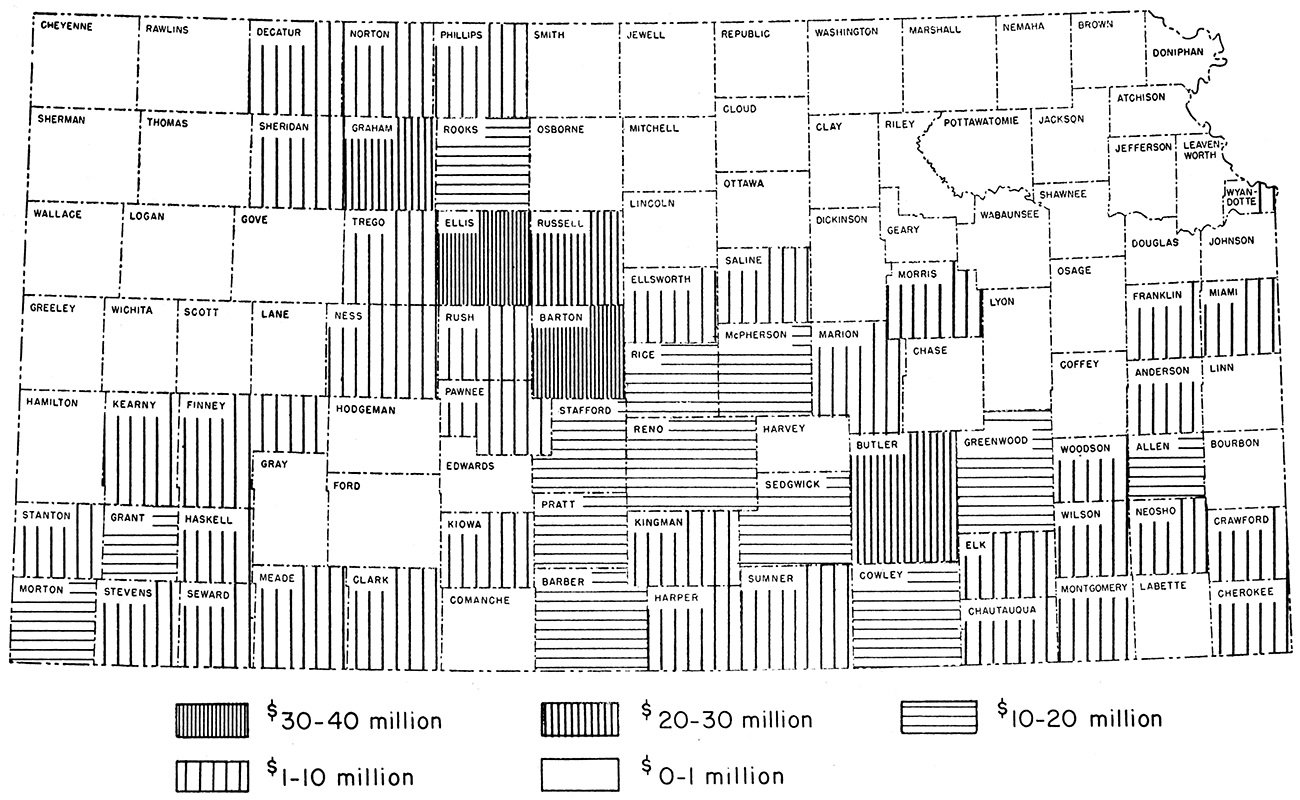
Of the 105 counties in Kansas, all but 3 (Greeley, Lane, and Mitchell) reported mineral production in 1958—the same as in 1957. In 1958, each of 54 counties, the same as in 1957, produced minerals worth $1,000,000 or more. Barton County, which produced minerals valued at $35,293,535 continued to lead. Ellis County ($34,177,827) was second, as in the previous year. Russell County ($27,228,855) again was third, and was followed by Butler County ($23,599,473) and Graham County ($20,698,863) in the $20,000,000 to $30,000,000 category. Counties each of which produced in 1958 mineral wealth valued between $10,000,000 and $20,000,000 were Greenwood, Rooks, Rice, Stafford, Grant, Cowley, Sedgwick, Barber, McPherson, Allen, Morton, Pratt, and Reno. Table 2 summarizes the range of value of the 1957 and 1958 mineral production per county.
Table 2—Range of value of 1957 and 1958 mineral production per county
| Value of annual production, millions of dollars |
Number of counties producing minerals valued in this range |
|
|---|---|---|
| 1957 | 1958 | |
| 40-50 | 1 | 0 |
| 30-40 | 1 | 2 |
| 20-30 | 4 | 3 |
| 10-20 | 12 | 13 |
| 1-10 | 36 | 36 |
| 0-1 | 48 | 48 |
| no production | 3 | 3 |
The counties that produced the greatest dollar value of minerals ($10,000,000 or more) are those in which oil is found. Most of these are western counties, but Allen, Butler, Cowley, and Greenwood, all eastern counties, are included. Seven of the 54 counties producing $1,000,000 or more in mineral wealth in 1958 produced mainly nonfuel minerals, and 6 of these are eastern counties, Allen, Cherokee, Montgomery, Neosho, Wilson, and Wyandotte; Reno is the only western county. Elk County's mineral wealth is about equally divided between fuel and nonfuel minerals. Counties that exploited the most different minerals were Sedgwick (seven minerals) and Barber, Bourbon, Cherokee, Cowley, Reno, and Wilson (six each); of these only Cherokee produced no oil (Figure 1). A summary evaluation of mineral fuels and nonfuel minerals for Kansas counties in 1958 is presented in Table 3 and Figure 2.
Figure 1—Map of Kansas showing mineral commodities produced in each county in 1958. Minerals are listed in order of value within counties. B—brine. C—cement. CB—carbon black. Cl—clay. Co—coal, Dm—diatomaceous marl. G—natural gas. Gp—gypsum. H—helium. LP—liquefied petroleum gases. NC—natural cement. NG—natural gasoline. O—oil. P—pumicite or volcanic ash, Ph—lead. Pe—perlite. S—Salt. SG—sand and gravel. St—stone. V—vermiculite. Zn—zinc.
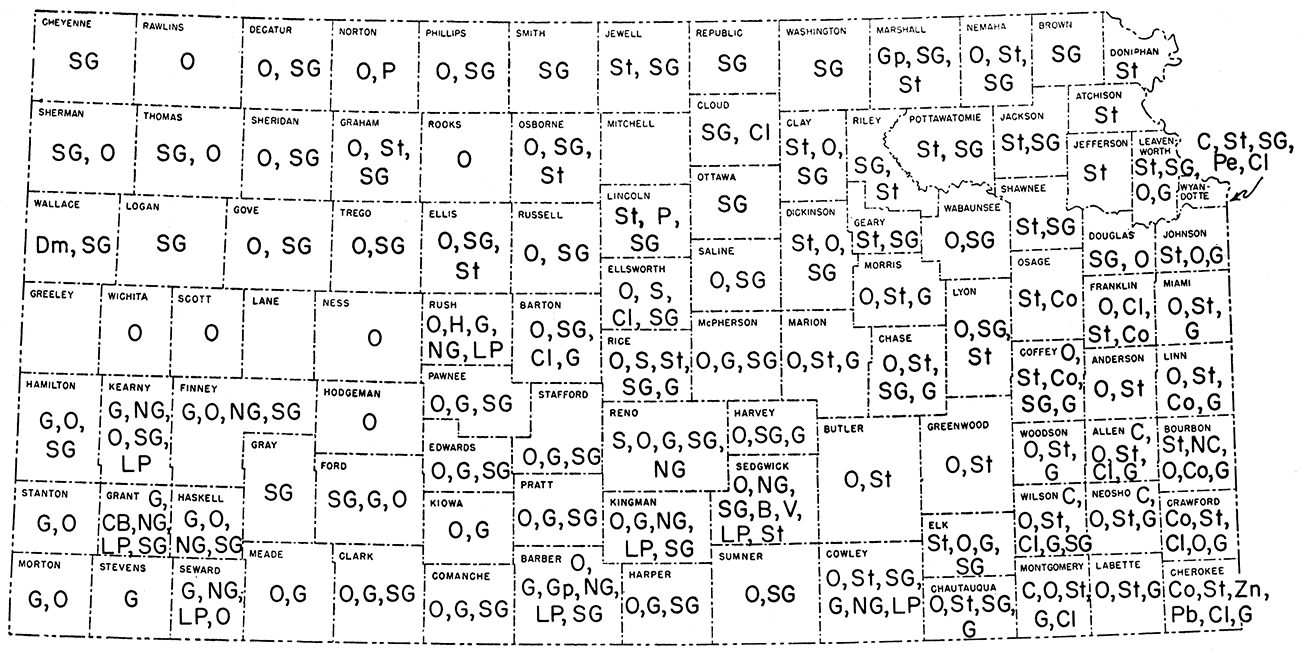
Table 3—Value of mineral production in Kansas by counties in 1958
| County | Value of mineral production | Commoditiesb in order of decreasing value |
||
|---|---|---|---|---|
| Fuelsb ($) |
Nonfuels ($) |
Total ($) |
||
| Allen | 2,922,076 | 9,163,134 | 12,085,210 | C, O, St, Cl, G |
| Anderson | 1,675,031 | * | * | O, St |
| Atchison | 428,196 | 428,196 | St | |
| Barber | 11,823,636 | * | * | O, G, Gp, NG, LP, SG |
| Barton | 34,911,188 | 407,147 | 35,318,335 | O, SG, Cl, G |
| Bourbon | 106,648 | 800,893 | 907,541 | St, NC, C, O, Co, G |
| Brown | 2,000 | 2,000 | SG | |
| Butler | 23,297,953 | 301,520 | 23,599,473 | O, St |
| Chase | 268,792 | 36,439 | 305,231 | O, St, SG, G |
| Chautauqua | 2,857,360 | 188,400 | 3,045,760 | O, St, SG, G |
| Cherokee | 2,434,512 | 1,623,725 | 4,058,237 | Co, St, Zn, Pb, Cl, G |
| Cheyenne | 53,238 | 53,238 | SG | |
| Clark | 1,481,507 | 25,909 | 1,507,416 | O, G, SG |
| Clay | 67,005 | 125,274 | 192,279 | St, O, SG |
| Cloud | 413,768 | 413,768 | SG, Cl | |
| Coffey | 384,458 | 63,182 | 447,640 | O, St, Co, SG, G |
| Comanche | 73,273 | 5,511 | 78,784 | O, G, SG |
| Cowley | 12,753,692 | 789,346 | 13,542,938 | O, St, SG, G, NG, LP |
| Crawford | 1,439,056 | 203,598 | 1,642,654 | Co, St, Cl, O, G |
| Decatur | 1,219,615 | 5,342 | 1,224,957 | O, SG |
| Dickinson | 299,243 | 498,970 | 798,213 | St, O, SG |
| Doniphan | 414,958 | 414,958 | St | |
| Douglas | 24,870 | * | * | SG, O |
| Edwards | 942,388 | * | * | O, G, SG |
| Elk | 837,327 | 1,049,817 | 1,887,144 | St, O, G, SG |
| Ellis | 34,171,203 | 8,873 | 34,180,076 | O, SG, St |
| Ellsworth | 6,403,904 | 942,838 | 7,346,742 | O, S, Cl, SG |
| Finney | 5,541,257 | 90,648 | 5,631,905 | G, O, NG, SG |
| Ford | 38,294 | 234,437 | 272,731 | SG, G, O |
| Franklin | 850,260 | 214,678 | 1,064,938 | O, Cl, St, Co |
| Geary | 435,574 | 435,574 | St, SG | |
| Gove | 57,084 | 28,298 | 85,382 | O, SG |
| Graham | 20,537,063 | 161,800 | 20,698,863 | O, St, SG |
| Grant | 17,824,280 | 5,900 | 17,830,180 | G, CB, NG, LP, SG |
| Gray | * | * | SG | |
| Greeley | ||||
| Greenwood | 19,529,491 | 80,280 | 19,609,771 | O, St |
| Hamilton | 485,164 | 21,975 | 507,139 | G, O, SG |
| Harper | 3,321,786 | * | * | O, G, SG |
| Harvey | 883,110 | * | * | O, SG, G |
| Haskell | 3,996,433 | 27,258 | 4,023,681 | G, O, NG, SG |
| Hodgeman | 796,413 | 796,413 | O | |
| Jackson | 139,918 | 139,918 | St, SG | |
| Jefferson | 593,587 | 593,587 | St | |
| Jewell | * | * | St, SG | |
| Johnson | 17,027 | 308,099 | 325,126 | St, O, G |
| Kearny | 7,690,461 | 33,073 | 7,723,534 | G, NG, O, SG, LP |
| Kingman | 9,582,250 | * | * | O, G, NG, LP, SG |
| Kiowa | 2,566,754 | 11,813 | 2,578,567 | O, G |
| Labette | 304,552 | * | * | O, St, G |
| Lane | ||||
| Leavenworth | 13,466 | 532,899 | 546,365 | St, SG, O, G |
| Lincoln | * | * | St, P | |
| Linn | 231,186 | 172,527 | 403,713 | O, St, Co, G |
| Logan | 281 | 281 | SG | |
| Lyon | 686,552 | 185,480 | 872,032 | O, SG, St |
| Marion | 7,850,664 | * | * | O, St, G |
| Marshall | 607,798 | 607,798 | Gp, SG, St | |
| McPherson | 12,194,885 | 3,238 | 12,198,123 | O, G, SG |
| Meade | 3,910,191 | 3,910,191 | O, G | |
| Miami | 1,567,410 | 201,773 | 1,769,183 | O, St, G |
| Mitchell | ||||
| Montgomery | 1,660,318 | 4,876,822 | 6,537,140 | C, O, St, G, Cl |
| Morris | 1,100,841 | 95,000 | 1,195,841 | O, St, G |
| Morton | 11,835,623 | 11,835,623 | G, O | |
| Nemaha | 41,450 | 31,270 | 72,720 | O, St, SG |
| Neosho | 1,707,043 | 6,162,884 | 7,869,927 | C, O, St, G |
| Ness | 1,701,015 | 1,701,015 | O | |
| Norton | 2,691,194 | * | * | O, P |
| Osage | 30,420 | 164,400 | 194,820 | St, Co |
| Osborne | 212,995 | 30,600 | 243,595 | O, SG, St |
| Ottawa | 18,842 | 18,842 | SG | |
| Pawnee | 7,372,576 | 84,597 | 7,457,173 | O, G, SG |
| Phillips | 5,781,781 | 135,755 | 5,917,536 | O, SG |
| Pottawatomie | 164,510 | 164,510 | St, SG | |
| Pratt | 11,530,154 | 37,570 | 11,567,724 | O, G, SG |
| Rawlins | 23,194 | 23,194 | O | |
| Reno | 3,512,258 | 7,969,837 | 11,482,095 | S, O, G, SG, NG, LP |
| Republic | * | * | SG | |
| Rice | 16,163,507 | 2,199,135 | 18,362,642 | O, S, St, SG, G |
| Riley | * | * | SG, St | |
| Rooks | 19,296,112 | 19,296,112 | O | |
| Rush | 2,435,123 | 2,435,123 | O, H, G, NG, LP | |
| Russell | 27,198,075 | 30,780 | 27,228,855 | O, SG |
| Saline | 1,737,406 | 291,920 | 2,029,326 | O, SG |
| Scott | 117,961 | 117,961 | O | |
| Sedgwick | 10,804,077 | 1,909,563 | 12,713,640 | O, NG, SG, B, V, LP, St |
| Seward | 4,552,804 | 4,552,804 | G, NG, LP, O | |
| Shawnee | 942,477 | 942,477 | St, SG | |
| Sheridan | 1,294,994 | 6,660 | 1,301,654 | O, SG |
| Sherman | 34,186 | 34,496 | 68,682 | SG, O |
| Smith | * | * | SG | |
| Stafford | 17,886,222 | 54,016 | 17,940,238 | O, G, SG |
| Stanton | 2,223,987 | 2,223,987 | G, O | |
| Stevens | 9,925,465 | 9,925,465 | G | |
| Sumner | 8,938,783 | * | * | O, SG |
| Thomas | 8,305 | 42,410 | 50,715 | SG, O |
| Trego | 5,668,452 | 4,679 | 5,673,131 | O, SG |
| Wabaunsee | 802,861 | 2,868 | 806,729 | O, SG |
| Wallace | * | * | Dm, SG | |
| Washington | 218,150 | 218,150 | SG | |
| Wichita | 2,422 | 2,422 | O | |
| Wilson | 615,817 | 5,814,445 | 6,430,262 | C, O, St, Cl, G, SG |
| Woodson | 2,511,793 | 112,349 | 2,624,142 | O, St, G |
| Wyandotte | 7,829,997 | 7,829,997 | C, St, SG, Pe, Cl | |
| Unassigned | 10,428,276 | 10,428,276 | Cl prod. | |
| Undistributed | 2,667,529 | 50,655,873 | ||
| Kansas total | 440,976,227c | 73,258,218 | 514,234,445c | |
| * Undistributed values may not be revealed. (a) The value of oil (fuels column) was computed on the average price of $3.02 per barrel (Table 1), even though it is realized that the price of oil varies with the gravity and that therefore the actual value of oil in any county may be greater or less than that computed. Likewise, the minimum price of 11 cents per 1000 cubic feet of natural gas measured at 14.65 psia (pounds per square inch absolute) established by the Kansas Corporation Commission for the Hugoton Gas Area effective January 1, 1954, but rescinded in 1958, has been applied to all Kansas gas production, including minor amounts of unprorated production, much of which probably brought a higher price. (b) Commodities: B, brine; C, cement; CB. carbon black; Cl, clay; Co, coal; DM, diatomaceous marl; G, natural gas; Gp, gypsum; H, helium; LP, liquefied petroleum gases; NC, natural cement; NG, natural gasoline; O, oil; P, pumicite (volcanic ash); Pb, lead; Pe, perlite; S, salt; SG, sand and gravel; St, stone; V, vermiculite; Zn, zinc. (c) Adjusted to eliminate duplication in value of oil. |
||||
Figure 2—Map of Kansas showing range of value of 1958 mineral production per county.
Much of the information compiled in this report was obtained from the tabulation sheets provided by the United States Bureau of Mines, with which the State Geological Survey of Kansas has been cooperating for many years in collecting mineral statistics for the state. Coal statistics were derived from the reports of Mr. John Delplace, Chief Mine Inspector of the Mine Inspection Section and Mine Rescue Station of the Kansas Labor Department at Pittsburg, Kansas. Data pertaining to petroleum and related products and natural gas were summarized from reports by Goebel and others on oil and gas developments in Kansas published as State Geological Survey Bulletins 133 and 138. Many of the data on oil and gas production in these bulletins were supplied by the Kansas Corporation Commission, Conservation Division. Other data (regarding expansion, modernization, and organization of new mineral producing companies) were obtained from Midwest Industry Magazine and Kansas!, the latter a publication of the Kansas Industrial Development Commission, Topeka.
The mineral fuels—coal, oil, natural gas, the natural gas liquids, and related products (helium and carbon black)—contributed, as in former years, the greatest share to the mineral wealth produced in Kansas. In 1958 they accounted for 85.7 percent of the total value ($440,976,227) as compared to 87.5 percent ($467,151,147) in 1957 (Table 4, Fig. 3).
Figure 3—Percent and value of mineral production in Kansas, 1958.
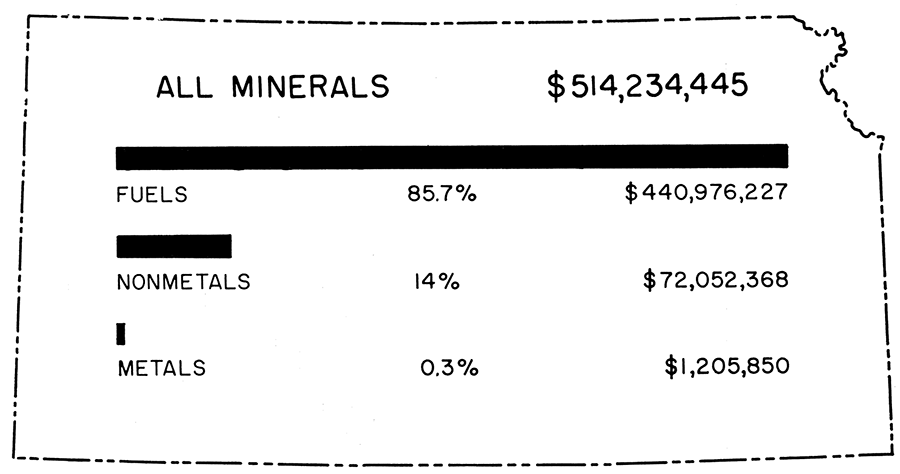
Table 4—Value of minerals produced in Kansas in 1957 and 1958
| Year | Mineral fuels and associated products |
Percent of total |
Nonmetals (excluding mineral fuels) |
Percent of total |
Metals | Percent of total |
All minerals |
|---|---|---|---|---|---|---|---|
| 1957 | $467,151,147 | 87.5 | $62,045,148 | 11.6 | $4,896,790 | 0.9 | $534,093,085 |
| 1958 | 440,976,227 | 85.7 | 72,052,368 | 14.0 | 1,205,850 | 0.3 | 514,234,445 |
Coal production in Kansas in 1958 was 830,009 tons valued at $3,818,042, an increase of 10.2 percent in tonnage and 10 percent in value compared to production and value in 1957. The estimated average price per ton in 1958 was $4.60, the same as in the previous year. Of the total quantity of coal mined in the state, 820,329 tons (98.8 percent) was mined by stripping and only 9,680 tons (1.2 percent) from shaft mines. In 1958, 31 mining companies operated a total of 29 mines in the state, of which 26 were strip mines and 3 shaft mines, whereas in 1957,32 mining companies operated a total of 34 mines in the state, of which 30 were strip mines and 4 were shaft mines. In 1958 Labette County produced no coal, reducing to seven the number of counties in the state where coal was mined. Of the seven, Cherokee County produced the most coal, followed by Crawford, Osage, Bourbon, Coffey, Linn, and Franklin. Cherokee County, from 5 strip mines, produced 529,185 tons or 63.7 percent of the total 830,009 tons mined in the state; Crawford County, from 10 strip and 2 shaft mines, accounted for 285,911 tons or 34.4 percent of the total. These two counties, therefore, produced 98.1 percent of all coal mined in Kansas.
Three companies, the Pittsburg-Midway, Clemens, and Apex-Compton, produced a total of 751,367 tons of coal or 90.5 percent of the state total. The Pittsburg-Midway Company produced more than half of all the coal mined in Kansas.
Table 5 gives data on Kansas coal production by type of mine and by county, value of coal, rank of counties, and number of mines in 1957 and 1958.
Table 5—Kansas coal production by type of mine and by county, value of coal, rank of counties, and number of mines, 1957 and 1958
| County | 1957 | 1958 | Rank | Number 1958 |
||||||||
|---|---|---|---|---|---|---|---|---|---|---|---|---|
| Production, short tons | Value ($) | Production, short tons | Value ($) | |||||||||
| Strip | Deep | Total | Strip | Deep | Total | 1957 | 1958 | Strip | Deep | |||
| Bourbon | 5,642 | 5,642 | 25,953 | 4,810 | 4,810 | 22,226 | 4 | 4 | 4 | |||
| Cherokee | 530,731 | 530,731 | 2,441,363 | 529,185 | 529,185 | 2,434,251 | 1 | 1 | 5 | |||
| Coffey | 2,445 | 2,445 | 11,427 | 2,138 | 2,138 | 9,935 | 5 | 5 | 1 | |||
| Crawford | 201,750 | 6,558 | 208,308 | 958,217 | 279,756 | 6,155 | 285,911 | 1,315,191 | 2 | 2 | 10 | 2 |
| Franklin | 536 | 536 | 2,466 | 195 | 195 | 897 | 6 | 7 | 1 | |||
| Labette | 111 | 111 | 511 | 8 | ||||||||
| Linn | 304 | 304 | 1,398 | 1,157 | 1,157 | 5,322 | 7 | 6 | 2 | |||
| Osage | 2,197 | 4,065 | 6,262 | 28,805 | 3,088 | 3,525 | 6,613 | 30,420 | 3 | 3 | 3 | 1 |
| All counties | 743,816 | 10,623 | 754,439 | 3,470,419 | 820,329 | 9,680 | 830,009 | 3,818,042 | 26 | 3 | ||
| Percent | 98.5 | 1.5 | 100 | 98.8 | 1.2 | 100 | ||||||
| Percent change from 1957 |
+10.2 | -8.9 | +10.1 | +10 | ||||||||
Measured and indicated coal reserves in Kansas at the end of 1958 are estimated at 1,116,200,000 tons, of which approximately 837,000,000 tons is believed to be recoverable coal.
The Pittsburg and Midway Coal Mining Company at Pittsburg, Crawford County, has moved into its new spacious headquarters at N. Fifth and N. Walnut Streets. The Davis Coal Company leased its strip mine to the Wilson Excavating Company. The Gerold McGrath Coal Company ceased operating its strip mine in Franklin County in the second quarter of the year, but this mine was put into operation again in the fourth quarter by Gilby & O'Dea Coal Company.
Coal companies operating in Kansas on record December 31, 1958, are listed in Table 6.
Table 6—Directory of Kansas coal mining companies on record as of December 13, 1958
| County | Coal company | Office address |
|---|---|---|
| Bourbon | Percy Deer | Fulton |
| Bourbon | Garrett | Route 2, Garland |
| Bourbon | McNeil | Route 2, Fort Scott |
| Bourbon | Pellett | Route 5, Fort Scott |
| Cherokee | Black Diamond | Weir |
| Cherokee | Markley | Route 2, McCune |
| Cherokee | Pittsburg-Midway | N. Fifth and N. Walnut Sts., Pittsburg |
| Cherokee | S&M | Route 1, Scammon |
| Cherokee | Wilkinson | Weir |
| Coffey | Rogers | Lebo |
| Crawford | Apex-Compton | P. O. Box 45, Monmouth |
| Crawford | Blue Ribbon | Girard |
| Crawford | Carr | Route 1, Mulberry |
| Crawford | Clemens | P.O. Box 299, Pittsburg |
| Crawford | Davis | Cherokee |
| Crawford | Gobl | Route 1, Mulberry |
| Crawford | Jones | Arcadia |
| Crawford | Lucky Star | 2024 S. Broadway, Pittsburg |
| Crawford | Mark | Route 1, Mulberry |
| Crawford | Palmer & Son | Mulberry |
| Crawford | Julia Weir | Croweburg |
| Crawford | Wisdom Excavating Co. | 805 N. Rouse St., Pittsburg |
| Crawford | Zibert | Route 3, Box 120, Girard |
| Franklin | McGrath-O'Dea | Homewood |
| Linn | Fyock | Prescott |
| Linn | Wood | Route 1, Pleasanton |
| Osage | Bell | Burlingame |
| Osage | Graham | Reading |
| Osage | Johnson | Scranton |
In 1958 Kansas produced 119,942,094 barrels of crude oil valued at $362,225,124, a decrease of 3.3 percent in production and of 4.9 percent in value compared to 1957 (Table 7). As in former years, Kansas maintained fifth rank among the oil producing states, and oil ranked first among the mineral commodities produced in the state.
Table 7—Petroleum or crude oil production in Kansas, 1957 and 1958
| Year | Production, bbl. |
Value | Price per bbl. |
|---|---|---|---|
| 1957 | 124,054,043 | $380,845,912 | $3.07 |
| 1958 | 119,942,094 | $362,225,124 | 3.02 |
| Percent change | -3.3 | -4.9 |
The number of counties actually reporting production was 76, one more than in 1957. Among the ten leading oil producing counties, Barton, Ellis, Russell, and Butler Counties maintained the first four places respectively, as in 1957; Graham County, which in 1957 ranked seventh, rose to fifth position, exchanging places with Rooks County (Table 8). Of the ten leading oil producing counties, Graham and Stafford showed slight increases in 1958 compared to 1957.
Table 8—Ten leading oil producing counties in Kansas, 1957 and 1958
| County | Production, bbl. | Rank | ||
|---|---|---|---|---|
| 1957 | 1958 | 1957 | 1958 | |
| Barton | 13,318,331 | 11,546,500 | 1 | 1 |
| Ellis | 11,783,161 | 11,314,968 | 2 | 2 |
| Russell | 9,300,056 | 9,005,985 | 3 | 3 |
| Butler | 8,059,156 | 7,714,554 | 4 | 4 |
| Graham | 6,728,517 | 6,800,352 | 7 | 5 |
| Greenwood | 6,977,957 | 6,466,719 | 6 | 6 |
| Rooks | 7,212,001 | 6,389,441 | 5 | 7 |
| Stafford | 5,855,899 | 5,887,005 | 8 | 8 |
| Rice | 5,359,253 | 5,314,385 | 9 | 9 |
| Cowley | 4,182,037 | 4,171,897 | 10 | 10 |
Fifteen counties (one more than in 1957, Table 9) have each produced a cumulative quantity of 50 million barrels or more since production first started. Of these counties, Butler, an eastern Kansas county, ranks first, having produced 429,587,001 barrels, 108,801,486 barrels more than second-place Barton County and 132,054,910 barrels more than Russell County, third in rank. Graham County (cumulative production of 50,555,688 barrels) was added to the list in 1958.
Table 9—Leading oil producing counties in Kansas based upon recorded and estimated cumulative production (50 million barrels or more) to the end of 1958
| County | Cumulative production, bbl. | Rank | ||
|---|---|---|---|---|
| 1957 | 1958 | 1957 | 1958 | |
| Butler | 421,872,447 | 429,587,001 | 1 | 1 |
| Barton | 309,234,420 | 320,785,515 | 2 | 2 |
| Russell | 288,526,106 | 297,532,091 | 3 | 3 |
| Greenwood | 216,575,650 | 223,042,369 | 4 | 4 |
| Rice | 215,874,697 | 221,189,082 | 5 | 5 |
| Ellis | 204,360,463 | 215,675,431 | 6 | 6 |
| McPherson | 140,584,533 | 144,568,785 | 7 | 7 |
| Stafford | 126,765,181 | 132,617,382 | 8 | 8 |
| Cowley | 92,316,235 | 96,488,132 | 9 | 9 |
| Ellsworth | 89,654,208 | 91,774,706 | 10 | 10 |
| Rooks | 74,281,841 | 80,471,282 | 11 | 11 |
| Sumner | 67,069,889 | 70,001,482 | 12 | 12 |
| Sedgwick | 64,496,251 | 67,726,683 | 13 | 13 |
| Reno | 61,930,531 | 62,893,875 | 14 | 14 |
| Graham | 50,555,688 | 15 | ||
Since records of oil production in the state have been kept, Kansas has produced, to the end of 1958, a recorded cumulative total of 3,010,881,094 barrels of crude oil valued at approximately $5,995,225,124.
Most of the larger oil fields are in western Kansas (Table 10). Of the six major oil fields, only the El Dorado field in Butler County lies east of the Sixth Principal Meridian, which is the division line between eastern and western Kansas insofar as oil and gas are concerned. Rating of the six leading oil fields remained the same in 1958 as in 1957 (Table 10).
Table 10—Leading oil fields in Kansas, 1957 and 1598
| Field | Rank | County | Annual production, bbl. | ||
|---|---|---|---|---|---|
| 1957 | 1958 | 1957 | 1958 | ||
| Bemis-Shutts | 1 | 1 | Ellis-Rooks | 5,922,087 | 5,062,516 |
| El Dorado | 2 | 2 | Butler | 4,619,047 | 4,370,959 |
| Trapp | 4 | 3 | Russell-Barton | 3,727,771 | 3,365,762 |
| Hall-Gurney | 5 | 4 | Russell-Barton | 3,542,500 | 3,295,576 |
| Chase-Silica | 3 | 5 | Rice, Barton, Stafford | 4,271,122 | 3,259,898 |
| Kraft-Prusa | 6 | 6 | Barton-Ellsworth | 3,436,752 | 3,092,206 |
In 1958, Kansas consumed 105,107,743 barrels of oil or 87.6 percent of its production. In 1957, consumption of oil in Kansas amounted to 84.7 percent of its production or 2.9 percent less than in 1958. Imports of oil in 1958 declined by 224,297 barrels (0.6 percent) whereas exports declined 4,339,104 barrels (7.6 percent). Total quantity of oil accounted for in 1958 was 157,837,906 barrels compared to 162,174,152 barrels in 1957. Data on production, consumption, imports, and exports, and total quantity of oil accounted for in 1957 and 1958 are listed in Table 11.
Table 11—Production, consumption, imports, and exports of crude oil in Kansas, 1957 and 1958. [Note: From Conservation Division, State Corporation Commission. ]
| Year | Production, bbl. |
Consumption | Imports, bbl. |
Exports, bbl. |
Total quantity, production plus imports, bbl. |
|
|---|---|---|---|---|---|---|
| Quantity, bbl. |
Percent of production |
|||||
| 1957 | 124,054,043 | 105,104,885 | 84.7 | 38,120,109 | 57,069,267 | 162,174,152 |
| 1958 | 119,942,094 | 105,107,743 | 87.6 | 37,895,812 | 52,730,163 | 157,837,906 |
Crude oil reserves in 1958 are estimated at 922.4 million barrels or 25.1 million barrels (2.6 percent) less than in 1957 (Table 12). In 1958, 141 new oil fields were discovered, 5 of which produced both oil and gas. In addition, 8 abandoned oil fields were revived. Counties in which new oil fields were discovered in 1958 are listed in Table 13.
Table 12—Total crude oil reserves and oil fields discovered and revived in Kansas, 1957 and 1958 (American Petroleum Institute, 1957 and 1958)
| Year | Million bbl. | Percent change from 1957 |
Oil fields | Total | |
|---|---|---|---|---|---|
| Discovered | Revived | ||||
| 1957 | 947.5 | 154a | 4 | 158 | |
| 1958 | 922.4 | -2.6 | 141a | 8 | 149 |
| (a) Five fields produced both oil and gas. | |||||
Table 13—Number of oil and gas fields discovered and number of fields revived, by county, in 1958
| County | New | Dry and abandoned |
Revived | Total | |||
|---|---|---|---|---|---|---|---|
| Oil | Gas | Oil and gas |
Oil | Gas | |||
| Barber | 2 | 1 | 1 | 4 | |||
| Barton | 7 | 1 | 2 | 10 | |||
| Butler | 8 | 1 | 9 | ||||
| Cheyenne | 1 | 1 | |||||
| Comanche | 1 | 1 | |||||
| Cowley | 7 | 1 | 1 | 9 | |||
| Edwards | 5 | 1 | 6 | ||||
| Ellis | 9 | 1 | 10 | ||||
| Graham | 20 | 1 | 21 | ||||
| Grant | 1 | 1 | |||||
| Greenwood | 2 | 2 | |||||
| Hamilton | 1 | 1 | |||||
| Harper | 2 | 1 | 1 | 4 | |||
| Harvey | 3 | 3 | |||||
| Haskell | 3 | 3 | |||||
| Hodgeman | 1 | 1 | |||||
| Kingman | 1 | 1 | 2 | ||||
| Kiowa | 1 | 2 | 3 | ||||
| McPherson | 3 | 1 | 1 | 5 | |||
| Marion | 2 | 1 | 3 | ||||
| Meade | 1 | 1 | |||||
| Montgomery | 1 | 1 | |||||
| Morton | 1 | 1 | |||||
| Ness | 3 | 3 | |||||
| Norton | 2 | 2 | |||||
| Pawnee | 3 | 1 | 2 | 6 | |||
| Pratt | 1 | 2 | 3 | ||||
| Rawlins | 2 | 2 | |||||
| Reno | 1 | 1 | |||||
| Rice | 2 | 2 | |||||
| Rooks | 7 | 7 | |||||
| Rush | 1 | 1 | |||||
| Russell | 3 | 1 | 4 | ||||
| Saline | 1 | 1 | |||||
| Sedgwick | 2 | 2 | |||||
| Seward | 2 | 1 | 3 | ||||
| Sheridan | 1 | 1 | |||||
| Sherman | 1 | 1 | |||||
| Stafford | 5 | 1 | 1 | 1 | 8 | ||
| Stanton | 1 | 1 | |||||
| Stevens | 1 | 1 | |||||
| Sumner | 10 | 1 | 11 | ||||
| Trego | 3 | 1 | 4 | ||||
| Wabaunsee | 1 | 1 | |||||
| Total | 125 | 16 | 5 | 11 | 8 | 2 | 167 |
During 1958 the Jayhawk Pipeline Corporation, owned by the Colorado Oil and Gas Corporation and the National Cooperative Refinery Association, completed 197 miles of 12-inch pipeline for crude oil from Meade, Meade County, to McPherson, McPherson County, and 42 miles of 10-inch pipe from McPherson to Valley Center, Sedgwick County. The line transmits crude oil to the Derby Refining Company of Valley Center and to the National Cooperative Refinery Association at McPherson. The El Dorado Refining Company, El Dorado, Butler County, was purchased by the American Petrofina Company of Texas who added a new platformer later in the year. Alkylation units were either planned or under construction at several refineries including Skelly Oil Company's refinery at El Dorado, Derby Refinery at Wichita, Cooperative Refining Association's refinery at Coffeyville, and Anderson-Prichard Oil Corporation's refinery at Arkansas City. Standard Oil Company constructed a new ultraforming unit at its Neodesha refinery, where 6,000 barrels of naphtha per day will be processed.
A new propane and de-asphalting unit was put into operation at the Anderson-Prichard Oil Corporation's refinery at Arkansas City. This unit has a capacity of 1,200 barrels daily. At Potwin, Vickers Petroleum Company, Inc., built the first petrochemical plant to produce aromatics in the Midcontinent area. In addition to benzene, the plant will produce toluene, xylene, and solvent V-100, a Vickers aromatic solvent. The Mid-America Refining Company, Inc., added 15,000 barrels per day to crude capacity and 400 barrels per day to asphalt capacity at its refinery at Chanute. The Consumers Cooperative Association refinery at Phillipsburg, Phillips County, added a new unifier and platformer and compressor and control buildings to its plant, which now has a capacity of 12,000 barrels per day of crude oil. The Kansas exploration and production offices of the Pan American Petroleum Corporation currently located at Wichita will be moved to Liberal.
Many major oil companies operate in Kansas, as do numerous independent oil companies and operators whose number changes from year to year. For this reason no directory of oil companies is included in this report. [Note: For the names of oil companies, independent operators, and consulting geologists, see the Kansas Geological Society Directory published by the Society at 508 East Murdock Street, Wichita 5, Kansas, and Morrison Petroleum Directory of Kansas published annually by John H. Morrison, Box 191, Wichita, Kansas.]
A directory of refineries is given in Table 14, because the number of oil refineries is less variable than the number of oil companies.
Table 14—Directory of petroleum refineries in Kansas as of December 31, 1958
| Refinery | Office address | County |
|---|---|---|
| American Petrofina Co. of Texas | El Dorado | Butler |
| Anderson-Prichard Oil Corp | Arkansas City | Cowley |
| Century Refining Co., Inc.a | 114 W. Pine, Garden City | Finney |
| Chanute Refining Co. | P. O. Box 431, Chanute | Neosho |
| Cooperative Refinery Assn. | Coffeyville | Montgomery |
| Cooperative Refinery Assn. | P. O. Box 570, Phillipsburg | Phillips |
| Derby Refining Co. | 420 W. Douglas, Wichita | Sedgwick |
| Mid-America Refining Co., Inc. | Chanute | Neosho |
| Mobil Oil Co. | Augusta | Butler |
| National Cooperative Refinery Assn. | P. O. Box 770, McPherson | McPherson |
| Phillips Petroleum Co. | 2029 Fairfax Trafficway, Kansas City | Wyandotte |
| Skelly Oil Co. | 1401 S. Douglas Road, El Dorado | Butler |
| Standard Oil Co. (Indiana) | 1101 Illinois, Neodesha | Wilson |
| Vickers Petroleum Co., Inc. | Wichitab | Sedgwick |
| (a) Successor to Shallow Water Refining Company, refinery at Shallow Water, Scott County. (b) Refinery at Potwin, Butler County. |
||
Nationwide, Kansas ranks fifth as a producer of natural gas, second most valuable mineral produced in the state. In 1958, Kansas produced 535,937,434 thousand cubic feet of gas, 44,761,520 thousand cubic feet (7.7 percent) less than in 1957. Natural gas produced in the state in 1958 was valued at $58,953,118 as compared to $63,876,885 in 1957, a decrease of 7.7 percent (Table 15). Cumulative natural gas production in Kansas from the first recorded production to the end of 1958 is estimated at 5,532,603,292 thousand cubic feet.
Table 15—Natural gas production in Kansas, 1957 and 1958
| Year | Production, M cu. ft. (14.65 psia) |
Value | Price, cents per M cu. ft. |
|---|---|---|---|
| 1957 | 580,698,954 | $63,876,885 | 11 |
| 1958 | 535,937,434 | $58,953,118 | 11 |
| Percent change from 1957 | -7.7 | -7.7 |
Of the total amount of gas produced in 1958 in the state, 349,263,723 thousand cubic feet (65 percent) came from the Hugoton Gas Area comprising all or part of Finney, Grant, Hamilton, Haskell, Kearny, Morton, Seward, Stanton, and Stevens Counties, in southwestern Kansas (Table 16). Natural gas was produced in 49 counties in 1958, one fewer than in 1957. Nineteen counties, one more than in 1957 (Table 17), produced 2 billion cubic feet of gas or more in 1958. Counties added to this category in 1958 include Reno, 14th in rank, and Edwards, 19th. Cowley County, which was added in 1957 when it produced 2,630,410 thousand cubic feet of gas and ranked 17th, produced less than 2 billion cubic feet of gas in 1958. Among the 19 leading gas producing counties, the first 11 on the list in 1957 maintained their position in 1958. Clark County, 15th in 1957, rose to 12th position in 1958, replacing Hamilton County, which dropped to 13th place. Reno County, added in 1958, replaced Kiowa County in 14th position, Kiowa County becoming 18th in rank. Pawnee County, 13th in 1957, dropped to 17th position in 1958, and Harper County, 18th in 1957, rose to 15th in rank.
Table 16—Production of natural gas in Hugoton Gas Area, Kansas, 1957 and 1958
| Year | Production, M cu. ft. (14.65 psia) |
Value | Percent of state total production |
Cumulative production, M cu. ft. |
|---|---|---|---|---|
| 1957 | 396,889,199 | $43,657,812 | 68.3 | 4,260,453,506 |
| 1958 | 349,263,723 | $38,419,009 | 65.0 | 4,609,717,289 |
| Percent change from 1957 |
-12 | -12 |
Table 17—Production of natural gas in Kansas counties producing 2 billion cubic feet or more annually, 1957 and 1958
| County | Production, M cu. ft. (14.65 psia) |
Rank | ||
|---|---|---|---|---|
| 1957 | 1958 | 1957 | 1958 | |
| Stevensa | 105,873,672 | 90,231,496 | 1 | 1 |
| Mortona, b | 97,495,814 | 84,762,672 | 2 | 2 |
| Granta | 78,728,061 | 76,951,008 | 3 | 3 |
| Kearnya | 62,972,766 | 62,477,345 | 4 | 4 |
| Barber | 53,465,524 | 51,428,484 | 5 | 5 |
| Finneya | 43,897,674 | 36,885,767 | 6 | 6 |
| Haskella | 32,302,065 | 23,456,900 | 7 | 7 |
| Sewarda, b | 29,880,750 | 24,421,166 | 8 | 8 |
| Stantona | 20,143,455 | 19,944,619 | 9 | 9 |
| Meade | 11,058,197 | 10,295,596 | 10 | 10 |
| Kingman | 10,081,383 | 11,686,453 | 11 | 11 |
| Clark | 3,147,851 | 6,536,692 | 15 | 12 |
| Hamiltona | 4,023,123 | 4,228,915 | 12 | 13 |
| Reno | 3,578,905 | 14 | ||
| Harper | 2,030,168 | 2,977,950 | 18 | 15 |
| Rush | 2,823,194 | 2,632,657 | 16 | 16 |
| Pawnee | 3,352,053 | 2,607,146 | 13 | 17 |
| Kiowa | 3,249,342 | 2,090,043 | 14 | 18 |
| Edwards | 2,038,145 | 19 | ||
| Cowley | 2,630,410 | 17 | ||
| (a) Hugoton Gas Area counties. (b) Not all gas produced in Morton and Seward Counties is from the Hugoton Gas Area. |
||||
On the basis of cumulative production of natural gas of 10 billion cubic feet or more to the end of 1958, one more county, Clark, 17th in rank, was added to the list of the previous year (Table 18). Several changes in rank are to be noted. Meade County, 12th in rank in 1957, advanced to 10th, replacing Pawnee County, which dropped to 11th place; Kingman County rose from 14th in 1957 to 12th in 1958; Rice County, 11th in 1957, was 13th in 1958; Hamilton County dropped from 13th place to 14th; Stafford, 17th in 1957, was replaced by Clark; and Edwards County became 19th among the leading gas producing counties based on cumulative production of 10 billion cubic feet of gas or more to the end of 1958. Although complete production records are not available or are nonexistent, it is certain from the records that are extant that four eastern counties, Allen, Cowley, Montgomery, and Wilson, have each produced 10 billion cubic feet of gas or more since production started. Table 18 shows the cumulative gas production and rank of the leading Kansas counties.
Table 18—Leading gas producing counties in Kansas based on estimated and recorded cumulative production of 10 billion cu. ft. of gas or more to end of 1958*
| County | Cumulative production, M cu. ft. (14.65 psia) |
Rank | |
|---|---|---|---|
| 1957 | 1958 | ||
| Stevensa | 1,674,871,788 | 1 | 1 |
| Granta | 930,072,169 | 2 | 2 |
| Kearnya | 656,482,839 | 3 | 3 |
| Mortona, b | 524,050,653 | 4 | 4 |
| Barber | 396,903,995 | 5 | 5 |
| Haskella | 338,298,624 | 6 | 6 |
| Finneya | 332,788,894 | 7 | 7 |
| Sewarda, b | 267,438,410 | 8 | 8 |
| Stantona | 147,313,588 | 9 | 9 |
| Meade | 38,806,058 | 12 | 10 |
| Pawnee | 37,801,822 | 10 | 11 |
| Kingman | 35,424,181 | 14 | 12 |
| Rice | 34,963,624 | 11 | 13 |
| Hamiltona | 30,531,419 | 13 | 14 |
| Barton | 23,299,947 | 15 | 15 |
| Pratt | 20,572,575 | 16 | 16 |
| Clark | 12,875,849 | 17 | |
| Stafford | 12,788,788 | 17 | 18 |
| Edwards | 12,383,990 | 18 | 19 |
| (a) Hugoton Gas Area counties. (b) Not all gas produced in Morton and Seward Counties is from the Hugoton Gas Area. * Several eastern Kansas counties, although no longer important gas producers, formerly yielded great quantities of gas. Published cumulative production data on gas production for eastern counties are not available. It is reasonably certain, however, from data that are extant, that Allen, Cowley, Montgomery, and Wilson Counties have each produced 10 billion cubic feet of gas or more. |
|||
The reserves of natural gas in 1958, estimated at 20,233,847 million cubic feet, exceeded those of 1957 by 937,869 million cubic feet or 4.9 percent (Table 19). Twenty-one new gas fields (16 gas and 5 gas and oil fields) were discovered in 1958, 4 fewer than in the previous year. Two gas fields were revived (Table 13).
Table 19—Natural gas reserves and gas fields discovered and revived in Kansas, 1957 and 1958
| Year | Reserves, million cu. ft. |
Percent change from previous year |
Gas fields discovered |
Gas fields revived |
Total |
|---|---|---|---|---|---|
| 1957 | 19,295,978 | 26a | 1 | 27 | |
| 1958 | 20,233,847 | +4.9 | 21a | 2 | 23 |
| (a) Five fields produced both gas and oil. | |||||
Cities Service Gas Company is planning to build and operate 105 miles of natural gas pipeline in Montgomery, Allen, Anderson, Franklin, Miami, Johnson, and Wilson Counties in Kansas. Plans also call for development of the Elk City storage field in Montgomery County. Cost of the project is estimated at $10,000,000.
Production of natural gas liquids, consisting of natural gasoline, propane, butane, and other miscellaneous liquefied gases, increased by 0.7 percent but value declined by 22.6 percent in 1958. In 1957 the total quantity of natural gas liquids amounted to 5,324,247 bbl. worth $13,256,845, whereas in 1958 production was 5,361,339 bbl. worth $10,286,537 (Table 20). In 1958 natural gasoline and butane production was less than in 1957 whereas propane and other LP gases showed increased production. The estimated average price per barrel of natural gasoline in 1958 was $2.31, which is 21 cents less than in 1957. All other natural gas liquids were computed at an average of $1.55 in 1958, which is 90 cents less than in the previous year.
Table 20—Production and value of liquefied petroleum gas (LPG) in Kansas, 1957 and 1958
| 1957 | 1958 | |||
|---|---|---|---|---|
| Quantity, bbl. | Valuea | Quantity, bbl. | Valueb | |
| Natural gasoline | 2,820,738 | $ 7,108,260 | 2,600,607 | $ 6,007,402 |
| Propane | 1,202,764 | $ 2,958,799 | 1,363,436 | $ 2,113,326 |
| Butane | 1,004,614 | $ 2,461,304 | 993,269 | $ 1,539,567 |
| Other LPG | 296,131 | $ 728,482 | 404,027 | $ 626,242 |
| All liquid petroleum gases | 5,324,247 | $13,256,845 | 5,361,339 | $10,286,537 |
| Percent change from 1957 | +0.7 | -22.6 | ||
| (a) Estimated average price $2.52 per barrel for natural gasoline, all others $2.45. (b) Estimated average price $2.31 per barrel for natural gasoline, all others $1.55. |
||||
Proved reserves of natural gas liquids, 199,552,000 bbl., were 5.5 percent greater than in 1957, when the estimated reserves were 189,155,000 bbl.
Tuloma Gas Products Company, nationwide marketer of LP fuels, is planning construction of an underground saltbed storage facility for liquefied petroleum gas products about 5 miles south of Hutchinson, Reno County. According to plans, two caverns will be created in the salt beds at a depth of 550 to 800 feet below the surface. Potential capacity is estimated at nearly 35,000,000 gallons.
Natural gasoline and liquefied petroleum gas were produced by 12 companies in 16 plants located in 11 counties. Plants on record as of December 31, 1958, are listed in Table 21.
Table 21—Directory of Kansas plants producing natural gasoline and liquefied petroleum gas on record as of December 31, 1958
| Plant location | Company | |
|---|---|---|
| County | Town | |
| Barber | Medicine Lodge | Skelly Oil Company |
| Cowley | Atlanta | The Texas Company |
| Finney | Holcomb | Northern Natural Gas Company |
| Grant | Ulysses | Hugoton Production Company |
| Grant | Ulysses | Magnolia Petroleum Company |
| Grant | Ulysses | Pan American Petroleum Corp. |
| Haskell | Sublette | Northern Natural Gas Company |
| Kearny | Deerfield | Kansas-Nebraska Natural Gas Company |
| Kearny | Lakin | Colorado Interstate Gas Company |
| Kingman | Cunningham* | Skelly Oil Company |
| Kingman | Spivey | Magnolia Petroleum Company |
| Reno | Burrton | Cities Service Oil Company |
| Rush | Otis | Dunn-Mar Oil & Gas Company |
| Sedgwick | Cheney | Plateau Natural Gas Company |
| Sedgwick | Wichita | Cities Service Oil Company |
| Seward | Liberal | Panhandle Eastern Pipe Line Company |
| * Gasoline plant discontinued May 1, 1958. | ||
For the third consecutive year, Kansas helium production, shipments, and value have declined. Production of helium in 1958 was 25,858,000 cubic feet whereas in 1957 it was 37,249,000 cubic feet. Shipments of helium in 1958 amounted to 27,888,000 cubic feet valued at $432,264, a decrease in quantity and value of 24.1 percent compared to 1957. Production and price are controlled by the Federal Government. Federal agencies pay $15.50 per 1000 cu. ft. at the production plants. Other users pay $19.00 at the plant and an additional $2.00 per thousand cu. ft. for helium supplied in standard cylinders. The Kansas helium was produced at the United States Bureau of Mines plant at Otis, Rush County. The gas is extracted from helium-bearing natural gas from about 80 wells distributed in Barton, Pawnee, and Rush Counties. Helium-contributing gas fields include the Otis-Albert field in Rush and Barton Counties, the Ryan field in Rush and Pawnee Counties, the Pawnee Rock and Ash Creek fields in Pawnee County, and the Behrens, Unruh, Dundee, and Bergtal fields in Barton County.
In 1958 Kansas produced 75,443,750 pounds of carbon black, 975,750 pounds (1.3 percent) less than in 1957. The 1958 product was worth $5,261,142 whereas 1957 production was valued at $5,131,569, an increase of 2.5 percent (Table 22). Carbon black ranked ninth in value among the mineral commodities produced in the state.
Table 22—Quantity and value of carbon black produced in Kansas in 1957 and 1958
| Year | Quantity, lb. | Value | Estimated gas consumed, billion cu. ft. (at 14.65 psia ) |
|---|---|---|---|
| 1957 | 76,419,500 | $5,131,569 | 5.67 |
| 1958 | 75,443,750 | $5,261,142 | 3.26 |
| Percent change from 1957 |
-1.3 | +2.5 |
The value of the 1958 production of nonmetallic minerals exclusive of mineral fuels and associated products (cement, clay, diatomaceous marl, gypsum, pumicite or volcanic ash, salt, sand and gravel, stone, and perlite and vermiculite products) was $72,052,368 or 14 percent of the total value of all minerals produced in the state (Table 4, Fig. 3).
Cement production, shipments, and value in 1958 exceeded those of 1957. Total production and total shipments of cement, excluding natural cement, in Kansas in 1958 were 9,537,119 bbl. and 9,600,637 bbl. respectively, whereas in 1957 total cement production amounted to 8,423,003 bbl. and total shipments to 8,177 ,330 bbl. The increases in total production and shipments in 1958 were 13.2 and 17.4 percent respectively. The value of shipments in 1958 was $30,047,733 or $5,232,959 (21 percent) more than in the previous year when it amounted to $24,814,774. Production of portland cement in 1958 exceeded production in 1957 by more than 1,000,000 bbl. or by 13.8 percent. Shipments of portland cement in 1958 exceeded 1957 shipments by 18.2 percent in quantity and 22.2 percent in value. Quantity and value of portland cement shipped in 1958 were respectively 9,298,427 bbl. and $28,843,139, whereas in 1957 the amount shipped was 7,863,624 bbl. worth $23,593,482. The average price of portland cement in 1958 was $3.10 compared to $3.00 in the previous year, an increase of 3.3 percent. Kansas produced 292,935 bbl. of masonry cement in 1958 or 4 percent less than in 1957. Shipments and value of masonry cement were less than in 1957 by 3.7 and 7.8 percent respectively. The average price of masonry cement in 1958 was $3.99 as compared to $3.89 in the previous year, a gain of 2.5 percent. Data on production, shipments, and value of portland, masonry, and total cement are presented in Table 23.
Table 23—Production and shipments of portland and masonry cement in Kansas in 1957 and 1958, 376-lb. bbl.
| Commodity | Production, bbl. | Shipments | ||||
|---|---|---|---|---|---|---|
| 1957 | 1958 | |||||
| 1957 | 1958 | Bbl. | Value | Bbl. | Value | |
| Portland | 8,117,799 | 9,244,184 | 7,863,624 | $23,593,482 | 9,298,427 | $28,843,139 |
| Ave. price/bbl. | 3.00 | 3.10 | ||||
| Percent change from 1957 | +13.8 | +18.2 | +22.2 | |||
| Masonry | 305,204 | 292,935 | 313,706 | $1,221,292 | 302,270 | $1,204,594 |
| Ave. price/bbl. | 3.89 | 3.99 | ||||
| Percent change from 1957 | -4 | -3.7 | -7.8 | |||
| Total | 8,423,003 | 9,537,119 | 8,177,330 | $24,814,774 | 9,600,697 | $30,047,733 |
| Percent change from 1957 | +13.2 | +17.4 | +21 | |||
Allen County, which includes two of the seven cement plants in the state, led in production and shipments again. Neosho County was second, followed by Wilson, Montgomery, Wyandotte, and Bourbon Counties. Stocks on hand at yearend were 924,708 bbl. or 309 percent more than in 1957. One company, the Fort Scott Hydraulic Cement Company, Fort Scott, Bourbon County, produced natural cement. Its production is included under "Undistributed" minerals in Table 1. Natural cement is discussed [later].
Kansas cement is exported to Arkansas, Illinois, Iowa, Minnesota, Missouri, Nebraska, Oklahoma, South Dakota, Texas, Wyoming, and several foreign countries. Cement is third in importance among the minerals produced in the state.
The seven cement producers on record as of December 31, 1958, are listed in Table 24.
Table 24—Directory of cement producers in Kansas, 1958
| County | Company | Office address | Quarry | Type |
|---|---|---|---|---|
| Allen | Lehigh Portland Cement Co. | Young Bldg., 718 Hamilton St., Allentown, Pennsylvania |
Iola | Portland and masonry |
| Allen | Monarch Cement Co. | Humboldt | Humboldt | Portland and masonry |
| Bourbon | Fort Scott Hydraulic Cement Co. | P. O. Box 267, Fort Scott | Fort Scott | Natural and masonry |
| Montgomery | Universal Atlas Cement Co. | 100 Park Ave., New York 17, New York |
Independence | Portland and masonry |
| Neosho | Ash Grove Lime & Portland Cement Co. |
101 W. 11th, Kansas City 6, Mo. | Chanute | Portland and masonry |
| Wilson | Consolidated Cement Corp. | Fredonia | Fredonia | Portland and masonry |
| Wyandotte | Lone Star Cement Corp. | 1006 Grand Ave., Kansas City 6, Missouri |
Bonner Springs | Portland and masonry |
Clay and shale production in Kansas in 1958 continued the decline indicated in 1957. Total quantity of clay and shale produced was 875,441 tons compared to 908,693 tons in 1957, a decrease of 3.7 percent. The value of the 1958 production was $1,144,983 or 7.7 percent less them in the previous year, when it was $1,239,789 (Table 25). Kansas clay and shale produced consists of fire clay and miscellaneous clay (including shale used for cement), the former being produced in Barton, Cloud, Crawford, Franklin, Jewell, Montgomery, Wilson, and Wyandotte Counties. Fire clay production in 1958 declined 20.8 percent in quantity and 20.2 percent in value from 1957 whereas production and value of miscellaneous clay exceeded the 1957 production and value by 7 percent.
Table 25—Clay and shale sold or used by producers in Kansas, 1957 and 1958
| Year | Brick, tile, lightweight aggregate |
Cement | Total | Clay and clay products |
|||
|---|---|---|---|---|---|---|---|
| Tons | Value | Tons | Value | Tons | Value | ||
| 1957 | 595,536 | $926,632 | 313,157 | $313,157 | 908,693 | $1,239,789 | $10,000,000 |
| 1958 | 510,853 | $780,395 | 364,588 | $364,588 | 875,441 | $1,144,983 | $10,500,000 |
| Percent change from 1957 |
-14.3 | -15.8 | +16.4 | +16.4 | -3.7 | -7.7 | |
Clay used for cement in 1958 amounted to 364,588 tons, or 51,431 tons (16.4 percent) more than in 1957. In 1958, nine companies operating in 10 counties produced clay or shale. Disregarding clay used for cement, Barton, Crawford, and Cloud Counties led in 1958. Kansas clay and shale is used primarily for the manufacture of brick (of which 110,910,000 were produced in 1958 or 10,271,000 more than in 1957), tile, cement, and lightweight aggregate. Raw clay and shale ranked 14th among mineral commodities produced in 1958 and 5th if clay products are included.
The Ludowici-Celadon Company near Coffeyville, Montgomery County, has sold its property and ceased production. The Kansas Brick and Tile Company has announced a $10,000 expansion program at its Hoisington plant in Barton County. New machinery is to be installed in order to increase production. The Acme Brick Company, successor to the Great Bend Brick and Tile Company, has announced that its newly acquired Great Bend-Kanopolis plant will be expanded to manufacture tile and other products as well as bricks.
Reserves of clay and shale are almost without limit. In central and north-central Kansas, where the most valuable clays in the state are found, reserves of strippable high-grade clays are estimated to be at least 125 billion tons.
A directory of clay and shale producers in Kansas in 1958 is given in Table 26.
Table 26—Directory of clay and shale producers in Kansas in 1958
| County | Company | Office address | Pit location | Type plant* |
|---|---|---|---|---|
| Allen | Humboldt Shale Mining Co. | P. O. Drawer 97, Humboldt | Humboldt | B |
| Allen | Lehigh Portland Cement Co. | Young Bldg., 718 Hamilton St., Allentown, Pa. | Iola | C |
| Allen | Monarch Cement Co. | Humboldt | Humboldt | C |
| Allen | United Brick & Tile Co. | 207 Pickwick Bldg., Kansas City 42, Mo. | Iola | B |
| Barton | Acme Brick Co. | P. O. Box 425, Fort Worth, Texas | Great Bend | B |
| Barton | Kansas Brick & Tile Co. | Hoisington | Hoisington | B |
| Cherokee | United Brick & Tile Co. | 207 Pickwick Bldg., Kansas City 42, Mo. | Weir | B |
| Cloud | Cloud Ceramics | Concordia | Concordia | B |
| Crawford | W. S. Dickey Clay Mfg. Co. | 607-617 Commerce Trust Bldg., Kansas City 6, Mo. | Pittsburg | B |
| Ellsworth | Acme Brick Company | P. O. Box 425, Fort Worth, Texas | Kanopolis | B |
| Franklin | Buildex, Inc. | P. O. Box 299, Pittsburg | Ottawa | A |
| Jewell | Ideal Cement Co. | 507 Denver Nat'l Bank Bldg., Denver, Colo. | C | |
| Montgomery | United Brick & Tile Co. | 207 Pickwick Bldg., Kansas City 42, Mo. | Coffeyville | B |
| Montgomery | Universal Atlas Cement Co. | 100 Park Ave., New York 17, N.Y. | Independence | C |
| Neosho | Ash Grove Lime & Portland Cement Co. |
101 W. 11th St., Kansas City 6, Mo. | Chanute | C |
| Wilson | Acme Brick Co. | P. O. Box 425, Fort Worth, Texas | Buffalo | B |
| Wilson | Consolidated Cement Corp. | Fredonia | Fredonia | C |
| Wilson | Excelsior Brick Co. | P. O. Box 32, Fredonia | Fredonia | B |
| Wyandotte | Kansas Industries, Inc. | 4001 Kaw Drive, Kansas City | Kansas City | A |
| * A, aggregate; B, brick; C, cement. | ||||
Salt production in Kansas in 1958 amounted to 867,924 tons valued at $9,827,759, a decrease of 1.3 percent in tonnage but an increase of 7.2 percent in value compared to production and value in 1957 (Table 27). Kansas produces both rock and evaporated salt. Of the total salt produced in 1958 in the state, 56.4 percent was rock salt and 43.6 percent evaporated salt. The value of the evaporated salt, however, was 75.5 percent of the total. Rock salt production in 1958 was 483,562 tons or 1.9 percent less than in 1957. The 1958 value of rock salt, $2,575,700, however, was $7,569 more than that of 1957, an increase of 0.2 percent. Salt produced by the evaporating process in 1958 showed an increase of 0.4 percent in tonnage and 9.6 percent in value compared to that of the previous year. In 1958, production of evaporated salt amounted to 373,263 tons, valued at $7,96'2,669, whereas in 1957 the tonnage and value were respectively 371,752 tons and $7,259,628. Salt was produced by five companies operating in three counties, Ellsworth, Reno, and Rice, the Reno County production being more than half of the total. In addition to the regular commercial salt producing companies, the Frontier Chemical Company of Kansas, Inc., Wichita, produces its own salt from wells in Sedgwick County near Wichita for use in the manufacture of industrial inorganic chemicals.
Table 27—Salt sold or used by producers in Kansas in 1957 and 1958, short tons
| Year | Evaporated salt | Rock salt | Total | |||
|---|---|---|---|---|---|---|
| Tons | Value | Tons | Value | Tons | Value | |
| 1957* | 371,752 | $7,259,628 | 496,172 | $2,568,131 | 867,924 | $9,827,759 |
| 1958 | 373,263 | $7,962,669 | 483,562 | $2,575,700 | 856,825 | $10,538,369 |
| Percent change from 1957 |
+0.4 | +9.6 | -1.9 | +0.2 | -1.3 | +7.2 |
| * Revised figures. | ||||||
Salt ranked 6th in value among minerals produced in the state in 1958. Kansas salt in 1958 was shipped to 31 states and to Canada and Mexico. Since salt production first started, Kansas has produced less than 5,000,000 tons of salt, an insignificant amount when compared to the reserves of more than 5,000,000,000,000 tons estimated to underlie much of the state.
A new salt company, the Pawnee Salt Corp. of Pawnee Rock in Barton County, was organized in 1958. This company will produce salt by the brine process and will employ 20 persons. The new plant is designed to produce 100 tons of evaporated salt daily. The Frontier Chemical Company, which produces salt for use in manufacturing inorganic chemicals, is now a division of Vulcan Materials Company of Birmingham, Alabama. The company is in the process of a $5,000,000 expansion program and expects to employ 20 additional persons. The Carey Salt Company of Hutchinson, Reno County, has moved from its old quarters to its modern new general office building.
The five salt companies that operated in the state in 1958 are listed in Table 28.
Table 28—Directory of salt producing companies in Kansas in 1958
| County | Company | Office address | Location of mine or well |
Type of plant |
|---|---|---|---|---|
| Ellsworth | Independent Salt Co. | 4115 Packers Ave., Chicago 9, Ill. |
Kanopolis | Rock |
| Reno | The Barton Salt Co. | Hutchinson | Hutchinson | Evaporated |
| Reno | The Carey Salt Co. | Hutchinson | Hutchinson | Rock and evaporated |
| Reno | Morton Salt Co. | 120 S. LaSalle, Chicago 3, Ill. |
Hutchinson | Evaporated |
| Rice | American Salt | 630 New York Life Bldg., Kansas City 6, Mo. |
Lyons | Evaporated and rock |
| Sedgwick | Frontier Chemical Co. of Kansas, Inc. |
P. O. Box 545, Wichita | Wichita | Brine |
Sand and gravel production in Kansas in 1958 increased by 13.2 percent in quantity and 14.1 percent in value compared to 1957 (Table 29). Total sand and gravel production in 1958 was 10,578,668 tons, 1,233,760 tons more than in 1957. The 1958 quantity sold for $7,044,966, or $870,209 more than the 1957 tonnage. Sand and gravel were produced in 66 counties by 95 commercial operators and at least 47 noncommercial producers, a total of 142 agencies. In 1958, sand and gravel ranked seventh in value among the minerals produced in the state. Of the total sand and gravel produced in 1958, commercial operators produced 8,529,691 tons and noncommercial agencies 2,048,977 tons. Sedgwick and Wyandotte Counties accounted for 3,395,438 tons of sand and gravel, or 32.1 percent of the total. Most of the sand and gravel was used for paving and structural purposes. Other uses of Kansas sand included blast, engine, filter, glass, and molding sands (Table 30, 31).
Table 29—Sand and gravel sold or used by commercial and noncommercial producers in Kansas, 1957 and 1958
| Year | Commercial | Noncommercial | Total sand and gravel | Ave. price per ton |
|||
|---|---|---|---|---|---|---|---|
| Short tons | Value | Short tons | Value | Short tons | Value | ||
| 1957 | 7,679,555 | $5,424,703 | 1,665,353 | $750,054 | 9,344,908 | $6,174,757 | .66 |
| 1958 | 8,529,691 | 6,073,020 | 2,048,977 | 971,946 | 10,578,668 | 7,044,966 | .65 |
| Percent change from 1957 |
+11.1 | +11.9 | +23 | +29.5 | +13.2 | +14.1 | -1.5 |
Table 30—Production of sand in Kansas, 1957 and 1958, by uses
| Use | Production and value | ||
|---|---|---|---|
| 1957 | 1958 | ||
| Paving | Tons | 3,034,700 | 4,248,870 |
| Value | $1,967,245 | $2,623,238 | |
| Structural | Tons | 2,897,144 | 2,831,575 |
| Value | $2,073,006 | $2,081,423 | |
| Engine | Tons | 33,615 | 37,536 |
| Value | $25,218 | $55,548 | |
| Railroad ballast | Tons | * | |
| Value | * | ||
| Filter | Tons | 16,092 | 10,405 |
| Value | $17,320 | $17,056 | |
| Molding | Tons | * | * |
| Value | * | * | |
| Glass | Tons | * | |
| Value | * | ||
| Blast | Tons | * | * |
| Value | * | * | |
| Other | Tons | 466,561 | 841,609 |
| Value | $211,782 | $465,975 | |
| * Undistributed, value included with "Other" | |||
Table 31—Production of gravel in Kansas, 1957 and 1958, by uses
| Use | Production and value | ||
|---|---|---|---|
| 1957 | 1958 | ||
| Paving | Tons | 2,540,302 | 2,135,897 |
| Value | $1,522,630 | $1,391,198 | |
| Structural | Tons | 300,327 | 385,566 |
| Value | $234,080 | $310,779 | |
| Other | Tons | 66,167 | 64,677 |
| Value | $113,476 | $102,659 | |
Sand and gravel reserves are regarded as inexhaustible because the demand for sand and gravel is insignificant compared to the quantity available. Furthermore, sand especially is continually being replaced by new deposits brought in by streams as the river sand is used.
The Clay Center Concrete and Sand Company, Clay Center, Clay County, has announced installing new equipment costing approximately $50,000 at its plant.
Sand and gravel producers that operated in 1958 are listed in Table 32.
Table 32—Directory of sand and gravel producers on record as of December 31 1958
| County | Company or operator | Address |
|---|---|---|
| Barber | Barber Co. Highway Dept. | Medicine Lodge |
| M. W. Watson | 1004 Nat'l Bank of Topeka Bldg., Topeka |
|
| Barton | Barton Co. Highway Dept. | P.O. Box 747, Great Bend |
| Arkansas Sand Co. | 1619 Stone St., Great Bend | |
| Gruber Sand Plant | 918 Stone St., Great Bend | |
| Klepper Sand Co. | Claflin | |
| Moos Bros. Sand Co. | P.O. Box 406, Great Bend | |
| Du Bois Sand Co. | P.O. Box 172, Great Bend | |
| San Ore Construction Co. | McPherson | |
| Brown | Ralph Mitchell | Route 1, Hiawatha |
| Chase | Chase Co. Highway Dept. | Cottonwood Falls |
| Chautauqua | Chautauqua Co. Highway Dept. | Sedan |
| Clark | Clark Co. Highway Dept. | Ashland |
| Clay | Alsop Sand Co. | Wakefield |
| Clay Center Concrete & Sand Co. | Clay Center | |
| Cloud | Cloud Co. Highway Dept. | Concordia |
| Earl Beaver Co., Inc. | Glasco | |
| Ross Sand Co., Inc. | P.O. Box 461, Concordia | |
| Walker Sand Co. | 1611 Cedar St., Concordia | |
| Coffey | Coffey Co. Highway Dept. | Burlington |
| Comanche | Comanche Co. Road Dept. | Coldwater |
| Cowley | Cowley Co. Highway Dept. | Winfield |
| Arkansas City Sand & Gravel Co. | P.O. Box 166, Arkansas City | |
| McFarland Gravel Co. | 720 No. D St., Arkansas City | |
| Oxford Sand & Gravel Co. | P.O. Box 266, Oxford | |
| Warren R. Phillips | P.O. Box 50, Winfield | |
| Wilson Bros. | P.O. Box 59, Route 1, Arkansas City | |
| Myers Materials, Inc. | P.O. Box 911, El Dorado | |
| Decatur | Decatur Co. Highway Dept. | Oberlin |
| Dickinson | Shoffner Sand & Gravel Co. | 134 E. Jewell St., Salina |
| Douglas | Bowersock Mills & Power Co. | 546 Massachusetts St., Lawrence |
| Edwards | Mekch Sand & Gravel Co. | c/o Miss Cecil Matthews, Courthouse, Kinsley |
| Showalter Sand & Gravel Co. | Garfield | |
| Elk | Elk Co. Highway Dept. | Howard |
| Ellis | Ellis Co. Highway Dept. | Hays |
| Lewis C. Schmidtberger | P.O. Box 93, Victoria | |
| Ellsworth | Ellsworth Co. Highway Dept. | Ellsworth |
| Henry Milberger | Wilson | |
| Stoppel Construction Co. | Ellsworth | |
| Finney | Finney Co. Highway Dept. | Garden City |
| Sam Alsop Construction Co. | 1207 Pinecrest, Garden City | |
| Ford | Davis & Sons Sand Sales | Route 1, Dodge City |
| Dodge City Sand Co. | P.O. Box 430, Dodge City | |
| Miller Sand & Gravel Co. | Dodge City | |
| Seacot Sand & Excavating Co. | Greensburg | |
| Geary | Junction City Sand & Gravel Co. | Route 3, Junction City |
| Gove | Gove Co. Highway Dept. | Gove |
| Harry Henery, Inc. | P.O. Box 15, Ottawa | |
| Graham | San Ore Construction Co. | McPherson |
| Grant | Grant Co. Highway Dept. | Ulysses |
| Harry Henery, Inc. | P.O. Box 15, Ottawa | |
| Gray | Gray Co. Road Dept. | Cimarron |
| Kerr Sand Co. | Cimarron | |
| Hamilton | Hamilton Co. Highway Dept. | Syracuse |
| Syracuse Construction Co. | Syracuse | |
| Harper | Harper Co. Highway Dept. | Anthony |
| San Ore Construction Co. | McPherson | |
| Harvey | Thach Sand & Gravel Co. | Route 1, Barton |
| Haskell | Haskell Co. Highway Dept. | Sublette |
| Howard Mitchell | Hugoton | |
| M. W. Watson | 1004 Nat'l Bank of Topeka Bldg., Topeka |
|
| Jackson | Jackson Co. Highway Dept. | Holton |
| Jewell | Jewell Co. Highway Dept. | Mankato |
| Kearny | Kearny Co. Highway Dept. | Lakin |
| Popejoy Sand & Gravel Co. | Ulysses | |
| Kingman | Ray Wells | Route 1, Kingman |
| Kiowa | Kiowa Co. Highway Dept. | Greensburg |
| Leavenworth | Leavenworth Co. Highway Dept. | Leavenworth |
| Missouri Valley Sand, Inc. | P.O. Box 822, Leavenworth | |
| Logan | Logan Co. Highway Dept. | Russell Springs |
| Lyon | Wesley Parks | 648 Oak si., Emporia |
| Marshall | Marshall Co. Highway Dept. | Marysville |
| Blue River Sand & Gravel Co. | Blue Rapids | |
| C. V. Garrett | Blue Rapids | |
| Heinzelman Construction Co. | Marysville | |
| McPherson | McPherson Co. Road Dept. | McPherson |
| Nemaha | Anderson-Oxandale | P.O. Box 425, Herington |
| Osborne | Osborne Co. Highway Dept. | Osborne |
| Ottawa | Ottawa Co. Highway Dept. | Minneapolis |
| Pawnee | Pawnee Co. Highway Dept. | Larned |
| Johnson Sand & Gravel Co. | P.O. Box 545, Larned | |
| Larned Sand & Gravel Co. | P.O. Box 227, Larned | |
| Phillips | Phillips Co. Highway Dept. | Phillipsburg |
| D. G. Hansen | Logan | |
| Pottawatomie | Pottawatomie Co. Highway Dept. | Westmoreland |
| Wamego Sand Co. | Wamego | |
| Pratt | Pratt Co. Highway Dept. | Pratt |
| Mrs. C. D. Hogard | 507 So. Mound St., Pratt | |
| Miller Sand & Gravel Co. | Route 2, Pratt | |
| Reno | City of Hutchinson Road Dept. | Hutchinson |
| Haven Sand Co. | Haven | |
| J. N. Shears Sons, Inc. | P.O. Box 277, Hutchinson | |
| J. E. Steele Sand & Gravel Co. | Route 4, Hutchinson | |
| J. A. Mummey Sand & Gravel Co. | Nickerson | |
| Fountain Sand Pit | Arlington | |
| Republic | Republic Co. Highway Dept. | Belleville |
| Alsop Sand Co. | Wakefield | |
| Rice | Arensman Sand & Gravel Co. | Chase |
| Rock Hill Stone & Gravel Co. | P.O. Box 412, Sterling | |
| A. L. Stapleton | 121 N. Logan St., Lyons | |
| Sterling Sand & Gravel Co., Inc. | P.O. Box 281, Sterling | |
| Tobias, Wright & Birchenough, Inc. | Lyons | |
| Riley | Walters Sand Co., Inc. | P.O. Box 30, Manhattan |
| Russell | Russell Co. Highway Dept. | Russell |
| Saline | Salina Sand Co., Inc. | Mentor |
| Sedgwick | City Engineer, Wichita | Wichita |
| Bentley Sand Co. | Bentley | |
| Big Three Sand & Gravel Co. | 3020 W. 21st SE, Wichita 12 | |
| Dolese Brothers Co. | 13 N.W. 13th St., Oklahoma City, Oklahoma |
|
| L. C. House Sand Co. | Route 2, Sedgwick | |
| Walt Keeler Co., Inc. | P.O. Box 1972, Wichita 1 | |
| Miles Sand Service | 3925 W. 53rd St., Wichita | |
| Provence Sand Co. | 6600 W. 13th St., Wichita | |
| Southwest Sand & Gravel Co. | 4505 Southwest Blvd., Wichita 15 | |
| Superior Sand Co., Inc. | 1717 W. 21st St., Wichita 3 | |
| Vic's Sand & Gravel Co. | Sedgwick | |
| J & H Sand Co. | 4226 Midland St., Wichita | |
| York Sand Co. | P.O. Box 306, Sedgwick | |
| Shawnee | Consumers Sand Co. | 1101 W. Railroad, Topeka |
| Kansas Sand Co., Inc. | 531 N. Tyler St., Topeka | |
| River Sand Co. | P.O. Box 233, Topeka | |
| Shoffner Sand, Inc. | 1939 McAllister St., Topeka | |
| Harry Henery, Inc. | P.O. Box 15, Ottawa | |
| Sheridan | Sheridan Co. Highway Dept. | Hoxie |
| Carl Kaiser | Grainfield | |
| Sherman | Sherman Co. Highway Dept. | P.O. Box 22, Goodland |
| Harry Henery, Inc. | P.O. Box 15, Ottawa | |
| M. W. Watson | 1004 Nat'l Bank of Topeka Bldg., Topeka |
|
| Smith | Smith Co. Highway Dept. | Smith Center |
| Stafford | Stafford Co. Highway Dept. | St. John |
| Partin Sand & Gravel Co. | P.O. Box 274, Stafford | |
| San Ore Construction Co. | McPherson | |
| Sumner | Sumner Co. Engineering Dept. | Wellington |
| Mulvane Sand Co., Inc. | 503 E. Mulvane St., Mulvane | |
| Thomas | Thomas Co. Road Dept. | Colby |
| Purma Dray Line Co. | 975 2nd St., Colby | |
| Joe Hubbard | Colby | |
| Trego | Trego Co. Highway Dept. | WaKeeney |
| Wabaunsee | Wabaunsee Co. Highway Dept. | Alma |
| Wallace | Wallace Co. Highway Dept. | Sharon Springs |
| Washington | Washington Co. Highway Dept. | Washington |
| Finlayson Gravel | Barnes | |
| Mueller Sand & Gravel Co. | Hanover | |
| Wilson | Wilson Co. Highway Dept. | Fredonia |
| Wyandotte | American Sand & Gravel Co. | 5731 Kansas Ave. Turner |
| Builders Sand Co. | P.O. Box 658, Argentine Sta., Kansas City 6 |
|
| Dreyer Sand Co. | Turner | |
| Happe Sand Co. | 5411 Birch St., Mission | |
| Holliday Sand & Gravel Co. | 2 West 40th St., Kansas City 11, Mo. | |
| Peck-Woolf Sand & Materials Co. | 1920 Paseo Blvd., Kansas City 8, Mo. | |
| Ralph Rees | Route 1, Bonner Springs | |
| Stewart Sand & Materials Co. | 4049 Penn. Ave., Kansas City 11, Mo. |
Stone, fourth most important mineral commodity in Kansas in 1958, showed a gain of 20.2 percent in quantity and 26.4 percent in value compared to 1957. Production in 1958 amounted to 12,505,060 tons, an increase of 2,104,852 tons. In value the 1958 production was worth $15,039,385 or $3,149,846 more than the previous year's production (Table 33). Stone produced in Kansas consists of limestone, sandstone, and chat (chert); the last is associated with the metal mining industry of the Tri-State Lead and Zinc District in southern Cherokee County. In the tables, chat is included under "miscellaneous" stone.
Table 33—Quantity and value of stone produced in Kansas, 1957 and 1958, by kinds
| Year | Limestone | Sandstone | Miscellaneous | Total stone | ||||
|---|---|---|---|---|---|---|---|---|
| Tons | Value | Tons | Value | Tons | Value | Tons | Value | |
| 1957 | 8,860,134* | $11,241,664* | ** | ** | 1,540,074 | $647,875 | 10,400,208* | $11,889,539* |
| 1958 | 11,549,276 | $14,617,410 | 26,100*- | $38,800** | 928,874 | $383,175 | 12,505,060 | $15,039,385 |
| Percent change from 1957 |
+33 | +30 | -39.7 | -40.9 | +20.2 | +26.4 | ||
| *Revised figures ** Excludes all commercial sandstone, value for which is included under "Undistributed" in Table 1. |
||||||||
Most of the stone produced in the state in 1958 was crushed and used for concrete and road metal—7,975,066 tons valued at $10,001,850, of which 7,619,141 tons, valued at $9,824,504, was limestone. Quantitatively, next in importance was stone used for making portland and masonry cement, followed by rip rap material, railroad ballast, and agricultural limestone. On the basis of value, stone for concrete and road metal was first ($9,824,504), then cement ($2,464,135), dimension stone ($530,345), riprap material ($510,682), agricultural limestone ($430,584), and railroad ballast ($237,810). With the exception of railroad ballast, all uses of stone showed large gains in 1958 compared to 1957. A summary of Kansas stone production and value by kinds for 1957 and 1958 is presented in Table 34. Table 35 shows Kansas stone production and value by kinds of rock and uses for 1957 and 1958.
Table 34—Summary of stone production in Kansas, 1957 and 1958, by uses
| Use | 1957a | 1958c | Percent change from 1957 |
|
|---|---|---|---|---|
| Concrete | Tons | 5,924,724 | 7,975,066 | +34.6 |
| Value | $7,403,101 | $10,001,850 | +33.7 | |
| Cement | Tons | 2,211,274 | 2,464,135 | +11.4 |
| Value | $2,211,274 | $2,464,135 | +11.4 | |
| Riprap | Tons | 344,465 | 614,627 | +78.4 |
| Value | $313,634 | $510,682 | +62.8 | |
| Dimension stonea | Tons | 20,477 | 51,019 | +149.1 |
| Value | $448,457 | $530,345 | +18.2 | |
| Railroad ballast | Tons | 1,366,856 | 604,749 | -55.8 |
| Value | $659,664 | $237,810 | -64.0 | |
| Agricultural | Tons | 196,606 | 288,213 | +46.5 |
| Value | $256,034 | $430,584 | +68.1 | |
| Other | Tons | 335,806b | 506,531 | +50.8 |
| Value | $597,375b | $863,949 | +44.0 | |
| Total | Tons | 10,400,208b | 12,505,060 | +20.2 |
| Value | $11,889,539b | $15,039,385 | +26.4 | |
|
(a) Excludes dimension sandstone (b) Revised figures (c) All commercial sandstone excluded |
||||
Table 35—Kansas stone production and value by kinds of rock and uses, 1957 and 1958
| 1957 | 1958 | ||||
|---|---|---|---|---|---|
| Tons | Value ($) | Tons | Value ($) | ||
| Limestone | |||||
| Concrete and road metal | 5,658,525 | 7,297,115 | 7,619,141 | 9,824,504 | |
| Cement | 2,211,274 | 2,211,274 | 2,464,135 | 2,464,135 | |
| Riprap | 344,465 | 311,634 | 588,437 | 471,882 | |
| Dimension stone | 20,477 | 448,457 | 51,019 | 530,345 | |
| Agricultural | 196,606 | 256,034 | 288,213 | 430,584 | |
| Railroad ballast | 92,981 | 117,775 | 31,800 | 31,981 | |
| Other or miscellaneous** | 335,806 | 597,275 | 506,531 | 863,949 | |
| Sandstone | |||||
| Railroad ballast | * | * | * | * | |
| Concrete and road metal | * | * | * | * | |
| Riprap | * | * | 26,190 | 38,800 | |
| Other (including dimension stone) |
* | * | * | * | |
| Miscellaneous | |||||
| Railroad ballast | 1,273,875 | 541,889 | 572,949 | 205,82'9 | |
| Concrete and road metal | 266,199 | 105,986 | 355,925 | 177,346 | |
| Total all stone** | 10,400,208 | $11,889,539 | 12,505,060 | $15,039,385 | |
| * Included under "Undistributed" in Table 1 ** Revised figures |
|||||
The stone reserves of Kansas are extremely large and for practical purposes may be regarded as inexhaustible.
Stone was produced in Kansas in 1958 by 75 commercial companies operating 93 quarries in 45 counties and by 24 noncommercial operators, principally county highway departments, producing stone in 25 counties at 30 sites. Greatest activity in the stone industry centered in Elk and Wyandotte Counties, which accounted for 2,520,628 tons of stone (20.1 percent of all stone produced) valued at $3,170,665 (21 percent of the total value). Wyandotte, Wilson, Elk, Allen, and Neosho Counties produced 42.4 percent of the limestone, Bourbon, Lincoln, and Graham all of the sandstone, and Cherokee County was the sole producer of chat. Dimension limestone production was confined to Cowley, Geary, Neosho, and Pottawatomie Counties and dimension sandstone to Bourbon County.
A directory of stone producers operating in Kansas in 1958 is given in Table 36.
Table 36—Directory of stone producers on record as of December 31, 1958
| County | Company or operator | Address |
|---|---|---|
| Allen | Allen Co. Highway Dept. | Iola |
| Lehigh Portland Cement Co. | Iola | |
| Monarch Cement Co. | Humboldt | |
| Anderson | Hunt Rock Co. | Garnett |
| Murray Limestone Products Co. | Centerville | |
| Atchison | U.S. Corps of Engineers | 1800 Federal Office Building, Kansas City 6, Missouri |
| Ralph Bromley | Atchison | |
| Geo. W. Kerford Quarry Co. | Atchison | |
| Bourbon | Bandera Stone Quarry | Redfield |
| Bourbon Co. Highway Dept. | Fort Scott | |
| Cullor Limestone Co. | R.F.D. 5, Fort Scott | |
| Fort Scott Hydraulic Cement Co. | P.O. Box 267, Fort Scott | |
| Butler | Butler Co. County Engineer | El Dorado |
| Myers Material, Inc. | P.O. Box 911, El Dorado | |
| Chase | Riddle Quarries, Inc. | Nat'l Bank of America Bldg., Salina |
| Chautauqua | Sedan Limestone Co. | Sedan |
| Cherokee | Baxter Chat Co. | Baxter Springs |
| Diplomat Gravel Co. | 2932 E. 17th, Joplin, Missouri |
|
| Eagle-Picher | Miami, Oklahoma | |
| Freeto Construction Co. | Pittsburg | |
| C. Y. Semple | P.O. Box 390, Baxter Springs |
|
| Southwest Chat Co., Inc. | Baxter Springs | |
| Southwest Rock & Chat Co. | Baxter Springs | |
| John J. Stark | P.O. Box 7, Girard | |
| Lee R Thomas, Agt. | Baxter Springs | |
| A. J. Wright | Baxter Springs | |
| Clay | Riddle. Quarries, Inc. | Nat'l Bank of America Bldg., Salina |
| Everett Quarries, Inc. | Plattsburg, Missouri | |
| Coffey | Coffey Co. Highway Dept. | Burlington |
| Jones Rock Co. | P.O. Box 128, Emporia | |
| Neosho Valley Rock Co. | Burlington | |
| Cowley | John V. Elam | Winfield |
| C. L. Daniels Stone Co. | P.O. Box 134, Winfield | |
| Silverdale Cut Stone Co. | Silverdale | |
| Silverdale Limestone Co. | Route 3, Box 180, Arkansas City |
|
| Crawford | John J. Stark | Box 7, Girard |
| Dickinson | Anderson-Oxandale | Box 425, Herington |
| Riddle Quarries, Inc. | Nat'l Bank of America Bldg., Salina |
|
| Doniphan | U.S. Corps of Engineers | 1800 Federal Office Building, Kansas City 6, Missouri |
| Everett Quarries, Inc. | Plattsburg, Missouri | |
| Geo. W. Kerford Co., Inc. | Atchison | |
| Wolf River Limestone, Inc. | Troy | |
| Douglas | Perry Jones | Carbondale |
| Elk | Concrete Materials Const. Co. | Moline |
| Elk Co. Highway Dept. | Howard | |
| Ellis | City of Ellis Highway Dept. | Ellis |
| Franklin | Franklin Co. Highway Dept. | Ottawa |
| Dan Fogle | Ottawa | |
| Geary | Grosshans-Peterson, Inc. | Marysville |
| Walker Cut Stone Co. | P.O. Box 269, Junction City |
|
| Graham | U.S. Bur. Reclamation | P.O. Box 841, Stockton |
| E. C. Schroeder Co. | Hill City | |
| Greenwood | Greenwood Co. Highway Dept. | Eureka |
| Myers Material, Inc. | P.O. Box 911, El Dorado | |
| Jackson | Anderson-Oxandale | Box 425, Herington |
| G. W. Baker | Holton | |
| Reno Construction Co. | P.O. Box 61, Overland Park |
|
| Jefferson | Roy Baker | Valley Falls |
| N. R. Hamm Quarry, Inc. | Perry | |
| Jewell | Ideal Cement Co. | Superior, Nebraska |
| Johnson | Johnson Co. Highway Dept. | Olathe |
| Deitz Hill Development Co. | 28 SW Blvd., Kansas City 10, Missouri |
|
| Reno Construction Co. | P.O. Box 61, Overland Park |
|
| Labette | Labette Co. Highway Dept. | Oswego |
| John J. Stark | Box 7, Girard | |
| Leavenworth | Kansas State Penitentiary | Lansing |
| U.S. Corps of Engineers | 1800 Federal Office Bldg., Kansas City 6, Missouri |
|
| J. C. Haigwood | Tonganoxie | |
| Loring Quarries, Inc. | P.O. Box 174, Bonner Springs |
|
| Lincoln | Quartzite Stone Co. | Lincoln |
| Linn | Lee Giles | Greeley |
| Linn Co. Highway Dept. | Mound City | |
| Murray Limestone Products | Centerville | |
| Lyon | City of Emporia Highway Dept. | Emporia |
| Marion | Walt Keeler Co., Inc. | P.O. Box 1972, Wichita 1 |
| Riddle Quarries, Inc. | Nat'l Bank of America Bldg., Salina |
|
| Marshall | Marshall Co. Highway Dept. | Marysville |
| R. Hopper Brothers Quarry | Pawnee, Nebraska | |
| Miami | Miami Co. Highway Dept. | Paola |
| A. J. Forster | Paola | |
| L. W. Hayes, Inc. | 4550 Main SE, Kansas City 2, Mo. |
|
| Montgomery | City of Coffeyville | Coffeyville |
| Montgomery Co. Highway Dept. | Independence | |
| H. & S. Rock Co. | R.F.D. 1, Elk City | |
| Universal Atlas Cement Co. | 100 Park Ave., New York 17, NY |
|
| Morris | Anderson-Oxandale | Box 425, Herington |
| Nemaha | Anderson-Oxandale | Box 425, Herington |
| Neosho | Neosho Co. Highway Dept. | Erie |
| Ash Grove Lime-Portland Cement Co. |
101 W. 11th st., Kansas City, Mo. |
|
| Harry Byers & Sons, Inc. | 500 N. Plummer, Chanute |
|
| Joe O'Brian Rock Crusher | St. Paul | |
| Osage | Clark Rock Quarry | Baldwin |
| K. E. Dusenbury, Inc. | Box 224, Lyndon | |
| Osborne | Osborne Co. Highway Dept. | Osborne |
| Pottawatomie | Anderson-Oxandale | Box 425, Herington |
| Bayer Stone Co., Inc. | 509 Yuma St., Manhattan |
|
| Manhattan Cut Stone Co. | P.O. Box 388, Manhattan | |
| Rice | Riddle Quarries, Inc. | Nat'l Bank of America Bldg., Salina |
| Riley | Bayer Construction Co. | 509 Yuma St., Manhattan |
| Sedgwick | Wichita Highway Dept. | City Bldg., Wichita |
| Shawnee | Anderson-Oxandale | Box 425, Herington |
| Perry Jones | Carbondale | |
| Henry C. Luttjohann | 2001 James St., Topeka | |
| Netherland Stone Co. | Route 2, Topeka | |
| Wilson | Anderson-Oxandale | Box 425, Herington |
| Benedict Rock & Lime Co. | Benedict | |
| Carr Rock Products Co. | 315 N. 8th St., Neodesha | |
| Consolidated Cement Corp. | Fredonia | |
| Woodson | Woodson Co. Corp. Engineers | Yates Center |
| Nelson Brothers Quarries | La Harpe | |
| Wyandotte | City of Kansas City, Dept. of Streets |
Kansas City |
| American Rock Crusher Co. | 3700 Rainbow Blvd., Rosedale |
|
| Lone Star Cement Corp. | 1650 Dierks Bldg., Kansas City 6, Mo. |
|
| Peerless Quarries, Inc. | Turner | |
| Thompson-Strauss Quarries, Inc. | 700 Holliday Drive, Kansas City |
Lead and zinc are the only metals mined in Kansas; 25 mines operated by 11 producers and 6 gougers in the southeast corner of Cherokee County, in the extreme southeast part of the state, produced lead and zinc. In 1958 the value of metals produced was $1,205,850, which is $3,690,940 less than in 1957. The metals contributed 0.3 percent of the value of all minerals produced in the state (Table 4, Fig. 3).
For the second consecutive year lead production in Kansas showed a marked decline. In 1958 only 1,299 tons of recoverable lead was produced, 69.5 percent less than in 1957 when production was 4,257 tons. In value recoverable lead was worth $303,966 as compared to $1,217,502 in 1957, a decrease of 75.1 percent. The number of lead mines operated by the 11 lead mining companies and 6 gougers dwindled from 42 in 1957 to 25 in 1958.
The Eagle-Picher Mining and Smelting Company of Miami, Oklahoma, was the principal lead producer in 1958, replacing the National Lead Company of St. Louis, which in 1958, was third, having been surpassed also by the Searcy-Henderson Mining Company of Picher, Oklahoma. The only lead smelter operated in Kansas was the Eagle-Picher Mining and Smelting Company smelter at Galena, Cherokee County. This smelter treated ores not only from Kansas but also from the entire Tri-State District and some from Illinois. A lead pigment plant operated by the Ozark Smelting and Mining Company, Montgomery County, was active during 1958.
Data on lead production in Kansas in 1957 and 1958 and a directory of lead producers on record as of December 31, 1958, are presented in Tables 37 and 38 respectively.
Table 37—Quantity and value of lead produced in Kansas, 1957 and 1958
| Concentrates (galena) | Recoverable metal (lead) | |||
|---|---|---|---|---|
| Tons | Value | Tons | Value | |
| 1957 | 5,703 | $1,026,116 | 4,257 | $1,217,502 |
| 1958 | 1,828 | $242,142 | 1,299 | $303,966 |
| Percent change | -69.5 | -75.1 | ||
Table 38—Directory of lead and zinc producers in Kansas on record as of December 31, 1958
| Company | Address | Mine* |
|---|---|---|
| B. & I. Mining Co. | Picher, Oklahoma | Florence Hartley |
| Ora Black | Cardin, Oklahoma | Lindsey Bldrs. |
| Carey-McCoy Mining Co. | Picher, Oklahoma | Sonny Boy |
| Collins & Thomas | Commerce, Oklahoma | Chubb |
| The Eagle-Picher Mining & Smelting Co. |
Miami, Oklahoma | Bilhartz, Grace "B", Galena Midlings, Lucky Jew, Mid-Continent, Westside |
| National Lead Co., St. Louis, Smelting & Refg. Div. |
Fredericktown, Mo. | Bailey, Ballard, Harley #1, Thomas Land |
| F. R. Pyle | Baxter Springs | Webber Bldrs. |
| C. H. Rea | Baxter Springs | Robinson |
| Searcy-Henderson Mining Co. | Picher, Oklahoma | Stoskopf |
| Jim Stone | Miami, Oklahoma | Bendelari |
| Stone & Thomas | Commerce, Oklahoma | Cherokee |
| 6 miscellaneous gougers | various | |
| * All lead and zinc mines are in Cherokee County. | ||
Zinc, like lead, in 1958 slumped to a new low. In 1958, Kansas produced 8,210 tons of concentrated sphalerite or 4,421 tons of recoverable zinc as compared to 29,189 tons of sphalerite or 15,859 tons of recoverable zinc in 1957. Value of the recoverable zinc in 1958 was $901,884 compared to $3,679,288 in 1957, a decrease of 78 percent. The same companies that produced lead produced zinc in 1958.
The Cherryvale Zinc Company of Cherryvale, Montgomery County, added a unique smelting unit to its plant, a unit designed and built to complete metallurgical reduction and refining of lead-tin materials. This unit is housed in one of the two new buildings completed during the year.
Data on zinc production in Kansas in 1957 and 1958 and a directory of zinc producers on record as of December 31, 1958, are presented in Tables 39 and 38 respectively.
Table 39—Quantity and value of zinc produced in Kansas, 1957 and 1958
| Year | Concentrates (sphalerite) |
Recoverable metal (zinc) |
||
|---|---|---|---|---|
| Tons | Value | Tons | Value | |
| 1957 | 29,189 | $2,311,401 | 15,859 | $3,679,288 |
| 1958 | 8,210 | $499,074 | 4,421 | $901,884 |
| Percent change from 1957 |
-72.2 | -78.3 | ||
Kansas produced several minerals that are classified as "undistributed". Undistributed mineral commodities are those whose total quantity and value cannot be revealed, because they are produced almost exclusively by one company. Such minerals in 1958 include diatomaceous marl, gypsum, natural cement, salt brine, volcanic ash or pumicite, and dimension sandstone. In addition, expanded perlite and expanded vermiculite were processed within recent years from material shipped into Kansas from outside sources. The total value of undistributed minerals in Kansas in 1958 amounted to $2,056,660.
Natural cement production, shipments, and value in 1958 greatly exceeded those of 1957. Production and shipments were more than 165 percent greater than in the previous year and value more than 157 percent. The value of 1958 shipments of natural cement is included in the value listed under "Undistributed" in Table 1. The raw materials for the making of the cement are obtained from "cement" rock, or Blackjack Creek Limestone, the basal unit of the Fort Scott Limestone formation, Marmaton Group. Reserves of natural cement rock are practically unlimited.
Production and value of diatomaceous marl in Kansas in 1958 was slightly greater (1.5 percent) than in 1957. Value of diatomaceous marl is included in the total listed under "Undistributed" in Table 1, inasmuch as the DeLore Division of the National Lead Company of St. Louis, Missouri, is the sole producer in Kansas.
The known deposits, mainly in Wallace County, are estimated to exceed 1,000,000 tons.
Gypsum production in Kansas in 1958 declined approximately 11 percent in quantity of crude and 14 percent of calcined gypsum; value of crude gypsum increased 11.9 percent whereas calcined gypsum declined 6.6 percent compared to 1957. The value of the crude gypsum produced is included under the value assigned to the "Undistributed" minerals (Table 1). Gypsum was produced in Barber and Marshall Counties. Producers on record at the end of 1958 are those listed in Table 40. The reserves of gypsum are known to be extensive; they are sufficient to maintain production at the present rate for many years.
Table 40—Directory of Kansas producers of gypsum in 1958
| County | Company | Office address | Mine or plant |
|---|---|---|---|
| Barber | National Gypsum | 325 Delaware Ave., Buffalo, N.Y. |
Medicine Lodge |
| Marshall | Bestwall Gypsum | 120 E. Lancaster Ave., Ardmore, Penn. |
Blue Rapids |
Expanded perlite and expanded vermiculite were processed in Kansas from raw materials imported from other states. The quantity and value of expanded perlite sold in the state in 1958 was about 22 percent less than in 1957. Although the quantity of expanded vermiculite sold in Kansas in 1958 was approximately 25 percent less than it was in 1957, its value showed a gain of about 14 percent. Expanded perlite was processed by Panocalite Perlite, Inc., of Kansas City, Wyandotte County, and expanded vermiculite by the Dodson Manufacturing Company of Wichita, Sedgwick County. Values of perlite and vermiculite are included in the total listed under "Undistributed" in Table 1.
For the fourth consecutive year pumicite or volcanic ash production and value in Kansas decreased. In 1958, production and value of pumicite were respectively 24.4 and 13.6 percent less than in 1957. As there were only two producers in Kansas in 1958, value is included in the total listed under "Undistributed" in Table 1. Kansas volcanic ash is extracted primarily for use in hand soap and cleaning and scouring compounds. Producers on record for 1958 are listed in Table 41.
Estimated reserves of pumicite or volcanic ash in Kansas are approximately 9,700,000 tons.
Table 41—Directory of Kansas producers of pumicite, or volcanic ash, in 1958
| County | Company | Office address | Pit location (nearest town) |
|---|---|---|---|
| Lincoln | Ernest Hauzlicek | Wilson | Wilson |
| Norton | Wyandotte Chemical Corp. | 1609 Biddle Ave., Wyandotte, Mich. |
Calvert |
Salt brine for industrial purposes is produced by only one company in Kansas, the Frontier Chemical Company of Kansas, Inc., of Wichita. The salt obtained from brine pumped from the company's wells in Sedgwick County near Wichita is used in the manufacture of industrial chemicals. The quantity and value of the salt produced by this company in 1958 increased approximately 44 and 54 percent respectively from 1957. Value of the salt produced is included in the total listed under "Undistributed" in Table 1. During 1958 the Frontier Chemical Company of Kansas, Inc., formerly subsidiary of Union Chemical and Materials Company of Chicago, Illinois, became a division of the Vulcan Materials Company of Birmingham, Alabama.
Dimension sandstone was produced by the Bandera Stone Quarry Company of 222 West 72nd Street, Kansas City, Missouri. The quarry is located near Redfield in Bourbon County, Kansas. Production in 1958 is estimated to have been about the same as in 1957. The Bandera sandstone is used for building stone, including rough construction stone, sawed stone, and flagging stone. Value of dimension sandstone is included in the total listed under "Undistributed" in Table 1.
Two of the most important mineral resources of Kansas are water, both surface and underground, and soil. Water and soil are truly mineral commodities, but because of their nature and universal usage are difficult to evaluate as to quantity and value. Water, to a considerable extent, is a replenishable resource in that water supplies may be completely replenished in some geologic situations and only partly replenished in others. Soil lost by erosion is replaced only by slow soil-building processes. No data are at hand at present in regard to the actual quantity of soil that exists in Kansas. Without the soil that covers the 82,113 square miles of land surface (total area including water surface is 82,276 square miles), Kansas could not have produced $1 billion to $1.5 billion worth of agricultural products including livestock each year since 1950. The amount of available water and the quantity used or consumed in the state in 1953 were estimated by the Kansas Water Resources Fact-Finding and Research Committee in 1954. According to the survey, a total of 1,898 mgd (million gallons a day) was withdrawn from the available water resources, but the amount consumed and removed from the supply for all purposes amounted to 652 mgd, or 237,980 million gallons per year. The actual value of the 237,980 million gallons consumed per year is not known. It is estimated (Foley, Smrha, and Metzler, 1955, p. 1) that city dwellers pay an average of only about $5 a year each for water, and rural residents somewhat less. On the assumption that 51 percent of the population is urban and 49 percent rural, the minimum value of water consumed is computed to be about $9,000,000 a year. This sum, however, does not include the value of water consumed by industry, which is estimated to pay an additional $27,000,000 a year, or about three-fourths of the state's water bill. The figures cited are not intended to be exact, but they do suggest the magnitude of the value of water consumed in Kansas each year.
In addition to the minerals produced, there are other mineral commodities in Kansas that either have never been exploited or are not at present being produced on a commercial scale. Such minerals include aluminum from clays (Kinney, 1943, 1952), bentonite (Kinney, 1942), chalk (Runnels and Dubins, 1949), of which the state has virtually unlimited supplies, iron (Jewett and Schoewe, 1942, p. 103), magnesium (Schoewe, 1943; Jeffords, 1948), mineral water (Schoewe, 1953, p. 133), oil shale (Runnels and others, 1952), phosphate nodules (Runnels, 1949; Runnels and others, 1953), pyrite (Jewett and Schoewe, 1942, p. 168), rock asphalt (Jewett, 1940), and tripoli (Jewett and Schoewe, 1942, p. 168). Still other minerals are known to occur in Kansas, such as germanium (Schleicher and Hambleton, 1954; Schleicher, 1959), and uranium (Runnels, Schleicher, and Van Nortwick, 1953), but these have not been investigated sufficiently to show whether they exist in commercial quantities. Further study of these unexploited minerals in Kansas coupled with favorable economic conditions may eventually result in the production of some, if not all, of these mineral commodities.
Foley, F. C., Smrha, R. V., and Metzler, D. F. (1955) Water in Kansas, 1955, A report to the Kansas State Legislature: Kansas Water Resources Fact-Finding and Research Committee, Kansas Univ., p. 1-216, 53 fig.
Goebel, E. D., Hilpman, P. L., Hornbaker, A. L., and Beene, D. L. (1958) Oil and gas developments in Kansas during 1957: Kansas Geol. Survey, Bull. 133, p. 1-264, fig. 1-3, pl. 1-3.
Goebel, E. D., Hilpman, P. L., and Beene, D. L. (1959) Oil and gas developments in Kansas during 1958: Kansas Geol. Survey BulL 138, p. 1-228, fig. 1-11, pl. 1-3.
Jeffords, R. M. (1948) Graphic representation of oil-field brines in Kansas: Kansas Geol. Survey, Bull. 76, pt. 1, p. 1-12, fig. 1-6. [available online]
Jewett, J. M. (1940) Asphalt rock in eastern Kansas: Kansas Geol. Survey BulL 29, p. 1-23, fig. 1-3, pl. 1-2. [available online]
Jewett, J. M., and Schoewe, W. H. (1942) Kansas mineral resources for wartime industries: Kansas Geol. Survey, Bull. 41, pt. 3, p. 69-108, fig. 1-13. [available online]
Kinney, E. D. (1942) Kansas bentonite, its properties and utilization: Kansas Geol. Survey, Bull. 41, pt. 10, p. 349-367, fig. 1, pl. 1-2. [available online]
Kinney, E. D. (1943) A process for extracting alumina from Kansas clay: Kansas Geol. Survey, Bull. 47, pt. 4, p. 113-136.
Kinney, E. D. (1952) Amenability of certain Kansas clays to alumina extraction by the lime-sinter process: Kansas Geol, Survey Bull. 96, pt. 7, p. 301-328, fig. 1-3. [available online]
Runnels, R. T. (1949) Preliminary report on phosphate-bearing shales in eastern Kansas: Kansas Geol. Survey, Bull. 82, pt. 2, p. 37-48, pl. 1-2. [available online]
Runnels, R. T., and Dubins, I. M. (1949) Chemical and petrographic studies of the Fort Hays Chalk in Kansas: Kansas Geol. Survey, Bull. 82, pt. 1, p. 1-36, fig. 1-6, pl. 1. [available online]
Runnels, R. T., Kulstad, R. O., McDuffee, C., and Schleicher, J. A. (1952) Oil shale in Kansas: Kansas Geol. Survey, Bull. 96, pt. 3, p. 157-183, fig. 1-2, pl. 1-3. [available online]
Runnels, R. T., Schleicher, J. A., and Van Nortwick, H. S. (1953) Composition of some uranium-bearing phosphate nodules from Kansas shale: Kansas Geol. Survey, Bull. 102, pt. 3, p. 93-104, fig. 1-3. [available online]
Schleicher, J. A. (1959) Germanium in Kansas coals: Kansas Geol. Survey, Bull. 134, pt. 4, p. 161-179, fig. 1-2. [available online]
Schleicher, J. A., and Hambleton, W. W. (1954) Preliminary spectrographic investigation of germanium in Kansas coal: Kansas Geol. Survey, Bull. 109, pt. 8, p. 113-124, fig. 1-2. [available online]
Schoewe, W. H. (1943) Kansas oil field brines and their magnesium content: Kansas Geol. Survey, Bull. 47, pt. 2, p. 37-76, fig. 1-3.
Schoewe, W. H. (1953) The geography of Kansas, pt. 3, hydrogeography: Kansas Acad, Sci. Trans., v. 56, no. 2, p. 131-190, fig. 71-84.
Kansas Geological Survey
Placed on web Jan. 4, 2019; originally published Oct. 15, 1959.
Comments to webadmin@kgs.ku.edu
The URL for this page is http://www.kgs.ku.edu/Publications/Bulletins/134_7/index.html