Kansas Geological Survey, Bull. 119, part 1, originally published in 1956
Prev page--Introduction, Pumpage, Geology
Before water was discharged from wells in the Equus beds area, the average rate of natural discharge of ground water was equal to the average rate of recharge. Small changes in the quantity of water in an aquifer, and accompanying changes in water level, occur as the result of temporary unbalance between discharge by natural processes and recharge, but such fluctuations balance each other over a period of years and the water table under such conditions is in a state of approximate equilibrium. Discharge by wells is a new discharge superimposed upon a previously stable system, and it must be balanced by an increase in the recharge to the groundwater reservoir, by a decrease in natural discharge, by a reduction of storage, or by a combination of these. Pumping from wells generally diverts ground water that otherwise would discharge elsewhere. Whether the diversion results in a higher beneficial use of the water depends on the purpose served by the water under natural conditions.
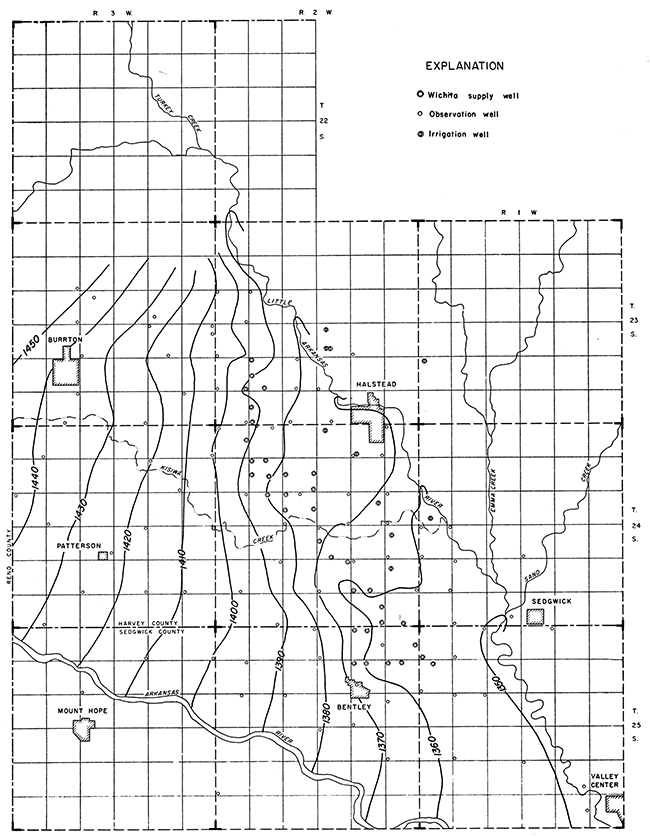
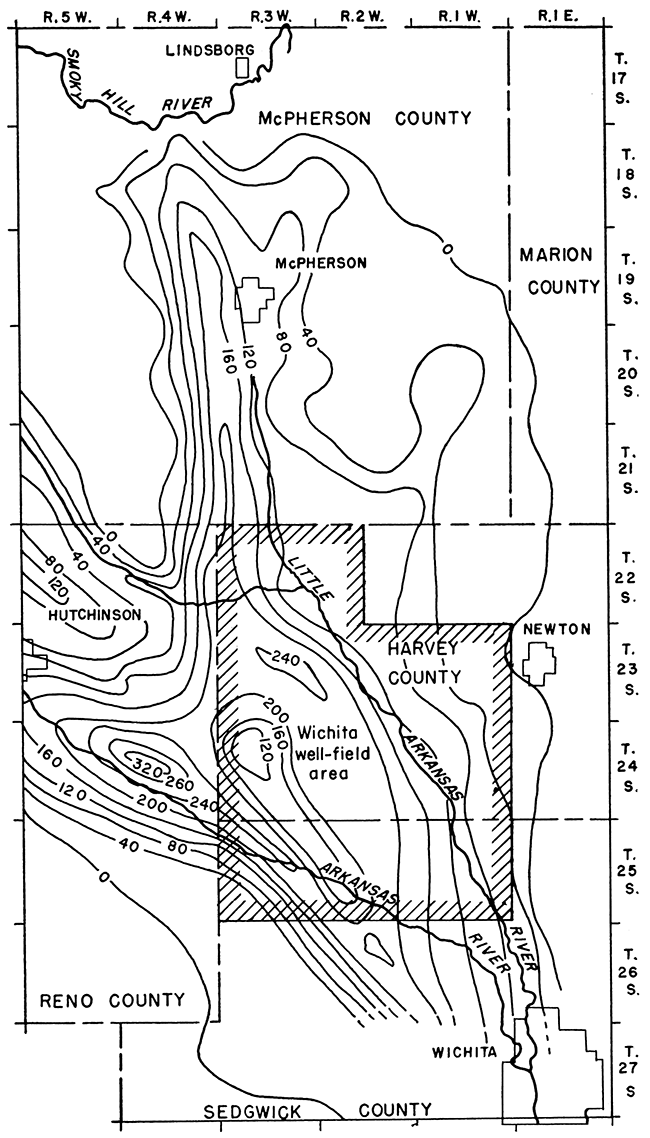
Ground water in the Equus beds area is a transient resource. The water is derived from precipitation falling on the land surface, and, if the water is not used, it slowly moves out of the area and is replaced by new ground water. Before pumping started in 1940, the ground water in the well field was moving east toward Little Arkansas River, as shown in the water-table contour map in Figure 7. At any point on such a map, the water moves down the gradient, perpendicular to the adjacent contour. Water-table contours as of January 1, 1955, are shown in Figure 8. As of January 1, 1955, the water was still moving toward Little Arkansas River, but the contours in the areas of heavy pumping have been deflected by the lowering of the water table.
Figure 7--Contours on water table in well field, August 1940.
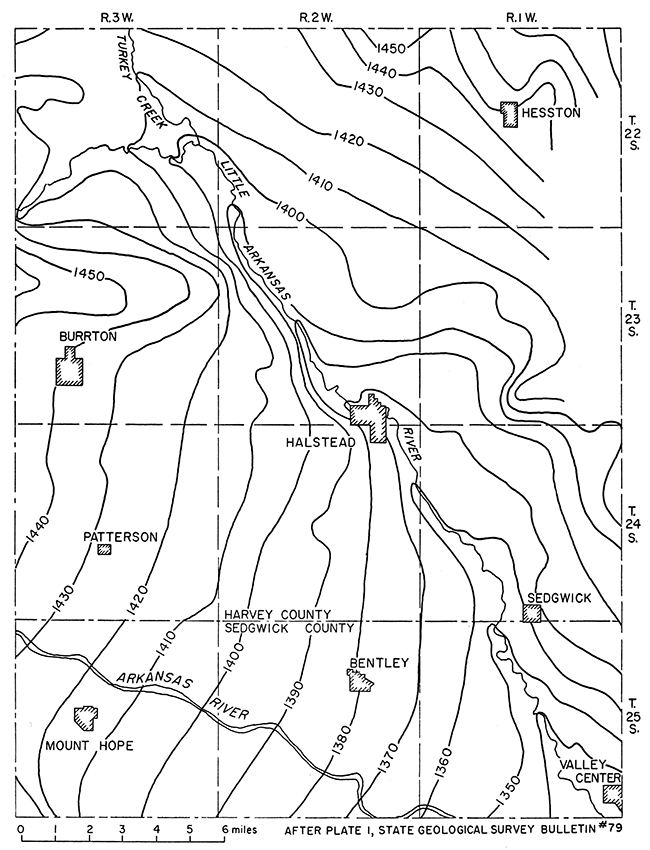
Figure 8--Contours on water table in well field, January 1, 1955.
The average rate of movement of the ground water through the well field is about 2 feet a day. Williams and Lohman (1949, p. 214) estimated that prior to 1940 about 5.3 million gallons a day was moving across the boundary of the well field. The part of the ground water moving to the east that is not discharged through wells or by evaporation and transpiration is discharged as base flow into Little Arkansas River. The seepage of ground water into the river constitutes the streamflow during drought periods. The water-table contours in Figure 8 are not in sufficient detail to measure the difference in the amount of water moving into and out of the well field or the amount of ground water that would have been discharged by seepage into Little Arkansas River had it not been intercepted by pumping. Also, the extent to which reduction of seepage into the stream has affected the discharge of Little Arkansas River is not apparent from a hydrograph of the stream. A hydrograph of the discharge of the river is shown in Figure 9 for the period 1929 through October 1954. The hydrograph does show that there were periods prior to 1940 in which the discharge was lower than it was at the end of October 1954.
Figure 9--Hydrograph of discharge of Little Arkansas River at Valley Center, 1929-1954.
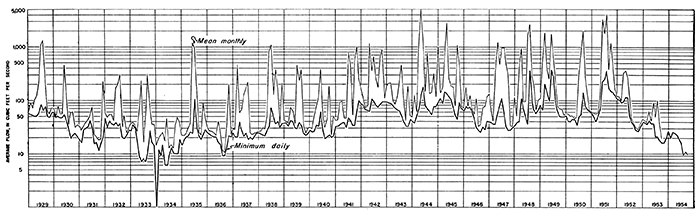
Figure 10--Depth to water in well-field area, January 1, 1955.
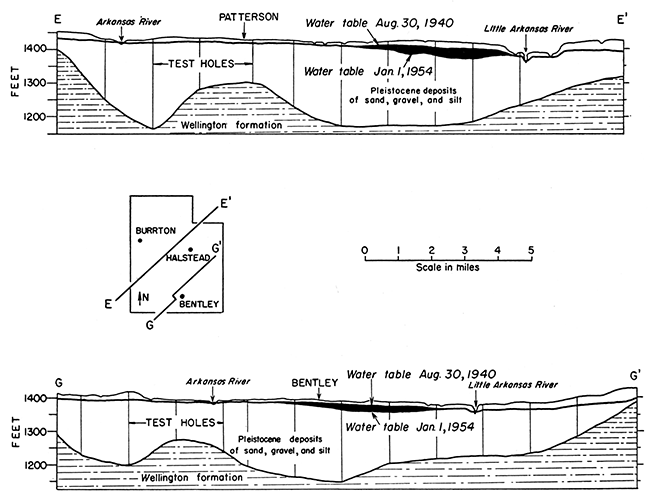
In 1940, before pumping started, the depth to water level in most of the well field ranged from 5 to 20 feet below the land surface (Williams and Lohman, 1949, pl. 5). By January 1, 1955, the depth to water level ranged from 5 to 47 feet (Fig. 10). The maximum lowering of the water table since 1940 has been 32 feet. The amount of lowering of the water table along profiles E-E' and G-G' is shown in Figure 11.
Figure 11--Cross sections E-E', and G-G', showing decline of water table from August 30, 1940, to January 1, 1955. Modified from Williams and Lohman, 1949.
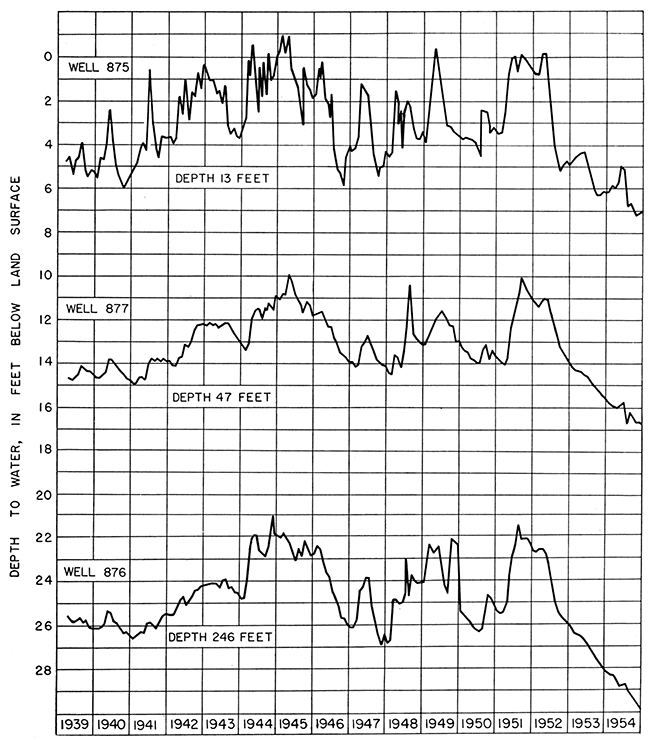
The unconsolidated water-bearing deposits of sand, gravel, clay, and silt in the well field are stratified in most places, and water levels in wells vary with the depth of the wells. Figure 12 shows the hydrographs of three wells (875, 876, and 877) at the same location screened at different depths. In these wells, the deeper the well, the lower the water level. In some other parts of the well field, the water levels in wells screened at different depths stand at about the same level. Wells 886 and 887, which are 57 and 111 feet deep, respectively, have about the same depth to water level.
Figure 12--Hydrographs of three wells having different depths at the same location.
In the well field, clay and silt zones occur throughout the water-bearing reservoir. Generally these interbedded layers of clay and silt are not extensive, and semiperched water is of local extent.
In the northern part of the well field, as shown in Figure 5, the Sappa member of the Meade formation acts as a leaky confining bed to the water contained below it. Water levels in wells terminated above and below the Sappa member stand at different levels. The static head of the water in the Grand Island member of the Meade formation is lower than that of the semiperched water in the Sanborn formation above it.
Observation wells must be carefully selected in the northern part of the well field if they are to show the effects of the Wichita pumping. The water levels in wells terminating in the Sanborn formation have declined only a small amount, whereas the water levels in deeper wells penetrating the Grand Island member have been directly affected by the Wichita pumping and have declined many feet. The water-table contour map for 1940 prepared by Williams and Lohman (1949, pl. 1) was based partly on data collected from wells terminating in the Sanborn formation. Hence, a map showing water-level change based on the original map gives an erroneous picture in the northern part of the well field. The maximum error in the original water-level-change map caused by using the wells in the Sanborn formation is about 10 feet.
The water table, shown by means of contours in Figures 7 and 8, does not remain static but fluctuates much like the water level of a surface reservoir. Whether the water table rises or declines depends upon the amount of recharge into the ground-water reservoir and the amount of discharge from it. When the inflow exceeds the draft, the water table rises; conversely, when the draft exceeds the inflow into the ground-water reservoir the water table declines. The amount of precipitation that descends to the zone of saturation is the principal factor that controls the rise of the water table. Pumping from wells, discharge from seeps and springs, and evaporation and transpiration are the principal factors that cause a decline in the water table. The fluctuations of the water table in the Equus beds area were determined by observing the water levels in wells.
Of the total precipitation, a part runs off directly at the land surface to streams, a part is dissipated by evaporation, a part is transpired by plants from the zone of soil moisture, and a part percolates downward to the zone of saturation. The fluctuations of water levels in nine wells not affected by pumping are shown by Figures 13 and 14. From 1940 to 1951, precipitation in the Wichita area was above average and the trend of the water levels was generally upward during that period. During the years of greatest precipitation the water levels rose sharply to high levels, and during dry periods they declined sharply. From 1952 to 1955, precipitation was below normal, and, accordingly, the water levels declined during that period.
Figure 13--Hydrograph showing natural fluctuations of water levels in well-field area and cumulative departure from average monthly precipitation at Wichita.
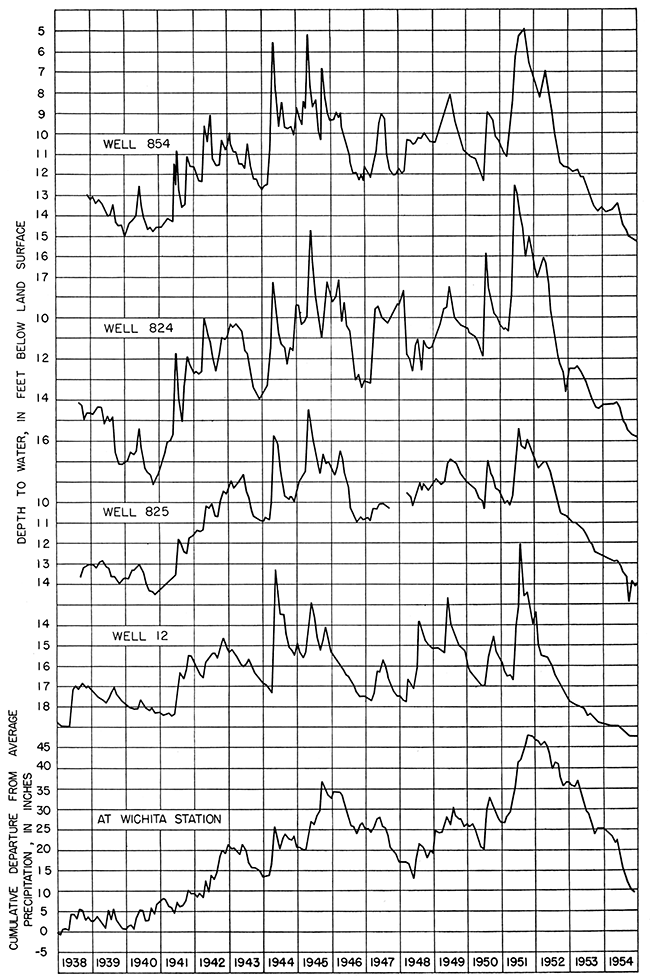
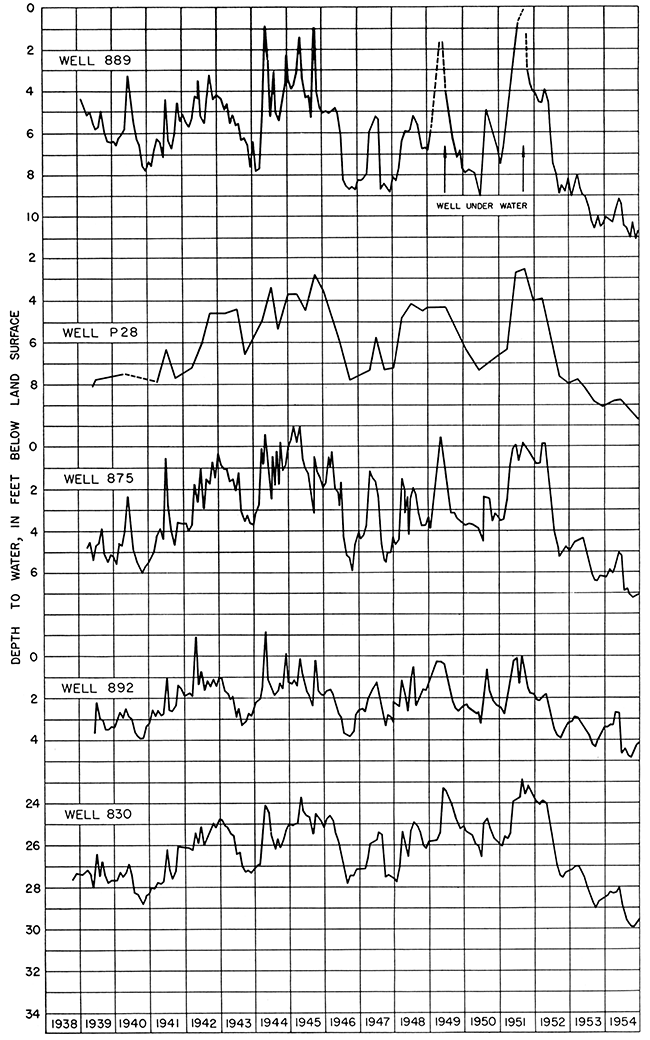
Figure 14--Hydrographs showing natural fluctuations of water levels in well field.
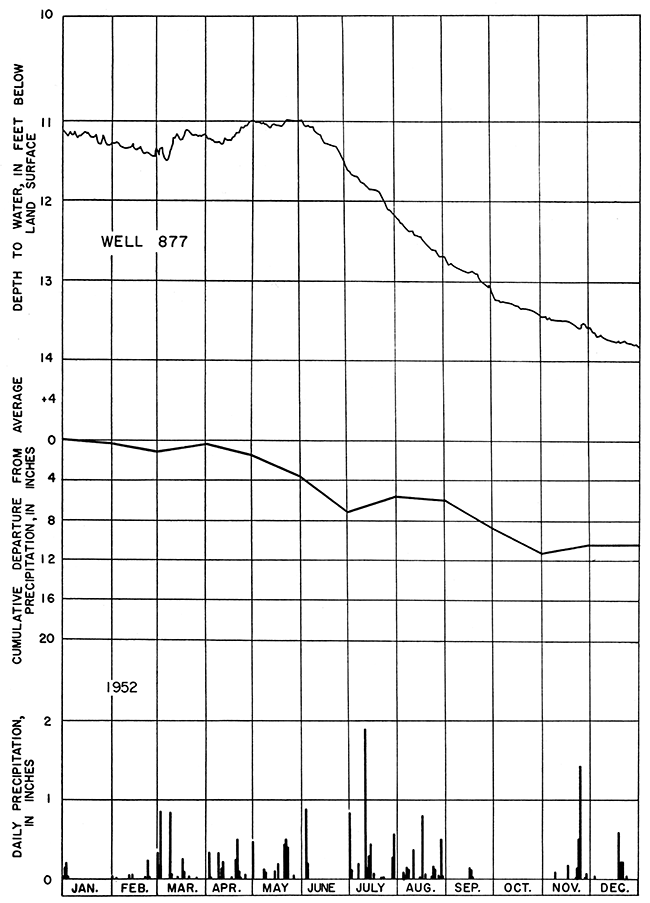
In Figures 15 and 16 are shown precipitation, cumulative departure from average precipitation, and hydro graphs of well 877 for 1951 and 1952. In 1951 the precipitation was considerably above normal, and as a result the water level in well 877 was about 2.5 feet higher at the end of the year than at the beginning of the year. In 1952 the precipitation was below normal, and the water level declined to a level slightly lower than at the beginning of 1951. The fluctuations of well 877 were not affected by pumping and represented only natural fluctuations.
Figure 15--Hydrograph of well 877, daily precipitation at Wichita, and cumulative departure from average precipitation, 1951.
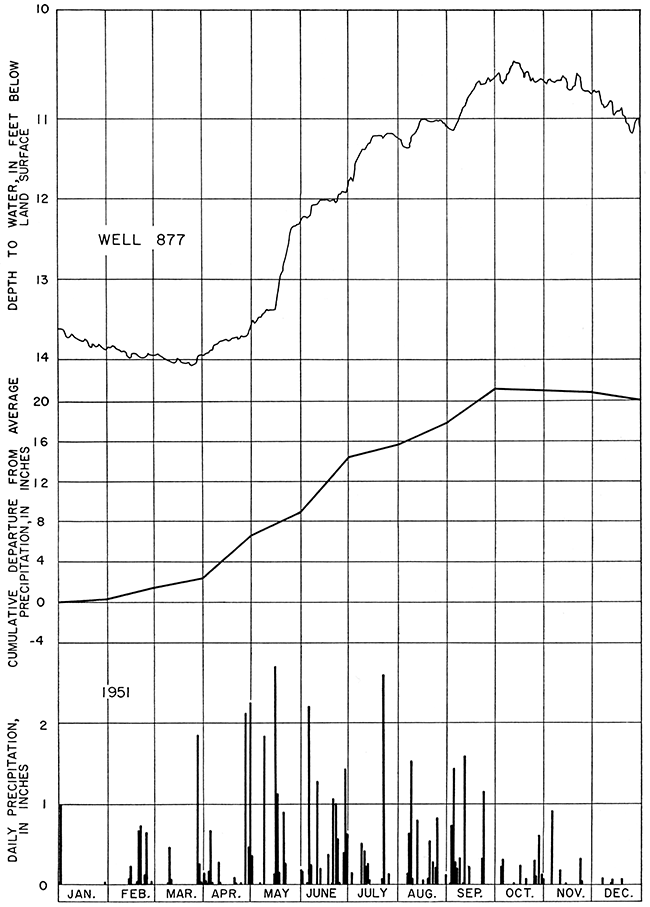
Figure 16--Hydrograph of well 877, daily precipitation at Wichita, and cumulative departure from average precipitation, 1952.
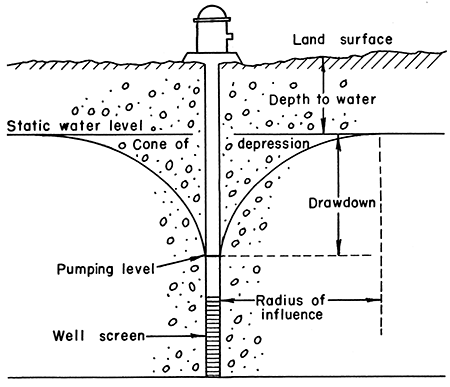
When water is pumped from a well, the water level in and around the well is lowered, the greatest amount of lowering being at the pumped well. The lowering of the water level by pumping is called drawdown. The area in which drawdown occurs is called the cone of depression. The greater the pumping rate in a given well, the greater the drawdown. A simplified cross section of a cone of depression is shown in Figure 17. The shape of the cone is determined principally by how easily water flows through the water-bearing formation. A well pumping a given quantity of water from a very permeable formation will have less drawdown than a well pumping from a less permeable formation. Continued pumping gradually lowers the water level, and the effects of the pumping can be observed at increasingly greater distances. The cone of depression must expand because the water level in the formation must slope so that water can move toward the well. If the water is coming from storage in the formation, the water level declines steadily, though at a decreasing rate. If the water begins to come from an area of replenishment, the water level may stop declining and approach equilibrium. Before the water level can reach a state of near equilibrium, it must decline so that an amount of water equal to that being pumped can move to the well from the area of recharge. When pumping by the city of Wichita began in 1940, the water level declined rapidly in and near the pumped wells. At that time most of the water was pumped from storage. As pumping continued, the rate of decline of the water level became slower, and in some periods of heavy recharge the water level rose. In part of the area, however, water was still being taken from storage during the periods that water was being replenished by infiltration of water from precipitation.
Figure 17--Schematic cross section through a cone of depression.
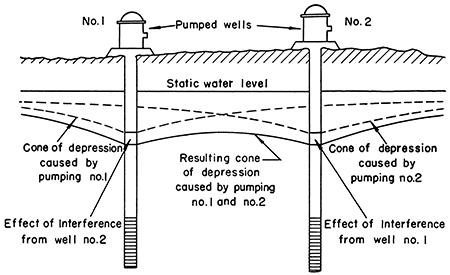
Hydrographs of wells at different distances from the pumped wells are shown in Figure 18. The graphs are arranged so that those showing the least drawdown are near the top. This is in the order of their distance from the nearest pumped well. The rate of decline in a well due to a given rate of pumping becomes progressively slower, as shown in Figure 19. If the pumping rate is increased, the rate of decline also will increase. If two pumped wells are near each other, the cones of depression of the two wells will overlap. Consequently, the drawdown in both wells will be more than if only one well had been pumping. Mutual interference between two wells is shown in Figure 20.
Figure 18--Hydrographs of wells at different distances from pumped wells.
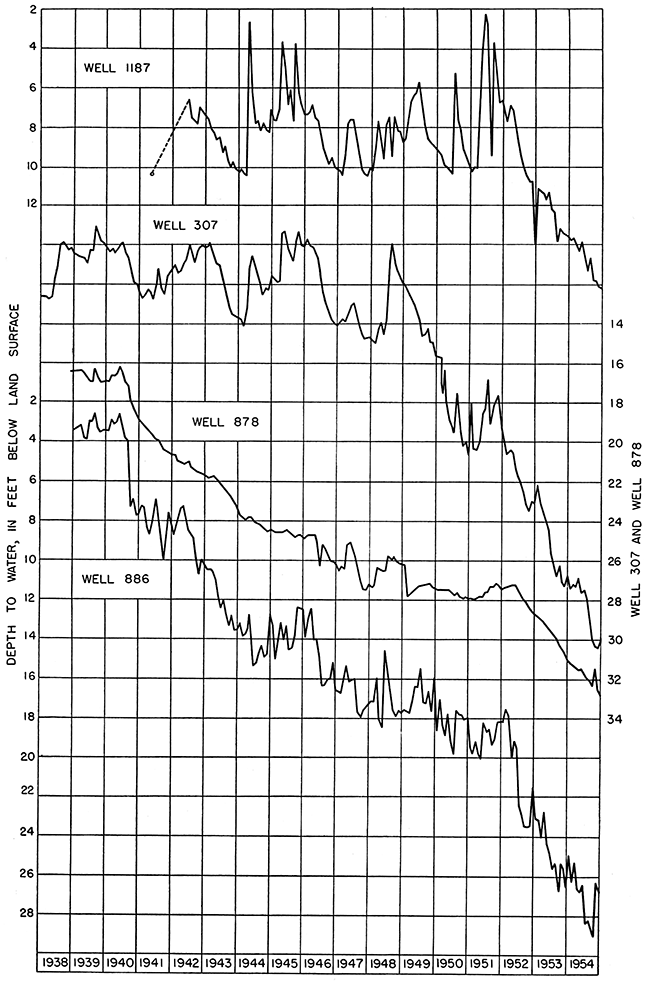
Figure 19--Drawdown and recovery of water level in pumped well.
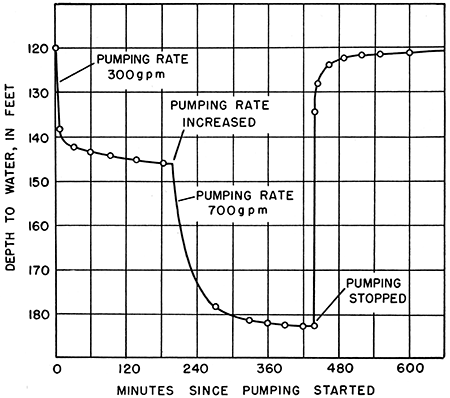
Figure 20--Schematic diagram of mutual interference between two wells.
When a well is turned off, water continues to flow toward the well because of the hydraulic gradient in that direction, and after pumping ceases, the water level in the well recovers. The rate of recovery becomes progressively slower. In time, the water levels equalize over the area affected by pumping, and the water table tends to assume its original position, but it may be lower than before water was withdrawn. If the water level after recovery is lower than it was prior to pumping, there was a net withdrawal of water from storage that was not replenished by recharge.
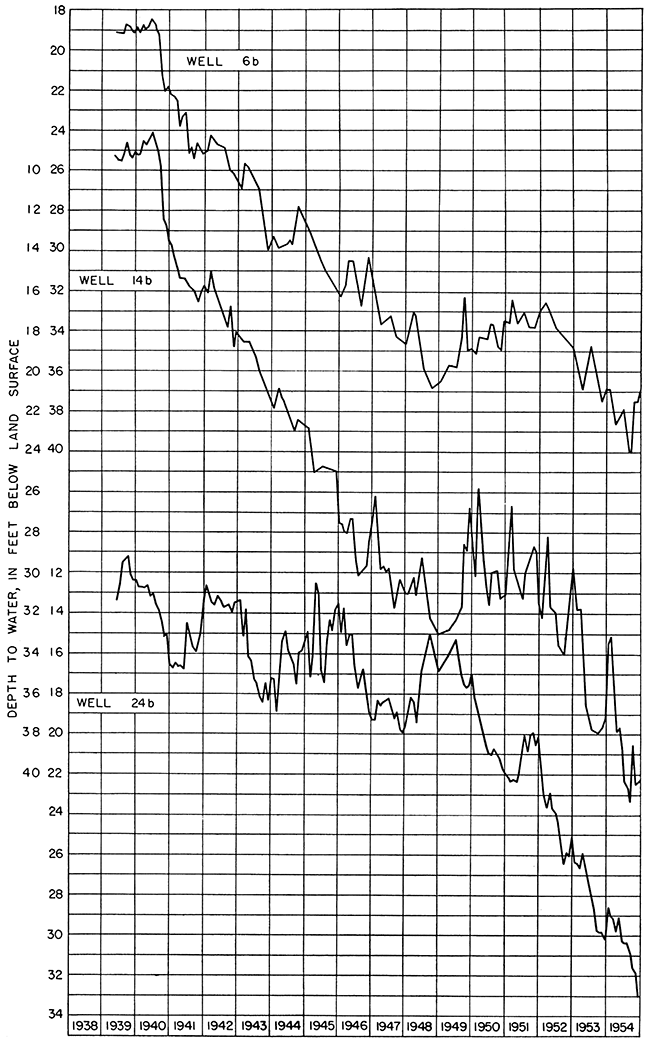
In the Wichita well field, the effect of pumping from many wells is a large, complex cone of influence, and the water levels in observation wells are perpetually fluctuating. Wells in the field are turned on and off periodically to distribute the pumping effect over the field. The fluctuations of water levels in three observation wells centrally located in the three heavily pumped areas of the well field are shown in Figure 21. The wells are respectively in the northern (6b), central (14b), and southern (24b) parts of the well field. These three hydrographs show a general decline of the water level. The water level in well M14b has shown the greatest decline of any well in the well field. In addition to the pumping effects shown in these hydrographs, there are changes in the rate of decline caused by recharge. Had there been no recharge, the drawdown curves would have been steeper. The effects from recharge are not easily distinguished from normal recovery due to the shutdown of wells.
Figure 21--Hydrographs of wells in the centers of pumping, showing decline in water level due to pumping.
Recharge is the term used to denote the addition of water to the ground-water reservoir, and it may be accomplished in several ways. The ultimate source of all ground water of quality suitable for ordinary uses in this area is precipitation on the area or in nearby areas. Once the water becomes a part of the ground-water body, it moves in the direction of the slope of the water table, later to be discharged at some point downgradient. Of the total precipitation, a part runs off directly at the land surface to streams, a part is dissipated by evaporation, a part is transpired by plants from the zone of soil moisture, and a part percolates downward to the zone of saturation.
Figures 12 and 13 show that the well-field area is recharged by precipitation. Abundant precipitation during the 1940's produced large amounts of recharge. Since 1952, precipitation has been deficient and water levels have declined steadily. During the period September 1940 to January 1, 1955, 330,000 acre-feet of water was pumped from the well field by the city of Wichita, and about 111,000 acre-feet of water was removed from storage in the well-field area. Thus, during that same period, about 33 percent of the water pumped by the city of Wichita came from storage and about 67 percent must have come from recharge (Table 4).
Table 4--Summary of changes in storage in well field
| Period from Aug. 30. 1940, to: |
Area affected by pumping (acres) |
Net reduction in storage (acre-feet) |
Quantity of water discharged by pumping (acre-feet) |
Percentage of total water pumped that has come from storage within well-field area |
|---|---|---|---|---|
| Jan. 1, 1944 | 32,300 | 33,390 | 51,600 | 66 |
| Jan. 1, 1948 | 34,700 | 49,800 | 135,800 | 37 |
| Jan. 1, 1952 | 32,400 | 50,200 | 239,000 | 21 |
| Jan. 1, 1955 | 66,000 | 111,000 | 330,000 | 33 |
The amount of annual recharge has varied since 1940 and will continue to vary from year to year in response to precipitation and drought. The average rate of recharge in the well-field area from 1938 to 1943 was estimated by Williams and Lohman (1949, p. 129) to be about 20 percent of the precipitation, or a rate of 320 acre-feet per year per square mile. Before pumping by the city of Wichita began, much of this recharge was returned to the atmosphere by evaporation and transpiration or moved out of the area as base flow in streams. After pumping by the city of Wichita began, some water that would have been discharged by natural processes was diverted to the pumped wells. The amount of water diverted is the effective rate of recharge as far as the well field is concerned. The average effective rate of recharge during the period September 1, 1940, to January 1, 1948, was about 200 acre-feet per square mile per year. (See data in Table 4.) By January 1, 1952, the average rate of effective recharge for the whole period of record had increased to about 285 acre-feet. By January 1, 1955, the average for the whole period had decreased to about 147 acre-feet. During the period of abundant precipitation, January 1,' 1948, to January 1, 1952, the effective average rate of recharge was about 470 acre-feet. The effective rates of recharge for the 15-year period are lower than the average recharge rate (320 acre-feet per square mile per year) because a part of the water that recharges the ground-water reservoir is being discharged by natural processes. When sufficient water is removed from storage, possibly water can be diverted from streamflow or from evaporation and transpiration and salvaged by wells. During wet periods, the ground-water reservoir may become full and potential recharge may be rejected. As a result of the high water table in 1951, ditches were excavated to drain the excess ground water in parts of the well field.
Where the water table stands at or near the surface, large quantities of water may be discharged by evaporation and transpiration. Where this condition prevails, removal of ground water by wells can increase the effective rate of recharge by lowering the water level beyond the influences of evaporation and transpiration.
Ultimately, the perennial yield of the Equus beds area and the well field will depend on the average annual recharge. The perennial yield of the Equus bed area is not known, but it is known to be much larger than the present use of water.
The use of ground-water reservoirs can be augmented by artificially increasing the rate of recharge; if the normal rate of recharge can be increased by artificial means, the perennial yield can be increased. A large quantity of water is available in storage in the well field to provide a perennial supply of water during drought periods. During periods of abundant precipitation, the well field probably could be recharged with runoff water.
Artificial recharge increases the rate of recharge into the underground reservoir by some method of artificially changing natural conditions. Four major methods of artificially recharging a groundwater reservoir are:
Artificial recharging can be done by one or more methods or by a combination of all methods. Each method has advantages and disadvantages dependent upon local conditions of climate, surface and subsurface geology, and quality of water available for recharging. The geology of some parts of the well field is most suitable for water spreading or for recharge through pits and other excavations. The geology of other parts of the well field is more suitable for induced recharge from streams. The local geology must be analyzed in order to select the best method.
An aquifer can be recharged by surface application of water only where the material above the aquifer is permeable and the water may move readily downward to the zone of saturation. The area least suitable geologically for water spreading or flooding coincides with the distribution of the Sappa member of the Meade formation, which underlies the north end of the well field (Fig. 6).
Three sources of water may be available for artificially recharging the Equus beds area--Arkansas River, Little Arkansas River, and Kisiwa Creek. The availability of water from Arkansas River and Little Arkansas River will depend on the quality of the water in the rivers.
The average daily discharge of Arkansas River at Wichita during the period 1934 through 1951 was 1,203 cfs. The maximum discharge during the period was 27,600 cfs on July 1, 1951. The minimum discharge during this same period was 3 cfs on September 3, 1934.
The water in Arkansas River is, in general, of poor quality. At low stages the water is hard and high in chloride and sulfate. Little is known about the quality of the water at high stages, but although it contains large quantities of sediment it is assumed to be of much better chemical quality than at low stages. The relation between stage and quality should be determined. Should the water at high stages be of acceptable quality, it could be used for artificially recharging the well-field.
Data collected by the State Board of Health and the City of Wichita water department indicate that the quality of the water in Little Arkansas River may be suitable for recharging, but the quality is inferior to that of the water in the Equus beds.
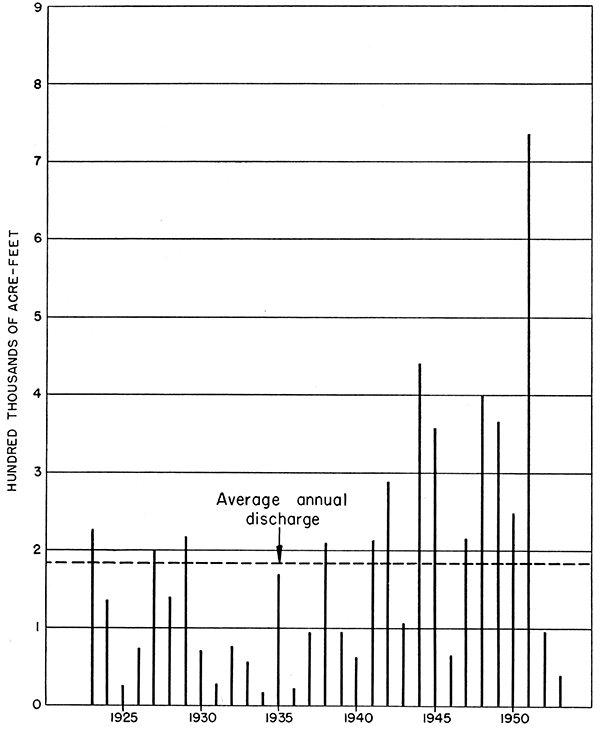
A hydrograph of the monthly mean and minimum daily discharge of Little Arkansas River is shown in Figure 9. A hydrograph of the annual discharge of Little Arkansas River at Valley Center is shown in Figure 22. The daily discharge of Little Arkansas River is often equal to the daily use of water by the city of Wichita. During the period of record, the minimum daily discharge of the river has been less than 10 cfs (6,463,000 gallons a day) at only a few times. The ground-water profile across the well field as of January 1, 1955, was toward Little Arkansas River (Fig. 8 and 26), and water was being discharged into Little Arkansas River from the well field. The gradient from the well field has been reduced since pumping began (Fig. 26), and, accordingly, the discharge of ground water into the stream has been reduced. No water has moved yet from the river toward the well field, but when the water table in the well field declines about 10 feet more, the hydraulic gradient will be from rather than to the river, and water will then move from the river westward to the well field.
Figure 22--Annual discharge of Little Arkansas River at Valley Center, 1923-53.
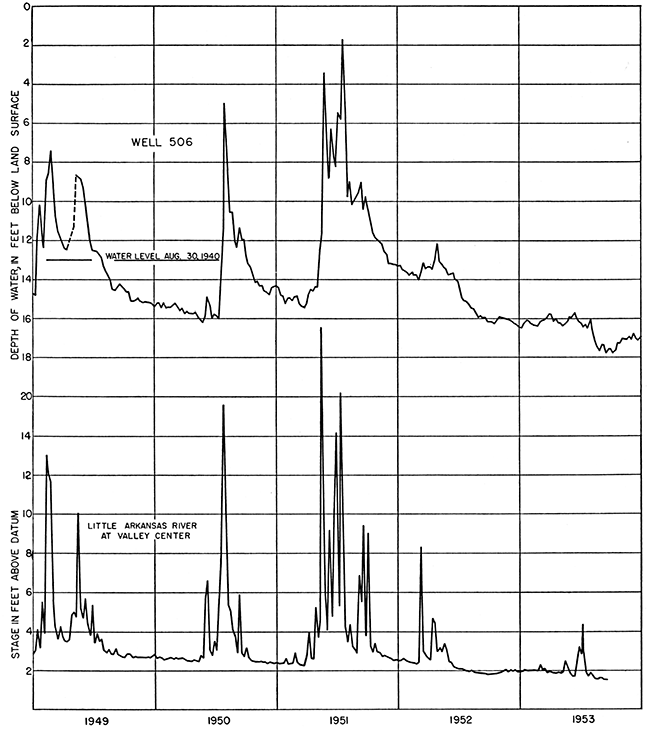
Data are not available for determining the rate at which influent seepage from Little Arkansas River may occur. The effect on observation well 506 in sec. 28, T. 23 S., R. 2 W., of pumping the Harvey Hensley irrigation well in sec. 22, T. 23 S., R. 2 W., indicates that the stream bed at low stages is relatively impervious. Little Arkansas River flows between these two wells. Well 506 is equipped with an automatic water-stage recorder. When the Hensley well is pumped the water level in well 506 declines. If the stream bed were highly permeable, stream water would flow through it to the expanding cone of depression and the cone would not expand beyond the river. The extension of the cone of depression beyond the river indicates that, at least during low stages of the river, little leakage occurs. During flood stage, the stream bed probably is scoured enough to permit some infiltration-perhaps a large amount.
The relation of the stage of Little Arkansas River to the water level in well 506 is shown in Figure 23. During low stages of the river, ground water moves eastward toward the river. During high stages of the river, water moves from the river to the ground-water reservoir (bank storage), but, as the stage of the river declines, the gradient is reversed and most of the bank storage is slowly discharged back into the river.
Figure 23--Relation between stage of Little Arkansas River and water-level in well 506, 1949-53.
Kisiwa Creek is a source of recharge to the well field. The creek is dry during drought periods, but, during periods of high precipitation, overland runoff flows down the creek and helps recharge the dewatered section that lies below and adjacent to the creek. Maximum use could be made of the flow of Kisiwa Creek by developing it so that no water flows out of the well field.
Ground-water storage depends on the saturated thickness of the water-bearing material and the specific yield of the material. Water in storage is available for use during drought periods.
Figure 24 is a saturated-thickness map of the Equus beds area. The map was prepared by superimposing the water-table contour map prepared by Williams and Lohman for 1940 on the bedrock contour map and drawing contours through points of equal thickness. The contour showing zero thickness represents the line of contact where the water table passes from the unconsolidated deposits and abuts on the underlying Permian rocks. The total volume of water in the saturated water-bearing materials in the Equus beds area is about 75 million acre-feet. If the material has a specific yield of 20 percent, a total of 15 million acre-feet of water theoretically is available from storage. From a practical standpoint, when less than half the 15 million acre-feet has been pumped from storage, the yields of wells will diminish and further pumping may be economically unfeasible. Hence, probably not more than about 6 to 8 million acre-feet of water can be pumped economically from storage in the Equus beds area.
A small part of the quantity of water in storage is of poor quality, principally owing to the presence of chloride salts, and must be subtracted from the total supply available. The principal areas where the water is of poor quality are near Burrton and in the Arkansas River valley. The water at relatively shallow depths is generally of satisfactory quality for most uses, but the quality becomes progressively worse with depth. The Burrton area is upgradient from the Wichita wells, and if the mineralized water at Burrton moves downgradient it will have a serious effect on the Wichita water supply. A chloride-sampling program to detect any movement of the poor-quality water from the Burrton area has been carried out since Wichita began pumping from the well field.
At the present rate of pumping by the city of Wichita, the water in storage alone, not considering recharge, would furnish the needs of the city for 200 years or more. However, the rate of use by the city undoubtedly will expand greatly. Black and Veatch (1952) stated that the city should anticipate an average daily use of 73 million gallons by 1985. At that rate, the water in storage would furnish the needs of the city for something like 100 years.
Since September 1940, approximately 111,000 acre-feet of water has been removed from storage by pumping by the city of Wichita. This is between 1 and 2 percent of the total volume in storage in the Equus beds area that is theoretically available for pumping. Profiles through the well field (Fig. 11) show the amount of water that has been taken out of storage since 1940 and that it has been relatively small compared to the total in storage. The saturated water-bearing materials (Fig. 24) have a maximum thickness of about 240 feet in the well field. In the channel entering from the west in Reno County the deposits have a saturated thickness of 320 feet.
Figure 24--Map showing saturated thickness of Pliocene and Pleistocene deposits in Equus beds area (prepared by C. K. Bayne).
A water-table contour map was prepared by Williams and Lohman (1949, pl. 1) for the well-field area for 1940. Since 1940, contour maps have been made periodically to measure the effects of Wichita's pumping on the water table. In recent years these contour maps have been made quarterly. Pumping by the city of Wichita since 1940 has produced a large cone of depression. As pumping continued the cone of depression became deeper and covered a larger area. The areal extent and depth of the cone of depression have been determined from maps of water-level change made by comparing the water levels in wells for any given time with the water levels in 1940.
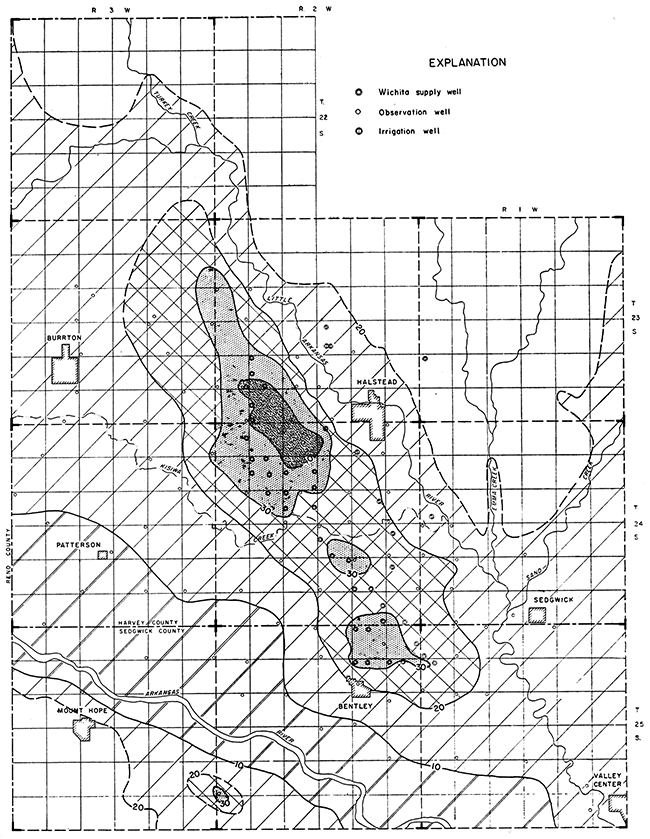
In an area of about 6 square miles the water table has declined more than 20 feet, and in an area of about 76 square miles it has declined more than 4 feet. The amount of areal decline of the water table since 1940 is shown in Figure 25. The boundary of the area affected by pumping is difficult to determine precisely. In Figure 25 the area affected by a given amount of decline is plotted against the decline. The curve defined by the known points is projected to the line of no drawdown, and the area obtained for the point of no drawdown is 100 square miles. (Table 5) Outside the area known to be affected by pumping, the water level on January 1,1955, was 3 or 4 feet lower than it was in September 1940, presumably owing to drought. The decline of the water level along two cross sections through the well field from 1940 to 1955 is shown in Figures 26 and 27.
Figure 25--Areal decline of water table in well-field area from September 1940 to January 1, 1955.
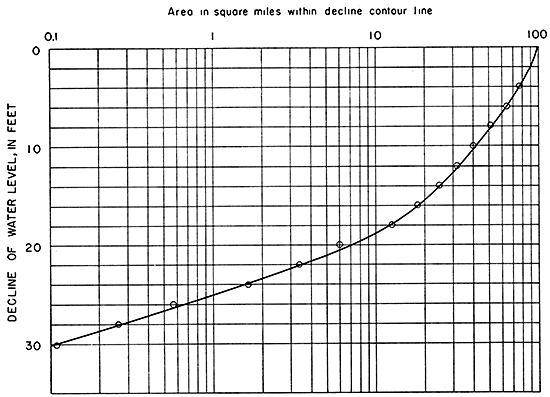
Table 5--Decline of water table in well field from August 1940 to January 1, 1955
| Area, in square miles, within contours of equal decline |
Contours of equal decline on Figure 31 |
|---|---|
| 0.1 | 30 |
| .3 | 28 |
| .6 | 26 |
| 1.6 | 24 |
| 3.4 | 22 |
| 6.0 | 20 |
| 12.5 | 18 |
| 18.0 | 16 |
| 24.8 | 14 |
| 31.8 | 12 |
| 40.0 | 10 |
| 51.0 | 8 |
| 64.2 | 6 |
| 76.0 | 4 |
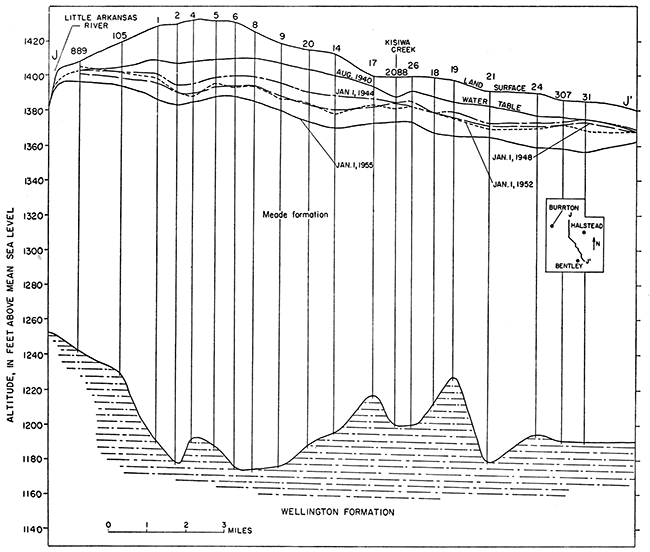
Figure 26--Cross section H-H' through well-field area, showing groundwater levels and thickness of saturated water-bearing materials.
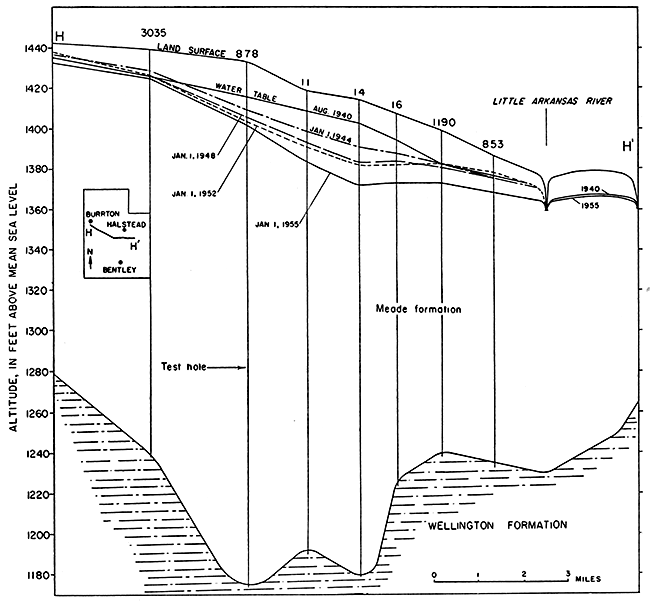
Figure 27--Cross section J-J' through well-field area, showing groundwater levels and thickness of saturated water-bearing materials.
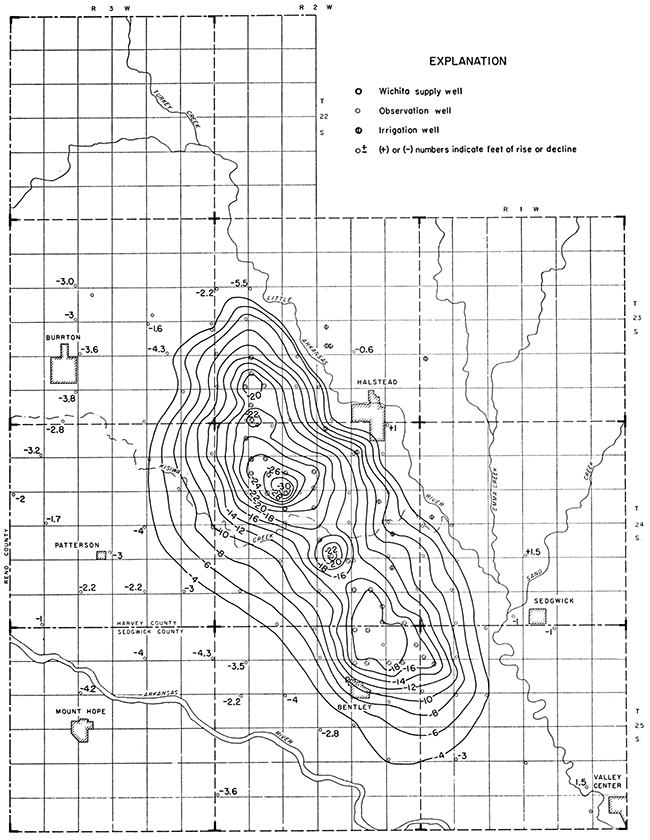
Figures 28, 29, 30, and 31 show lines of equal decline of water level in the well field from August 30, 1940, to the following dates: January 1, 1944; January 1, 1948; January 1, 1952, and January 1, 1955. From these maps the volumes of dewatered material were determined. To these volumes a value of 20 percent for specific yield was applied. The specific yield is the amount of water that will drain out of the saturated material when the water level is lowered. Williams and Lohman (1949) used a value of 25 percent for the specific yield. This value was based principally on laboratory determinations. The materials tested in the laboratory for specific yield consisted predominantly of gravel and sand. Because the ground-water reservoir is heterogeneous and stratified with zones of clay, a specific yield of 25 percent seems too high, and a lower value of 20 percent has been used in this report. The value of 20 percent was obtained by comparing change in storage with pumping. During October, November, and December, 1954, the monthly precipitation at Wichita was reported as 2.83 inches, a trace, and 0.18 inch, respectively. Hydrographs of wells not affected by pumping indicate that there was no recharge to the ground-water body during the 3-month period. The city of Wichita pumped 6,830 acre-feet of water from the well field during this same period. Using the water-level-change maps for October 1, 1954, and January 1, 1955, and a value of 20 percent for specific yield, it was determined that 7,250 acre-feet of water was removed from storage. The 420 acre-feet of water unaccounted for can be attributed to errors in the assumptions and to natural discharge.
Figure 28--Map of well field showing lines of equal change in water level from August 30, 1940, to January 1, 1944.
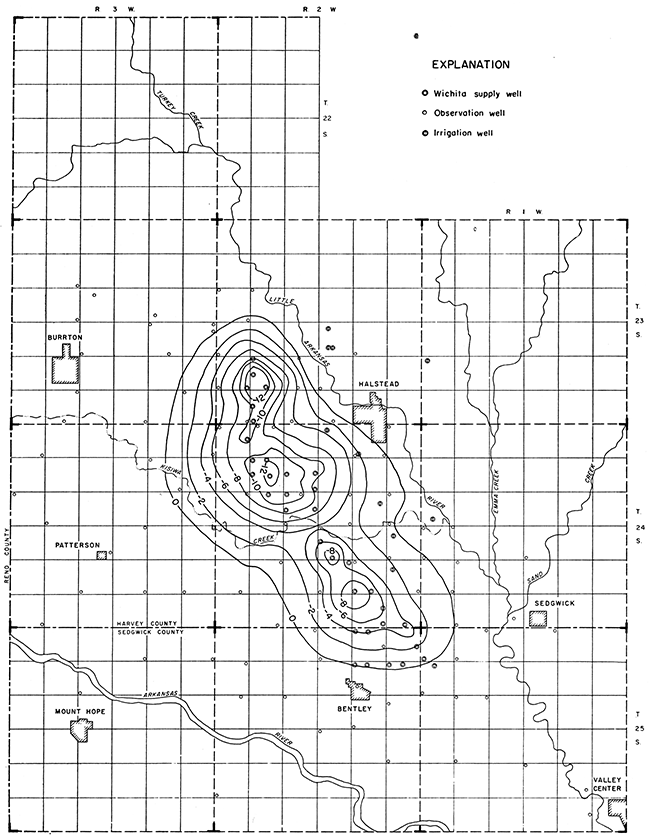
Figure 29--Map of well field showing lines of equal change in water level from August 30, 1940 to January 1, 1948.
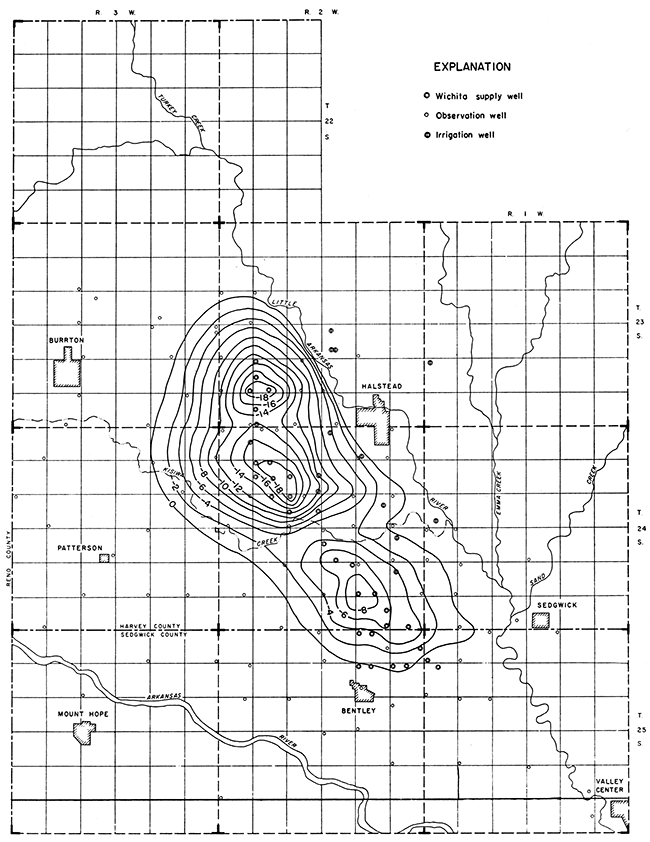
Figure 30--Map of well field showing lines of equal change in water level from August 30, 1940, to January 1, 1952.
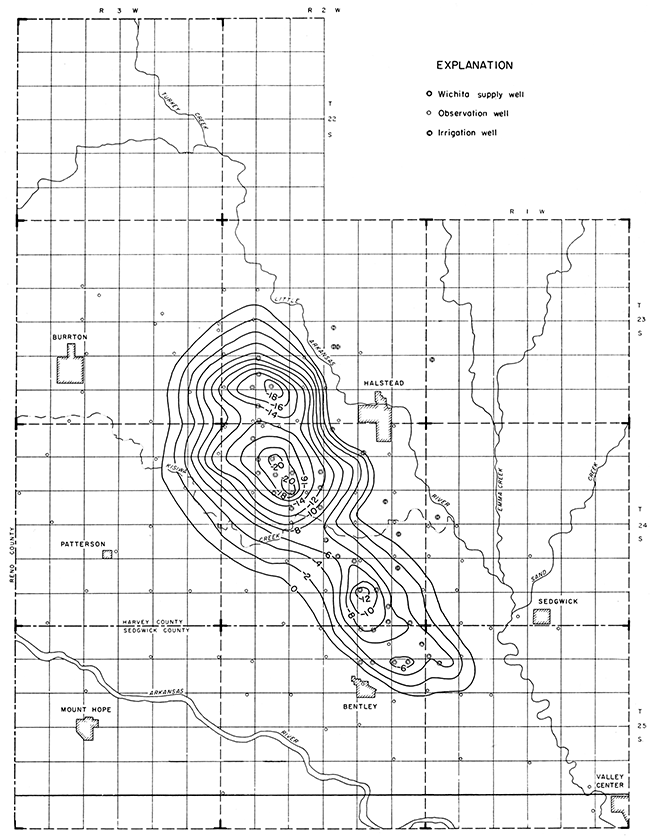
Figure 31--Map of well field showing lines of equal change in water level from August 30, 1940, to January 1, 1955.
During the period September 1,1940, to January 1, 1955, about 555,000 acre-feet of saturated material was dewatered in the well field. The decline of the water table in the well field during the period August 1940 to January 1, 1955, is given in Table 5 and shown graphically in Figure 25.
Table 4 summarizes the data contained in Figures 28, 29, 30, and 31.
Through the period August 30,1940, to January 1,1952,21 percent of the water pumped by the city of Wichita came out of storage and 79 percent came from recharge. In contrast, during the drought years 1953 and 1954, most of the water pumped was from storage, and, as a result, the average percentage of water pumped from storage during the entire period up to January 1, 1955, by the city of Wichita was about 33.
Two cross sections showing the original water level and the water level as of January 1, 1955, are shown in Figures 26 and 27. Figure 26 is a section in an east-west direction through the deepest part of the area of decline. Figure 27 is a section in a general north-south direction through the area of greatest decline. The cross sections show that the quantity of water discharged from storage is small in comparison with the quantity still in storage.
Figure 21 shows that the decline in the well field has not ceased. During the drought period of the last 3 years, the rate of decline of water level has accelerated, reflecting the reduction in recharge during this period. In the future, during periods of excess precipitation, recharge should add some water to storage and cause a rise in water level. However, in the well field and vicinity the checking of the water-level decline by recharge may be only temporary. If the present rate of pumping is maintained, the water level in the well field eventually will stabilize, but if pumping continues to increase, the water level will continue to decline. The quantity of water in storage will continue to fluctuate in response to changes in precipitation and pumping.
The potential perennial yield of the well field is larger than the present withdrawal by the city of Wichita. Only a part of the natural discharge in the well field is being intercepted by wells; some water is still moving past the well field toward Little Arkansas River. When the water table is lowered below the stream level of Little Arkansas River so that the hydraulic gradient slopes from the river to the well field, the direction of movement of the water will be reversed, and water will move toward the well field and become a source of recharge to it. The average annual recharge has been estimated to be about 320 acre-feet per square mile in the well field.
By January 1, 1955, the city of Wichita had pumped 330,000 acre-feet of water from the well field. This pumpage had resulted in a maximum decline in water level of 32 feet. The total area in which the water table is affected by the Wichita pumping is difficult to determine, but it is about 100 square miles. As of January 1, 1955, about 67 percent of the water pumped by the city of Wichita since pumping began in 1940 had been derived from recharge and the other 33 percent had been pumped from storage. The decline of the water table caused by pumping is small in comparison with the thickness of the saturated deposits.
The primary source of water for recharge to the Equus beds area is the local precipitation falling on the land surface, and physical conditions for recharge are excellent in most of the well field. Ultimately, the perennial yield will be dependent on the average annual recharge. Water in storage in the well field is available for use during drought periods. The water-bearing formation cannot be developed without some decline in water level. The higher the rate of withdrawal, the greater the lowering of the water table will be. Decline alone does not determine whether a water-bearing formation has been overdeveloped. Estimates of availability of water in the Equus beds area will necessarily be revised as the hydrology of the area becomes better understood.
Physical conditions in the well field seem to be excellent for some forms of artificial recharge. Additional data are needed before the best methods of artificial recharge and the suitability of the water for recharging can be determined.
If the present well field is expanded, a larger area will be influenced, and the perennial yield will be correspondingly larger. Additional supplies of water can be developed from the Equus beds area without depleting the supply, and the perennial yield is many times larger than the present use.
Bayne, C. K., Geology and ground-water resources of Reno County, Kansas (report in preparation). [available online]
Black & Veatch, Consulting Engineers, Kansas City, Missouri (1952) Report on long range water supply plan, Wichita, Kansas.
Fent, O. S. (1950) Geology and ground-water resources of Rice County, Kansas: Kansas Geol. Survey Bull. 85, p. 1-142, fig. 1-11, pl. 1-11.
Frye, J. C., and Leonard, A. B. (1952) Pleistocene geology of Kansas: Kansas Geol. Survey Bull. 99, p. 1-230, fig. 1-17, pl. 1-19. [available online]
Haworth, Erasmus, and Beede, J. W. (1897) The McPherson Equus beds: Kansas Univ. Geol, Survey, v. 2, p. 287-296, pl. 45-46.
Lohman, S. W., and Frye, J. C. (1940) Geology and ground-water resources of the Equus beds area in south-central Kansas: Economic Geology, v. 35, no. 7, p. 839-866, fig. 1-5.
U. S. Geological Survey, Water levels and artesian pressure in observation wells in the United States, part 3, North-central States: Issued annually as water-supply papers.
U. S. Geological Survey, Surface water supply of the United States, part 7, surface water supply of the lower Mississippi River basin: Issued annually as water-supply papers.
U. S. Weather Bureau Records (1953) Local climatological summary, Wichita, Kansas.
Williams, C. C. (1946) Ground-water conditions in Arkansas River Valley in the vicinity of Hutchinson, Kansas: Kansas Geol, Survey Bull. 64, part 5, p. 145-216, fig. 1-11, pl. 1-6. [available online]
Williams, C. C., and Lohman, S. W. (1947) Methods used in estimating the groundwater supply in the Wichita, Kansas, well-field area: Am. Geophysical Union Trans., v. 28, no. 1, p. 120-131, fig. 1-10.
Williams, C. C., and Lohman, S. W. (1949) Geology and ground-water resources of a part of south-central Kansas with special reference to the Wichita municipal water supply: Kansas Geol. Survey Bull. 79, p. 1-455, fig. 1-31, pl. 1-34. [available online]
Prev page--Introduction, Pumpage, Geology
Kansas Geological Survey
Placed on web June 11, 2015; originally published Dec. 1946.
Comments to webadmin@kgs.ku.edu
The URL for this page is http://www.kgs.ku.edu/Publications/Bulletins/64_5/page2.html