
Capillary Pressure Curves
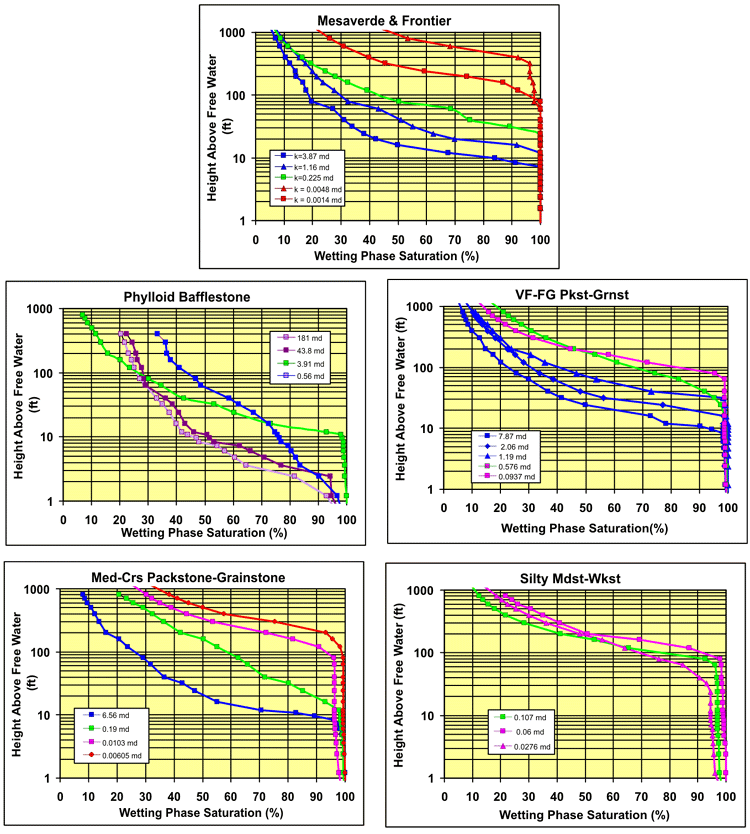
Example capillary pressure curves for Council Grove and Mesavede-Frontier
rocks illustrate that within each rock type the saturation at any given
capillary pressure generally decreases with increasing porosity and permeability,
as seen in many formations. Comparison between rock type figures shows that
as porosity and permeability generally increase with increasing grain size,
the pressure at which principal desaturation occurs decreases (the curves
flatten
towards the X axis) and the irreducible saturations decrease.
Last updated June 2004
http://www.kgs.ku.edu/PRS/publication/2001-33/P3-06.html