
|
Reservoir Characterization to Inexpensively Evaluate
the Exploitation Potential of a Small Morrow Incised Valley-fill
Field
|

Kansas Geological Survey
Open-file Report 2002-9 |
Reservoir Simulation
Input GeoModel
 |
|
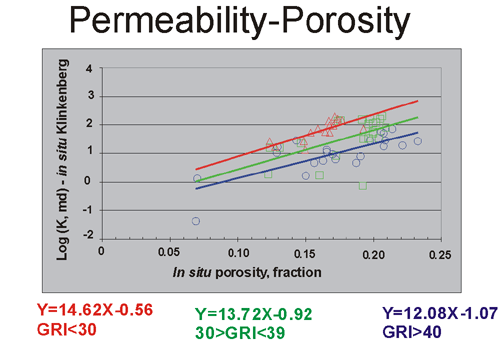
Porosity and gamma log readings were used to calculate permeability
for each sand body at each well. Selection of the log-linear
permeability-porosity correlation was based on the average gamma
log reading across a sand body. For high porosity values, the
above correlations project permeabilities in excess of 1 darcy.
The maximum permeability measured on Morrow core plugs, from
the Minneola Unit, was around 250 md. A permeability cut-off
of 500 md was used when the K (permeability) calculated from
the correlations exceeded 500 md. |
Capillary Pr. & Initial Sw
Equations of generalized capillary pressures were constructed
based on the relationships evident from the entry pressures in
air-mercury capillary pressure curves, the shape of these curves,
and from saturations evident in air-brine capillary pressure analysis.
The relationships between increasing entry pressure, “irreducible”
wetting phase saturations, and the capillary pressure curvature
(reflecting increasing heterogeneity in pore-throat sizes) with
decreasing permeability were utilized to develop equations that
would predict the capillary pressure curve using permeability
as the independent variable.
Corey-type correlations were developed to generate oil-water and
gas-oil relative permeability curves (5 sets) for rocks with different
permeabilities - 3 md, 10 md, 30 md, 100 md and 300 md.
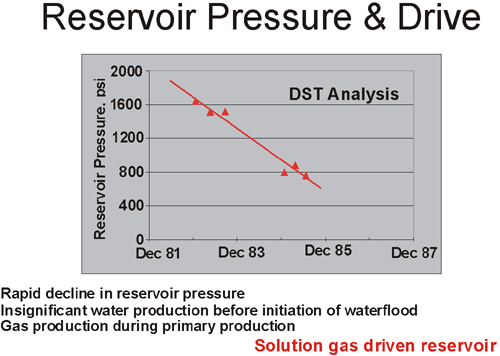
Minneola wells have no historic record of water production
during the primary phase. It was, therefore, assumed that the
initial Sw, obtained from wireline log analysis, at
each producing sand in each well was close to or equal to Swi
(irreducible water saturation). Each sand body at each well was
initially assigned a relative permeability-capillary pressure
set, from amongst the 5 sets, such that Swi value from
the set corresponded closely with log-derived Sw.
Simulation Strategy
The reservoir simulation study was conducted in two phases.
In the first phase, primary production was history matched. The
decline in reservoir pressure could be modeled when a gas-cap
was assumed to exist at the onset of field production. The process
of matching primary production enabled estimation of the initial
distribution of oil and gas saturation in the reservoir. During
the second phase, the secondary field production under water injection
was matched. This process helped to delineate the permeability
variation, existing laterally and vertically, in the reservoir
sands. Current fluid levels were available for most wells. Oil
production was input for each well and the simulator calculated
both the gas and water production. The simulator-calculated flowing
bottom hole pressure was matched with the fluid column recorded
at the corresponding well.
e-mail : webadmin@kgs.ku.edu
Last updated March 2002
http://www.kgs.ku.edu/PRS/Poster/2002/2002-9/P3-01a.html