Model for Environmentally and Economically Sound Linked Energy Systems
Kansas Geological Survey
Open-file Report 2002-6

|
Model for Environmentally and Economically Sound Linked Energy Systems |
Kansas Geological Survey Open-file Report 2002-6 |
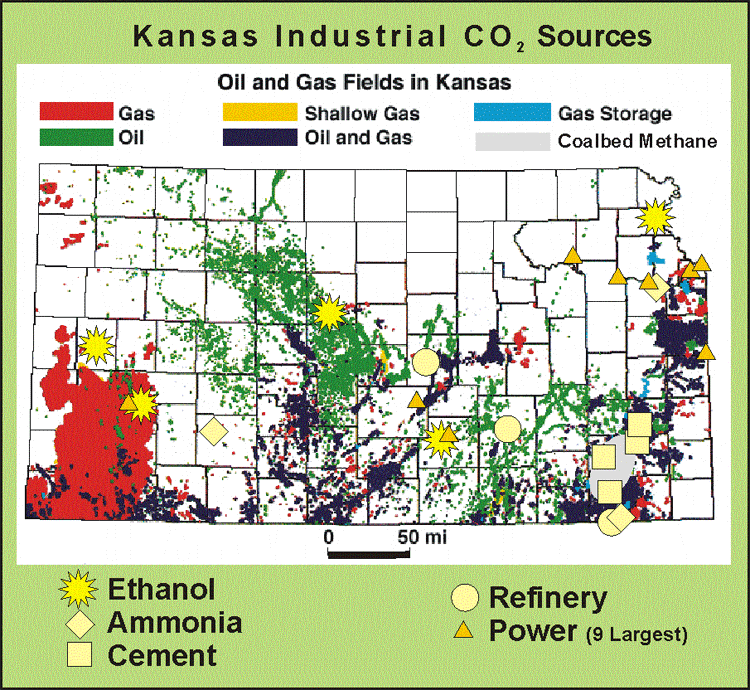
Relatively large volumes of Industrial CO2 are currently being utilized for EOR in the U.S. (Beecy, 2001). An example, the Enid Oklahoma fertilizer plant, delivers 35 MMCF/day,ten times the Russell ethanol plant output, but similar to quantities generated by the Kansas fertilizer and cement plants. Potential oversupply in the CO2 market due to increased ethanol production, growing interest in CO2 sequestration and the concern over falling domestic oil production may spur interest in industrial CO2 supply for EOR in Kansas and other areas throughout the U.S. where there is potenetial for “value added” geologic sequestration. The juxtaposition of major CO2 industrial sources with miscible and immiscible CO2 EOR and enhanced coalbed methane prospects makes Kansas an excellent laboratory for CO2 capture and geologic sequestration.


|
|
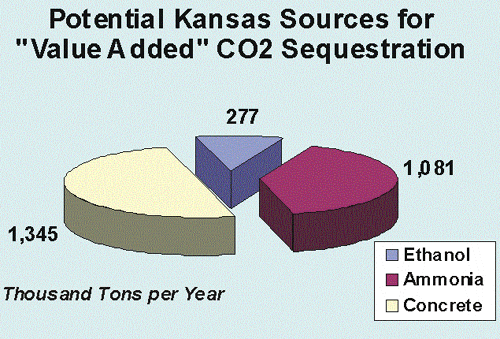
CO2 shown is from stochiometric proceses alone. (Ethanol-fermentation, Ammonia, Concrete - Calcination) |
| Facility | Production | |||||
| Product | Location (City) | Unit | Rating/Year (thousands) | Est 2002 Product (thousands) | Est 2002 CO2 Short Tons (thousands) | |
| Ethanol | Colwich | gallon ethanol | 20,000 | 20,000 | 66 | |
| Garden City | gallon ethanol | 12,000 | 12,000 | 40 | ||
| Leoti | gallon ethanol | 1,500 | 1,500 | 5 | ||
| Russell | gallon ethanol | 25,000 | 25,000 | 83 | ||
| Atchinson | gallon ethanol | 25,000 | 25,000 | 83 | ||
| Total | 277 | |||||
| Ammonia | Coffeyville | tons ammonia | 402 | 361 | 455 | |
| Dodge City | tons ammonia | 292 | 277 | 350 | ||
| Lawrence | tons ammonia | 365 | shut down | 0 | ||
| Total | 805 | |||||
| Concrete | Independence | tonnes concrete | 311 | 295 | 163 | |
| Fredonia | tonnes concrete | 475 | 451 | 249 | ||
| Chanute | tonnes concrete | 1,500 | 1,000 | 552 | ||
| Humboldt | tonnes concrete | 725 | 689 | 380 | ||
| Total | 1,344 | |||||
| Refinery | Coffeyville | bbls of oil refined | 40,880 | 36,792 | ? | |
| El Dorado | bbls of oil refined | 38,235 | 34,493 |
|
||
| McPherson | bbls of oil refined | 28,251 | 25,426 | |||
| Total | ? | |||||
| Thousand Tons Per Year | 2,426 | |||||
Production data sources include vanOss (2001), EOIA (2001), RFA (2002), Chanute Tribune (1999), and personal communications, Wright (2002) and Videgar (2002).
CO2 shown is from stochiometric proceses alone.
(Ethanol-fermentation, Ammonia, Concrete - Calcination)
|
|
e-mail : webadmin@kgs.ku.edu
Last updated March 2002
http://www.kgs.ku.edu/PRS/Poster/2002/2002-6/P3-05.html