
|
|
|
| Description | Java Source Download | Website Download | Copyright & Disclaimer | |
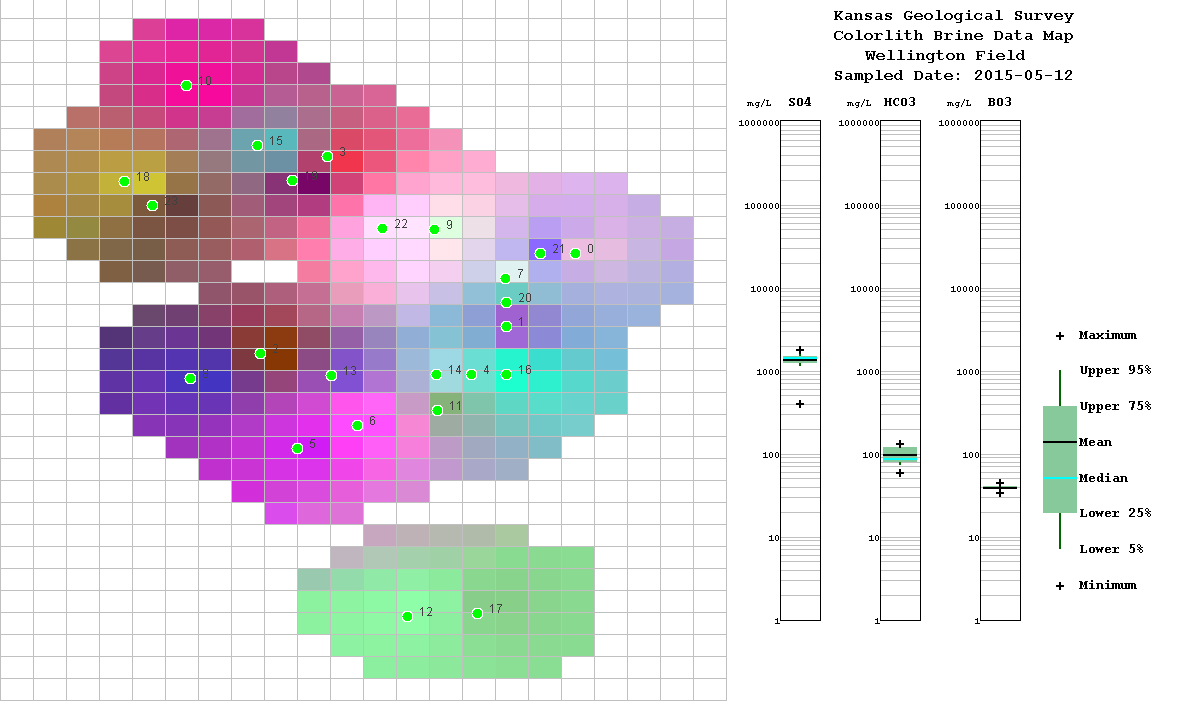
This gridding and mapping module allows the user to plot the brine data for the CO2 Project Wells Map. The map displays a colorlith presentatiion of the brine data, i.e. 3 brine data curves mapped to 3 colors Red, Green and Blue respectively and mixes the color to reflect the general chemistry. The idea is that by picking and plotting the right three curves that may be especially sensistive to the brine chemistry and reflect the CO2 interaction and see a change in the presentaion on the map by the color change.
The map below shows the mixing of (Sulfate, Bicarbonate and Borate) as a mix of (Red, Green and Blue) respectively. This program allows the user to modify the minimum and maximum of each of the colors to reflect the best presentation of the data change over the well map. The bar and whisker plot reflect the statistics of the data, i.e., Minimum, Maximum, Mean, Medium, etc.
Gridding Algorithm
The interpolation algorithm is a simple inverse distance weighted averaging algorithm as described in Davis (1986). By default an inverse distance-squared weighting is used, but you have the option of changing the exponent (Inverse Distance Weighting Exponent on the Gridding Parameters Frame) so that, for example, you could use inverse distance (exponent=3) weighting. The effects of varying the exponent are described in Davis (1986). A simple nearest neighbor search is employed. The maximum number of nearest data points to use in estimating the parameter value at a grid node is specified as Number of Nearest Neighbors in the Gridding Parameters Frame. By default, eight nearest neighbors are used. Two additional parameters that control the search algorithm are the maximum allowable distance from the estimation point (grid node) to the nearest data point (Maximum Distance to Nearest Data Point) and the maximum search radius (Maximum Search Radius). If no data points are found within the maximum allowable distance to the nearest data point, then the algorithm will search for data points until either the number of data points specified in the Number of Nearest Neighbors box is found or until there are no points left within the specified maximum search radius, whichever happens first. The default value for the maximum allowable distance to the nearest data point is set so that, on average, twice the number of data points specified as Number of Nearest Neighbors would fall within this radius assuming a uniform distribution of data points across the map area. The default maximum search radius would contain, on average, five times the specified number of nearest neighbors under the same assumption. These are the same criteria used to set the default search neighborhood values for the nearest neighbor search in Surface III (Sampson, 1988).
|
References
|
 |
| Author: John R. Victorine jvictor@kgs.ku.edu
The URL for this page is http://www.kgs.ku.edu/Ozark/JAVA_SRC/BRINE_MAP/index.html |
 |
 |