Kansas Geological Survey, Open-file Report 2001-50
by
Margaret A. Townsend
KGS Open-file Report 2001-50
The city of Oberlin, Kansas, contracted with the Kansas Geological Survey (KGS) to use the natural abundance nitrogen-15 isotope method to try to identify sources of nitrate in city wells. The city has a history of nitrate-nitrogen (nitrate-N) above the U.S. EPA drinking water limit of 10 mg/L (U.S. EPA, 2001). This method has been used successfully in Kansas for the past 10 years (Townsend et al., 1996). Work with the method indicates that animal/human-waste sources in alluvial areas frequently have elevated chloride concentrations associated with elevated nitrate.
The sampling for the study was done in March 2001. Five city wells, one irrigation well used for a golf course, one well for a youth ranch, and one stream sample from Sappa Creek were sampled with assistance of City of Oberlin personnel. The wells pumped until the specific conductance and pH stabilized for three consecutive readings. For most of the wells this occurred within 10 minutes. Two of the wells, numbers 5 and 6, are not currently used by the city. These two wells were pumped for approximately 15-20 minutes until the water ran clear, and then the water was tested for specific conductance until the readings stabilized. The sample from Sappa Creek was collected using a clean bucket lowered into the middle of the creek from a bridge.
Complete inorganic water analyzes were performed by the Analytical Services Section of the KGS. The stream sample was filtered using a 45p Micropore© filter prior to chemical analysis. Dr. Steve Macko, Dept. of Environmental Services, University of Virginia, did nitrogen-15 isotope analyses. Samples of the dried nitrate-containing salts were combusted at high temperature to nitrogen gas for analysis of their isotopic compositions.
Soil cores were collected to approximately 15 feet near the seven well sampling points. Cores were taken using a Giddings press probe. Jim McDowell, Soil Scientist with the Hays NRCS field office, described cores in the field.
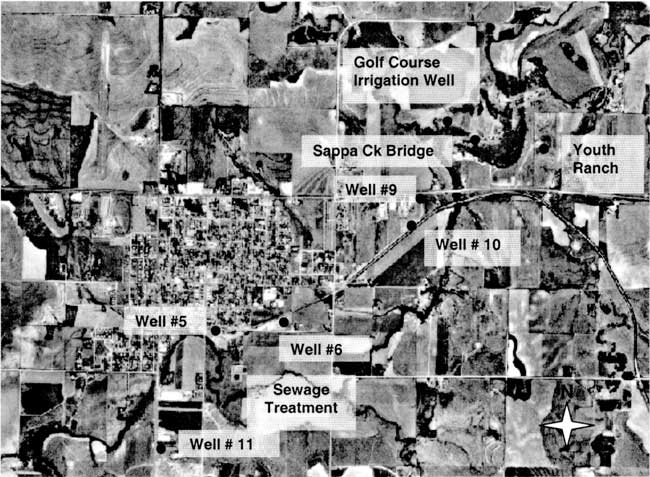
The city of Oberlin is located in Decatur County in northwestern Kansas. The area is generally a mix of irrigated and dryland farming with rangeland and feedlots also present. Figure 1 shows an orthophoto view of the city and surrounding area with sampling points marked. Sappa Creek is the main surface drainage through the area (southwest to northeast of city in figure 1).
Figure 1--Orthophoto of City of Oberlin, Kansas with sampling points labeled (DASC, 2001) Photo shows agricultural land use surrounding the city. Note sewage treatment site south of city.
The geology of the area consists of alluvial sediments and the overlying Pleistocene loess deposits and the Ogallala Formation in the upland areas (figure 2). In the vicinity of Oberlin, the wells are sited in the alluvial sediments of Sappa Creek. The wells range in depth from 50 to 80 feet deep (Appendix A).
Figure 2--Geology of Decatur County. Study area outlined in black. Alluvium is red; Loess is yellow; Ogallala is green.
Soils in the area are generally alluvial in origin and consist of the Bridgeport silt loam or Holdrege silt loam soils (figure 3, table 1). The Bridgeport series consists of deep, well-drained, moderately permeable soils on stream terraces and alluvial fans and are formed in calcareous, silty alluvium (Hamilton et al., 1989, USDA NRCS, 2001). The Holdrege series consists of deep, well-drained, moderately permeable soils on uplands and is formed in loess.
Figure 3a--Soils in Decatur County. Soils in Oberlin area include Bridgeport silt loam and Holdrege silt loam. Alluvial soils occur in the Sappa Creek valley (olive green on figure).
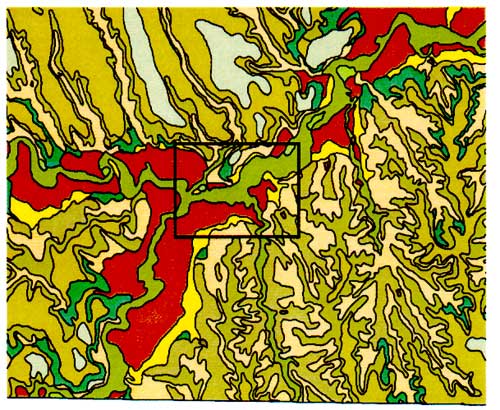
Figure 3b--Bridgeport soil series. Figure shows that the dominant soil fractions are silt and sand with a lower percentage of clay.
Figure 3c--Holdrege soil series shows that the dominant soil fractions are silt, clay, and sand. Ths soil has more clay in the upper zones than the Bridgeport silt loam.
Table 1--Soil descriptions from cores taken near sampled wells Oberlin, Kansas. Soil descriptions by soil scientist from NRCS office, Hays, Kansas.
| Bridgeport silt loam Well #11 and Well #5 | |||
|---|---|---|---|
| Horizon | Depth (inches) | Texture | Remarks |
| Ap | 0 to 7 | silt loam | non calcareous |
| Ap | 7 to 17 | silt loam | non calcareous |
| Bw | 17 to 22 | silt loam | moderate effervescence |
| 2Bwb | 22 to 62 | silt loam | moderate effervescence |
| 3Bwb | 62 to 179 | silt loam | moderate effervescence |
| 4Bwb | 179 to 189 | silt loam | violent effervescence |
| Site 3 Bridgeport silt loam Well #6 | |||
| Horizon | Depth (inches) | Texture | Remarks |
| Ap | 0 to 7 | silt loam | moderate effervescence |
| A | 7 to 31 | silt loam | moderate effervescence |
| Bw | 31 to 69 | silt loam | moderate effervescence |
| C | 69 to 74 | loamy sand | moderate effervescence |
| 2Bw | 74 to 103 | silty clay loam | moderate effervescence |
| 2BC | 103 to 149 | silt loam | moderate effervescence |
| 2C | 149 to 189 | sand & gravel | |
| Site 4 Bridgeport silt loam Wells 9 & 10 | |||
| Horizon | Depth (inches) | Texture | Remarks |
| Ap | 0 to 8 | silt loam | non calcareous |
| A | 8 to 20 | silt loam | non calcareous |
| Bw | 20 to 27 | silty clay loam | slight effervescence |
| Bk | 27 to 36 | silt loam | violent effervescence |
| BC | 36 to 71 | silt loam | violent effervescence |
| 2C | 71 to 104 | sandy loam | violent effervescence |
| 3C | 104 to 187 | silt loam | violent effervescence |
| Site 5 Bridgeport silt loam Golf Course Irrigation Well | |||
| Horizon | Depth (inches) | Texture | Remarks |
| A1 | 0 to 13 | silt loam | non calcareous |
| A2 | 13 to 34 | silt loam | non calcareous |
| Bw | 34 to 48 | silt loam | violent effervescence |
| Bk1 | 48 to 112 | silt loam | violent effervescence |
| Bk2 | 112 to 140 | silt loam | violent effervescence |
| BCk | 140 to 189 | silt loam | violent effervescence |
| Site 6 Holdrege silt loam Youth Ranch | |||
| Horizon | Depth (inches) | Texture | Remarks |
| Ap | 0 to 7 | silt loam | non calcareous |
| Bw | 7 to 17 | silty clay loam | non calcareous |
| Bt | 17 to 31 | silty clay loam | non calcareous |
| Bk | 31 to 66 | silt loam | violent effervescence |
| BCk | 66 to 109 | silt loam | violent effervescence |
| C | 109 to 189 | silt loam | violent effervescence |
Both soils have predominantly silt-size fraction with variable amounts of sand and clay. Permeability is moderate (0.6 to 2 inches/hour). These soils have slow permeability but water can still move through the soils. Table 1 indicates that these soils have a strong calcareous component as indicated by various degrees of effervescence. This characteristic indicates that the soil chemistry changes with depth and becomes more basic. The implications of this will be discussed in the water chemistry and nitrogen isotope sections.
As indicated in figure 1, irrigated and dryland farming are the dominant land uses in the area. In addition, the city has a golf course northeast of the city, and hog and cattle operations are located throughout the area. Figure 4 shows the irrigation water rights for Decatur County and the tons of all fertilizers (predominantly nitrogen types) sold. As can be seen, there has been some increase in water rights issued in the county over the years with fertilizer use increasing as irrigated farming has increased. The area was placed under a water right moratorium in 1984. Obtaining additional water rights has involved moving current rights to new locations.
Figure 4--Irrigation water rights for Decatur County and tons of all fertilizer types sold since 1950. Data are from the Water Information Management and Analysis System (Wilson, 1998) and from the Kansas Department of Agriculture (2001).
Figure 5 shows the land use near the sampled wells. Ground-water flow is to the north-northeast as indicated by the arrow in the figure. Surface-water flow is to the northeast as indicated in figures 1, 2 and 3. U.S. Geological Survey stream-flow records for Sappa Creek indicate little flow in the creek after the mid-1980s. The creek does not flow in the headwaters south of Oberlin. Treated wastewater from the city sewage-treatment plant (south of city in figure 1) contributes to the flow of Sappa Creek north of the city. At the Sappa Creek bridge at the golf course, water was flowing at the time of sampling in March 2000.
Figure 5--Land use near sampling points. Light-gray bars are irrigated land, dark-gray bars indicate dryland, and solid gray is a small feeder calf feedlot. Light-blue lines indicate year 2000 interpolated water-level measurements (KGS, 2001).
Figure 6 shows a tri-linear diagram of the water chemistry of the area. The water in the Oberlin, Kansas, area is generally a calcium-bicarbonate-sulfate water type (wells 5, 6, 9, 10, 11 in oval, figure 6.). The Youth Ranch well has the highest nitrate concentration in the study (Appendix A). The Golf course well has a reducing-type water as evidenced by iron and manganese (Appendix A). All of the wells have total dissolved solids concentrations greater than 500 mg/L (Appendix A). The Sappa Creek sample shows an influence of higher chloride, which may be a result of evaporation concentration of surface water runoff and possibly a contribution from the sewage-treatment lagoon discharge into the creek.
Figure 6--Tri-linear diagram of water chemistry from Oberlin, Kansas area. Values are in percentages (Hem, 1985). Chemistry shows a similarity within the circle on the graph. Sappa Creek has the highest chloride concentration (Appendix A).
The contribution of sulfate, chloride, and bicarbonate to the specific conductance is illustrated in figures 7 and 8. Figure 7 shows the parallel relationship of chloride, sulfate, and bicarbonate with increasing specific conductance readings. This type of relationship suggests that evaporation and concentration of water as well as dissolution of salts within the unsaturated zone are responsible for the high concentration of samples at the sites that are near dryland and irrigated farming (Appendix A; figure 5). Figure 8 shows the clustering of the sulfate/chloride (SO4/Cl) ratios of the ground water samples relative to the Sappa Creek surface-water sample suggesting that there are different processes contributing to the two types of water. All of the samples fall within the range of 0-50, which suggests that evapoconcentration has an impact on the ground water (Whittemore, 1995).
Figure 7--Figures shows the contribution of chloride, bicarbonate, and sulfate t specific conductance readings of ground water from Oberlin, Kansas, area. Sappa Creek has the highest readings because of runoff and evapoconcentration effects in surface water.
Figure 8--Graph shows sulfate/chloride range of 0.5 (surface water) to 2.75, which is within the range shown by Whittemore (1995) to be affected by evapoconcentration.
Figure 9 shows an increasing positive relationship between nitrate-N and chloride concentrations for alluvial sites across Kansas. The relationship illustrated in figure 9 is based on samples collected at sites affected by animal- or human-sewage waste (Townsend and Young, 2000). These sites had documented field observations that a septic system, feedlot, or waste storage area was located within the sphere of influence of the wells investigated. The regional ground water in these areas had chloride concentrations that were less than 100 mg/L so the increased concentration in a particular sample was observable in contrast to the surrounding water quality.
Figure 9--Nitrate-N and chloride concentration from alluvial sites with enriched nitrogen-15 values from animal-waste sources (Townsend and Young, 2000). Graph indicates general co-increase of nitrate and chloride from sites. Oberlin well data are not included on this graph.
Figure 10 illustrates an opposite relationship for the Oberlin wells. These sites have no known or observable animal waste sources near the well (unless manure is used and the source not reported) and the chloride concentrations generally show a negative relationship with high nitrate-N and low chloride (less than 100 mg/L), and low nitrate-N and high chloride. Although the nitrogen-15 values for these sites are generally enriched (see next section) the lack of nitrate and chloride concentration suggests a non-animal source for the nitrate and the possibility of a bacterial affect on the nitrogen-15 values.
Figure 10--Nitrate-N and chloride from alluvial sites near Oberlin, Kansas, with enriched nitrogen-15 values. The data from these sites show a slight decreasing relationship with chloride suggesting that animal waste is not the likely source for these sites. Line indicated drinking water limit for nitrate-N of 10 mg/L (U.S. EPA, 2001)
Natural abundance nitrogen isotope analysis is a frequently used method to assist in determining sources of nitrogen to ground water. The isotope analysis involves establishing the ratio of nitrogen-15 (15N) to nitrogen-14 (14N) on the nitrogen in nitrate compared to the ratio observed in the standard, atmospheric nitrogen (air). Comparisons of these values indicate if there is more (positive) or less (negative) 15N in the sample. The values thus indicate whether the sample is enriched (+) or depleted (-) in relation to the standard.
Isotopic values are reported as δ15N in per mil (‰) (Hoefs, 2001):

Figure 11 illustrates the range of δ15N values for various sources of nitrogen and associated processes affecting the 15N abundance (Heaton, 1986). Generally, biological activities use 14N preferentially, resulting in an increased δ15N value in the remaining nitrogen. Previous work has shown that nitrate from commercial fertilizer sources has δ15N values of -2 to +8 ‰, from soil nitrogen a range of +5 to +7 ‰, and from animal waste generally greater than +10 ‰ (Heaton, 1986, Herbel and Spalding 1993). Other information such as dissolved oxygen, salinity, iron, and manganese concentrations, and proximity to potential sources, aid in source determination.
Figure 11--Range of δ15N values for various sources of nitrogen and the enrichment effects of denitrification and volatilization processes. Ranges of δ15N values from Heaton (1986) and site studies in Kansas (Townsend et al., 1996).
Figure 11 also illustrates the effects of processes in the nitrogen cycle on the resulting δ15N values. Sources such as fertilizer and legumes have very light δ15N signatures (-2 to +2 ‰). Ground water impacted by fertilizer frequently has measurable nitrate as well (generally greater than 3 mg/L in Kansas). Because of possible volatilization of anhydrous ammonia by bacteria, the δ15N values frequently are in the +2 to +8 ‰. Legume sources generally have low nitrate concentrations because the nitrogen is often tied up in an organic form and the plant nodules need to degrade before the nitrogen is released.
Other sources such as human-septic waste or animal waste (cow in figure 11) have starting δ15N values around +5 ‰. Because animal waste has a high ammonia component, the release of the ammonia when the waste is produced causes an immediate enrichment of the δ15N because the δ14N in the waste is released by volatilization. As a result, the δ15N of the remaining nitrogen is much higher, in the range of +10 ‰ or more. Generally with animal-waste sources, nitrate-N values are high (usually more than 10 mg/L) as well.
Volatilization also can occur in soils and rocks with carbonate zones. Carbonates can increase the pH of water towards 8.5, which means the water is more basic. In this range nitrate can be converted to ammonia gas. The lighter 14N isotope is released with the gas. The remaining nitrogen becomes enriched with δ15N of a higher value.
Another process that can result in an enriched δ15N value is denitrification. In this process, bacteria degrade nitrate to nitrogen gases that are released to the atmosphere. The 14N of the nitrate is utilized first resulting in an enriched δ15N in the remaining nitrate. Signs of possible denitrification are low nitrate values and enriched δ15N values.
Nitrogen-15 values from the Oberlin, Kansas, ground water were somewhat different than expected. In previous studies in other parts of the state, use of δ15N showed the general results as discussed above. In this study, there were no obvious or reported known sources of animal waste near the sampled wells. As shown in figure 12, the δ15N values for samples 9, 10, 5, and 6 are above +10 ‰. However, none of these sites, except well #6, have known or observed animal-waste sources nearby. Well #6 has a small calf feeder area near the well, which may be a possible cause for both the enriched δ15N and chloride. The discussion below is based on one round of sampling in the area. It is likely that another set of samples should be collected and evaluated to verify the values observed in this study.
Figure 12--Nitrate-N versus δ15N for samples from Oberlin, Kansas, area. Samples show general fertilizer source (less than +8 ‰) and enriched sources (greater than +10 ‰) that appear to be affected by volatilization and possible denitrification rather than animal-waste sources. USGS background level of 2 mg/L nitrate-N and drinking water limit of 10 mg/L nitrate-N are shown (Muller and Helsel, 1996; U.S. EPA, 2001).
The samples from the Youth Ranch and well #10 appear to be impacted by fertilizer use. The Youth Ranch well is adjacent to an irrigated field. The water right for the irrigation well indicates the possible use of the well since 1956. Both wells are shallow (around 50+ feet) with the depth to water measured at 22 feet in the irrigation well (Wilson, 1998).
The presence of a silt loam soil in the field to the east of the Ranch well and near the Ranch well suggests the potential of a long travel time from land surface to ground water. However, the use of irrigation would provide more water to move nutrients downward at a faster rate than natural recharge. Also, in other parts of northwestern Kansas, studies have shown the movement of "seasonal" nitrate through the soil profile (Townsend, 1995). This means that in the spring and summer water from irrigation would be available to move nutrients through the soil profile. Yearly seasonal applications of water and nutrients would provide a continuous, although intermittent source, through the unsaturated zone. Because of the irrigation, flow might be somewhat faster than expected with just natural recharge. In addition, the irrigation water may have altered the chemistry of the soil and soil water so that the calcareous zones did not cause volatilization reactions to enrich the δ15N signature.
Well #10 has a fertilizer signature as well as a low nitrate-N concentration. This site has dryland farming completely around the well and irrigated farming located to the east across the railroad tracks (figure 5). According to the report done by Miller and Associates and discussion with the city administrator, Well #10 is the principal source of water for the city when used in conjunction with Well #11 at the south of town (figures 1, 5). This well is utilized more than the nearby Well #9.
Possibly the nitrate affecting this well is a combination from both the dryland and irrigated fields in the area. The elevated sulfate, chloride, and total dissolved solids for this well and Well #9 suggests the possibility that evapoconcentration of salts from farming around the wells and to the east of the well may be the source of these parameters. The lower δ15N value for this well may be related to increased flow to this well because of more frequent pumping and thus the possibility of pulling water impacted by the irrigated site to well #10. It might be useful to sample the irrigation well to the east to determine the nitrate concentration and δ15N value for this site to see if it is similar to that of well #10
Well #9 has a very low nitrate-N value but an enriched δ15N signature (figure 12). The land use at this well is the same as for well #10 (figures 1, 5). The difference between the two wells is that Well #9 is used intermittently due to reduced pumping capacity. This well is affected by seasonal water level fluctuations and by well #10 (Miller and Assoc., 1998). Well #9 was installed in 1969 and Well #10 in 1966. Neither well has a driller's log available.
Because of the intermittent use of the well, it is possible that denitrification may occur in the unsaturated zone or volatilization enrichment of the nitrate moving through the unsaturated zone may occur when the calcareous zones in the soil profile are encountered. The soil in this area is the Bridgeport silt loam and has a very effervescent zone at 10-15 feet depth (table 1).
Well #11 is located on the south side of the city of Oberlin (figures 1, 5). This well has a moderate nitrate-N level and an enriched δ15N value. This site is located near two long-term irrigation wells (1958 water right). The ground to the east of the well is dryland farmed. The site was in alfalfa for a number of years before being planted to another crop. The nitrate in this well has been low until about 1998 when the value increased to about 3.5 mg/L (City Administrator, personal communication, 2000). At this sampling for the study, the value is up to 4.0 mg/L.
The soil at this site is Bridgeport silt loam with a calcareous zone at the 10-15 ft depth. This site is similar to Well #9 where the nitrate-N is relatively low and the δ15N is enriched. This site had no obvious animal-waste sources near by. The well does not have elevated chloride although the sulfate is somewhat elevated and perhaps indicative of evapoconcentration of salts. There are two irrigated fields near the city well one to the west-southwest and one to the north-northeast. Because of the heavy reliance of the city on the water from this site, it is likely that the well is frequently pumped and this may result in movement of nutrients from the irrigated sites to the city well. At the time of this report, it is not known how large the sphere of influence from the pumping the well is.
It is possible at this site that the source of the nitrate is from fertilizer (irrigated site) or legumes (alfalfa dryland site) that have been volatilized in the unsaturated zone because of the long travel time and the contact with the calcareous zone deep in the soil profile. The nitrate concentration also may be increasing as legume nodules from the alfalfa-root zones are decaying. There is also the possibility of excess nutrients moving down the root channels left from alfalfa. These root channels can reach to depths of up to 15 or more feet (Lamond, personal communication, 1999).
At this site, the nitrate is gradually increasing. Because there is no obvious animal-waste source, the chloride concentration is low, sulfate appears somewhat elevated, and the δ15N value is elevated, it seems possible that volatilization enrichment of anhydrous ammonia fertilizer at the time of application and/or volatilization/denitrification reactions in the soil profile have resulted in the enriched δ15N value. The author's opinion is that agricultural practices and not animal waste is the most likely source.
Well #5 is located down gradient from the local fertilizer coop (figures 1, 5). The nitrate at this well is high; the δ15N value is slightly above +1O ‰. The chloride and sulfate concentrations are the lowest for any of the well samples (Appendix A). This well has not been used on a routine basis for many years. The site has additional contamination problems from a machine shop in the vicinity of the well. The soil at the site is a Bridgeport silty loam (table 1) with a calcareous zone at 10-15 feet depth. The site is asphalt covered around the well and the railroad passes just to the south of the well housing. There were no observable animal-waste sources near by except for the sewage-treatment lagoons to the south of Sappa Creek. Because of the low chloride concentration, it seems unlikely that animal waste is a source although this author cannot rule it out conclusively. The more likely cause is fertilizer from the Coop that may have spilled at some point in the past and is slowing migrating down to the ground water. The lower SO4/Cl ratio (figure 8) suggests that evaporation concentration of salts probably has not occurred at this site.
The nitrate in this well is high as is the δ15N value (+14 ‰). The chloride and sulfate concentrations also are elevated. There is a calf-feeder operation around this well (as evidenced by cow pies) as well as the high school playing field to the north of the well. This well is not utilized at present. Ground-water flow is generally towards the northeast. It is most likely that animal waste is the source of the nitrate at this site. The soil at this site has the calcareous zone found throughout the area. There is a possibility of volatilization enrichment also affecting the resultant δ15N value.
The golf course well is located to the northeast of the city at the municipal golf course. The well is located near Sappa Creek in an area that has not been farmed or irrigated. The well was drilled in the 1950s and is about 50 feet deep. The soil is the Bridgeport silty loam. The water chemistry at this site indicates reducing water chemistry. There is measurable iron and manganese. The sulfate is somewhat elevated, but the chloride is lower than samples from other wells.
The δ15N signature for this site was very light (+0.4 ‰) and near the standard value of 0 ‰. The vegetation at the site was predominantly grass with trees located closer to the creek. The very light signature and low nitrate concentration (0.2 mg/L) suggest that little modification of the nitrogen has occurred. This may be related to low nutrient concentration preventing bacterial development. The reducing chemistry of the water may also have an impact on the presence/absence of denitrifying bacteria. The nitrate at this site appears to be from the grass decay. This well is not impacted by nitrate.
The sampling point on Sappa Creek was at the bridge crossing the creek at the golf course. The nitrate value was low (1.6 mg/L; Appendix A) and the δ15N value was in the fertilizer range. The source of the nitrate is probably runoff from fields, lawn fertilizer in the city, or from the golf course. The high sulfate and chloride concentrations for the creek suggest that evaporation affects the creek chemistry. There is the possibility that the much higher chloride concentration at this site is impacted by the discharge of water from the sewage treatment plant. However, at this time no further investigation of the creek was undertaken.
Sources of nitrate in Oberlin ground water generally are from fertilizer. All of the wells except the Golf Course well appear to be impacted by the farming that occurs within close proximity to the wells. Well #6 may be impacted by presence of feeder calves around the well. Well #5 may be impacted by a fertilizer source at the nearby coop.
Irrigation water may permit nitrate from fertilizer to move more quickly through the soil profile and thus have less contact time with calcareous soils. The lack of contact time would result in a δ15N signature in the fertilizer range and not enriched by volatilization processes. Dryland farming may put nitrate into the system but delayed travel because of low natural-recharge results in decreased nitrate and possibly enriched δ15N because of calcareous soils. Volatilization enrichment from carbonates in the soils may explain the enriched δ15N values in areas where no obvious animal-waste source is present.
Data Access and Support System (DASC), 2001, MRSID Compressed Digital Ortho-photo Counties: http://www.kansasgis.org/ (accessed Sept. 2007).
Hamilton, V L., Angel, R. C., and Tricks, B.D., 1989, Soil survey of Decatur County, Kansas: U.S. Dept. of Agriculture USDS (Soil Conservation Service, now NRCS), 75 p.
Heaton, T. H. E., 1986, Isotopic studies of nitrogen pollution in the hydrosphere and atmosphere: a review: Chemical Geology, v. 59, p. 87-102.
Hem, J. D., 1985, Study and interpretation of the Chemical characteristics of natural water: U. S. Geological Survey, Water-Supply Paper 2254, 263 p.
Herbel, M. J., and Spalding, R. F., 1993, Vadose zone fertilizer-derived nitrate and δ15N extracts: Ground Water, v. 31, no. 3, p. 376-382.
Hoefs, J., 2001, Stable Isotope Geochemistry, 4th ed. Springer, 201 p.
Kansas Department of Agriculture, 2001, Kansas Department of Agriculture Records Center: http://www.ksda.gov/ (accessed Sept. 2007).
Kansas Geological Survey, 2001, WIZARD database water-level datasets: http://www.kgs.ku.edu/Magellan/WaterLevels/index.html (accessed Sept. 2007).
Miller and Associates, 1998, 1998 Water study for the city of Oberlin: Contract report to the city of Oberlin, 70 p.
Mueller, D.K., and Helsel, D. R., 1996, Nutrients in the nations' waters--too much of a good thing?: U.S. Geological Survey Circular 1136, 24 p.
Townsend, M. A. and Young, D. P., 2000, Assessment of nitrate-nitrogen distribution in Kansas ground water, 1990-1998: Natural Resources Research, v. 9, no. 2, p. 125-134.
Townsend, M. A., Sleezer, R. O., and Macko, S. A., 1996, Effects of agricultural practices and vadose zone stratigraphy on nitrate concentration in groundwater in Kansas, USA. Water Science and Technology, v. 33, No. 4-5, p. 219-226.
Townsend, M. A., 1995. Potential sources of nitrate in South Fork of Beaver Creek Watershed, Sherman County, Kansas: Kansas Geological Survey, Open-file Report 95-73. 25 p.
U.S. Dept. of Agriculture, National Resources Research Conservation Service, 2001, Soil Database web site: http://soils.usda.gov/ (accessed Sept. 2007).
U. S. Environmental Protection Agency, 2001, National Primary Drinking Water Standards: http://www.epa.gov/safewater/contaminants/index.html (accessed Sept. 2007).
Wilson, B. B., 1998, Water Information Management and Analysis System (WIMAS), ver.4, for Arc View User's Manual: Kansas Dept. of Agriculture, Div. of Water Resources, 35 p.
Whittemore, D. O., 1995, Geochemical differentiation of oil and gas brine from other saltwater sources contaminating water resources: case studies from Kansas and Oklahoma: Environmental Geosciences, vol. 2, no.1, p. 15-31.
| ID | Depth ft |
Sample Location |
Lab SP C** |
Ca mg/L |
Mg mg/L |
Na mg/L |
K mg/L |
Sr mg/L |
CO3 mg/L |
HCO3 mg/L |
SO4 mg/L |
Cl mg/L |
F mg/L |
B mg/L |
Fe mg/L |
Mn mg/L |
NO3-N mg/L |
δ 15N ‰ |
TDS* mg/L |
|---|---|---|---|---|---|---|---|---|---|---|---|---|---|---|---|---|---|---|---|
| Sappa Creek | 02-28W-31DBC | 2240 | 132 | 32.9 | 277 | 26.6 | 1.26 | 8.8 | 357 | 193 | 405 | 0.58 | 2.65 | 1.6 | 3 | 1525 | |||
| Well # 5 | 68.0 | 03-29W-01CBD | 1035 | 114 | 26.8 | 61.3 | 13.0 | 1.15 | 359 | 113 | 54 | 0.60 | 1.72 | 12.8 | 10.7 | 789 | |||
| Well # 6 | 68.0 | 03-29W-01D | 1700 | 192 | 45.2 | 106 | 24.6 | 1.86 | 482 | 268 | 137 | 0.54 | 2.19 | 10.2 | 14.7 | 1277 | |||
| Well # 9 | 80.0 | 03-28W-06BAA | 1850 | 202 | 50.1 | 122 | 27.8 | 2.06 | 507 | 323 | 164 | 0.52 | 2.32 | 1.9 | 12.5 | 1381 | |||
| Well # 10 | 79.0 | 03-28W-06D | 1900 | 195 | 49.8 | 154 | 25.2 | 1.93 | 535 | 346 | 165 | 0.54 | 2.63 | 0.8 | 3.8 | 1467 | |||
| Well # 11 | 76.0 | 03-29W-12BCB | 1440 | 160 | 37.5 | 68.3 | 69.8 | 1.52 | 476 | 234 | 85 | 0.49 | 1.35 | 4.0 | 13.2 | 1044 | |||
| Golf Course | 50.0 | 02-28W-31DBA | 1200 | 112 | 27.8 | 95.9 | 17.9 | 1.12 | 430 | 145 | 91 | 0.55 | 1.75 | 2.63 | 0.71 | 0.2 | 0.4 | 882 | |
| Youth Ranch | 50.0 | 02-28W-32BDA | 1295 | 186 | 31.6 | 40.0 | 11.3 | 1.38 | 359 | 184 | 100 | 0.28 | 0.80 | 17.2 | 5.7 | 888 | |||
| Irr-107 | 70.0 | 02-28W-28DCC | 1240 | 168 | 34.3 | 37.2 | 12.9 | 1.44 | 408 | 118 | 105 | 0.42 | 1.01 | 14.4 | 843 | ||||
| Irr-108 | 72.0 | 02-28W-29CCD | 1255 | 151 | 34.4 | 69.4 | 22.3 | 1.39 | 484 | 159 | 80.0 | 0.51 | 1.66 | 2.3 | 932 | ||||
| **SP C = Specific conductance with units of μmhos/cm *TDS = Total dissolved solids |
|||||||||||||||||||
Kansas Geological Survey, Geohydrology
Placed online Sept. 17, 2007, original report dated 2001
Comments to webadmin@kgs.ku.edu
The URL for this page is http://www.kgs.ku.edu/Hydro/Publications/2001/OFR01_50/index.html