Kansas Geological Survey, Open-file Report 2001-48
by
John M. Healey, James J. Butler, Jr., and Donald O. Whittemore
October 2001
KGS Open-file Report 2001-48
Six monitoring wells were constructed by the Kansas Geological Survey at three locations along the Arkansas River in Edwards, Pawnee, and Barton counties in central Kansas as part of an effort to better understand the relationship between the Arkansas River and the adjacent aquifers. Wells were sited in the vicinity of Kinsley, Larned, and Great Bend. Direct-push electrical conductivity logging was used to understand the lithology of the shallow subsurface and to select appropriate intervals for well screens and annular seals. Following well construction and development, water samples were obtained from each well and a series of slug tests were performed. Water samples were also collected at six locations along the Arkansas River from Kinsley to Great Bend.
The total dissolved solids content of the Arkansas River waters and, in general, the observation well waters decreased from Kinsley to Great Bend. It appears that past periods of high flows of upper Arkansas River water have provided high-sulfate water that recharged the alluvial aquifer along the river, especially the upper portion of the reach. The recharge mixed with other recharge derived from more local sources to form the water that was discharging to the river during the period of water collection. Although the ground waters from both wells at the Kinsley and Larned sites and from the Great Bend North well were of sulfate chemical type, the ground water from the Great Bend South well was of chloride type, reflecting the impact of saltwater intrusion from the underlying Permian strata. The hydraulic conductivity estimates obtained from the slug tests at the Kinsley and Great Bend sites are characteristic of coarse sands and gravels, while those obtained at the Larned wells are characteristic of medium sands.
A network of monitoring wells was constructed by the Kansas Geological Survey (KGS) at three locations along the Arkansas River in Edwards, Pawnee, and Barton counties in central Kansas. Following well construction and development, water samples were collected from each well and a series of slug tests were performed. This work was funded by the Division of Water Resources (DWR) of the Kansas Department of Agriculture as part of an effort to better understand the relationship between the Arkansas River and the adjacent aquifers. John Healey of the Geohydrology Section of the KGS served as the principal investigator for the project.
This work involved the installation, geochemical sampling, and hydraulic testing of six monitoring wells at three locations along the Arkansas River in central Kansas. At each location, one well was placed on each side of the Arkansas River along a line perpendicular to the main river channel. All locations are adjacent to USGS stream gaging stations as shown in the following figure. Well names are based on the nearest town to the site and the relative direction of the well from the Arkansas River: Kinsley East and West, Larned East and West, Great Bend North and South.
The following report will be divided into three main sections: Preliminary Site Investigation, Well Construction and Development, and Water Chemistry and Aquifer Hydraulics Investigations.
The first section describes the preliminary site investigation activities (direct-push electrical conductivity logging) that were used to assess subsurface geology and to determine the screened intervals for the monitoring wells. The second section describes the details of the well installation and the methods that were used to develop the installed wells. The third section includes a description of the field procedures used for acquiring water samples for geochemical analyses and for performing slug tests to obtain estimates of hydraulic conductivity.
Methodology Overview
The preliminary site investigation involved use of a direct-push technique commonly referred to as electrical conductivity profiling (Christy et al., 1994; Butler et al., 1999). This technique is effective in defining subsurface lithology in unconsolidated alluvial sediments. The electrical conductivity (EC) probe used in this work (Geoprobe SC 400) was designed such that the investigator can select different configurations to adjust the lateral extent of investigation. The configuration that gave the greatest depth of penetration (Wenner array) was used here.
The EC probe was advanced into the subsurface with a track-mounted Geoprobe 66DT unit using hydraulic pressure and a percussion hammer, while the electrical conductivity of the subsurface was measured at intervals of 0.05 ft. At all of the sites, the electrical conductivity of the unconsolidated sediments was assumed to be primarily a function of grain size. Thus, low values of electrical conductivity were assumed to indicate sand and gravel, intermediate values were assumed to indicate silt, and high values were assumed to indicate clay. Although no cores were taken at these sites to confirm the assumed relationships, previous work at a KGS research site has shown the general viability of these relationships (Butler et al., 1999).
The EC probe was advanced until either the tool could be driven no further, often indicative of contact with bedrock or other well-indurated material, or the depth was below the interval of interest. The information obtained by the EC logs was the only means of lithologic interpretation used in this work because the well installation procedure did not produce drill cuttings for visual inspection and description, and no cores were taken.
The KGS was contracted to complete one EC log per site. However, an additional log was completed at most sites to enhance the understanding of the alluvial facies assemblages. The results from the EC logs at each site will be discussed separately. One to two EC plots will be presented for each site in the format of electrical conductivity in milliSiemens/meter (mS/m) versus depth in feet. The plots are shown with respect to land surface and are not corrected for elevation differences. To make this correction, the exact elevation for each probe hole, which was unavailable at the time of the report, would be needed.
All the EC profiles at Kinsley (both sides of the Arkansas River) encountered bedrock as indicated by tool refusal and/or high values for electrical conductivity. The two Kinsley sites were the only locations where bedrock was encountered.
Kinsley East
The Kinsley East site (NE, NE, NE Sec. 35, T. 24 S., R. 19 W.) is located approximately 1/4 mile east of the active channel of the Arkansas River on the south side of highway U.S. 50 at the corner of a field that lies to the southwest of the intersection of the highway and a gravel road. The gravel road leads past a nearby sand and gravel quarry in which fragments of the Dakota Formation were visible in talus piles. Therefore, it is inferred that bedrock consists of the sandstone and shale of the Dakota Formation at this location.
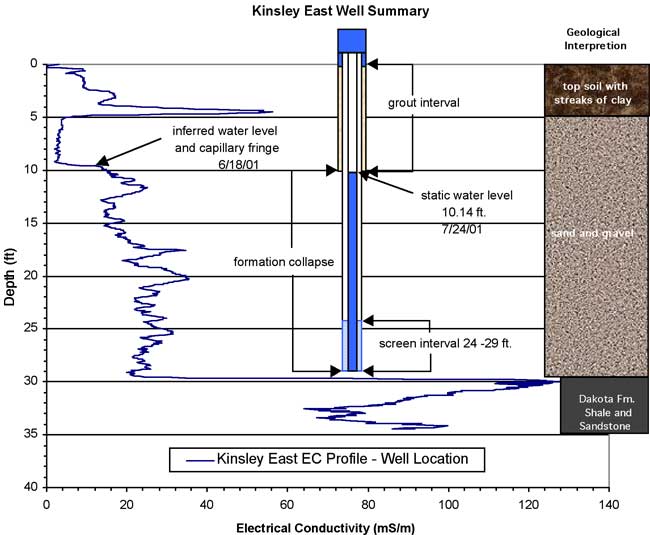
The two Kinsley East EC profiles (Plot 1 at the well site, Plot 2 near the river) illustrate that the unconsolidated sediments consist predominantly of sand and gravel. The high EC reading above a depth of five feet on both plots represents an increase in clay content and may be associated with soil development. The increase in conductivity at 9 feet on Plot 1 and at 7.5 feet on Plot 2 is assumed to represent the transition from unsaturated sand to saturated sand. Since fluids in the pore spaces of the sand contribute to the electrical conductivity measurement, the water table is represented by a step in a sandy sequence. Later water level measurements confirmed that the observed step represented the water table.
The EC log is somewhat featureless below the water table, showing slight variations in electrical conductivity values representative of sands and gravels. The depth to the Dakota Formation appears to vary across the site from 30 feet for Plot 1 to 23 feet for Plot 2. Differences in the elevation of the land surface and in the elevation of the top of the weathered Dakota could account for this apparent variation. Note that in Plot 1 the Dakota Formation has a high EC signature, which is assumed to represent a shale. The weathered Dakota shale was penetrated approximately 4 feet before tool refusal occurred. In Plot 2, the Dakota Formation is not expressed as an elevated signal. In this case, the bedrock boundary was located by the marked decrease in the rate of probe penetration. The low EC value indicates that the Dakota Formation has a higher sand content at that location.
Kinsley West
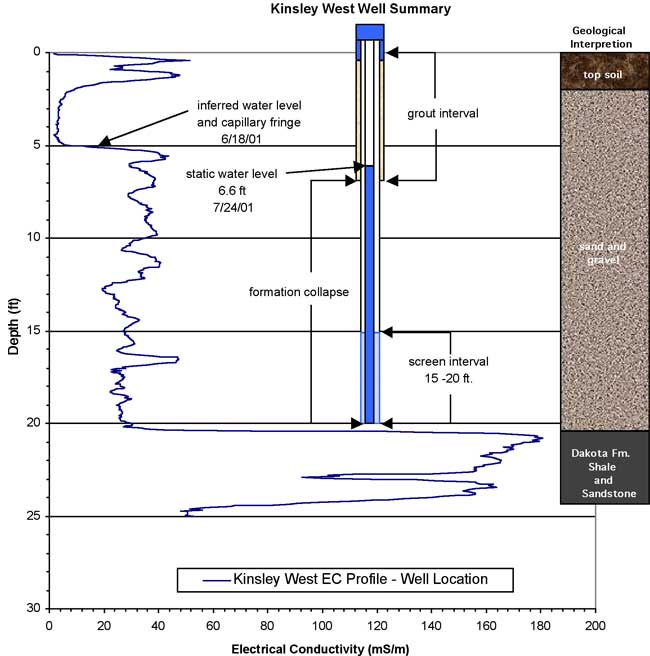
The Kinsley West site (SE, SE, SW Sec. 26, T. 24 S., R. 19 W.) is located approximately 1/4 mile west of the active channel of the Arkansas River on the north side of highway U.S. 50 in a grassy area at the east end of a line of trees that parallels the highway. The grassy area is adjacent to a cultivated field. For the Kinsley West EC profiles, Plot 1 corresponds to the profile at the well location while Plot 2 was obtained adjacent to the river channel.
As with the Kinsley East site, both EC plots show a relatively high conductivity at the top of the profile, thought to represent the development of soil horizons, followed by clean dry sands. The increase in conductivity at 5 feet represents the top of the capillary fringe. The remainder of the profile (5 to 21 feet) shows a relatively clean sand and gravel unit with minor silt lenses. The sequence of alluvial sediments terminates with the Dakota Formation at approximately 20 feet and 19 feet for Plots 1 and 2, respectively.
All of the EC profiles obtained at the Larned sites were terminated in the thick clay underlying the shallow sand units.
Larned East
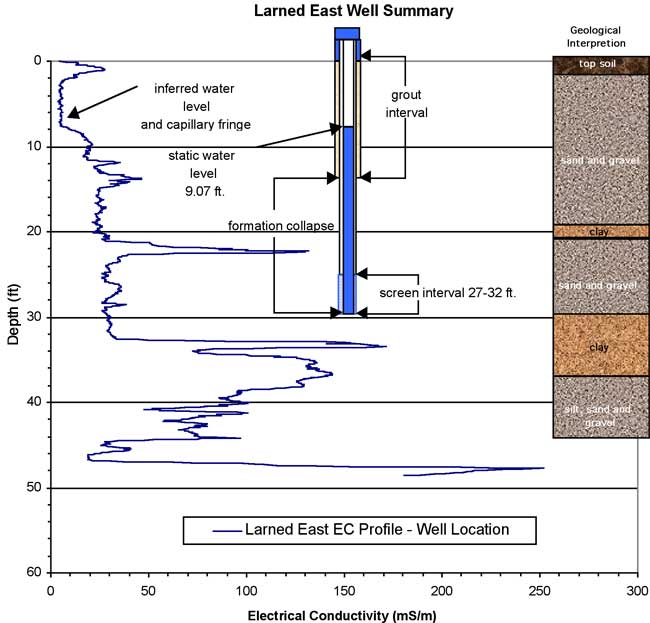
The Larned East site (NW, NE, NW Sec. 29, T. 21 S., R. 15 W.) lies approximately 1/4 mile east of the active channel of the Arkansas River on the south side of the paved county road just inside the fence line of a pasture. EC logs extend to 48 feet at the well location and to 40 feet near the Arkansas River. At the well location (Plot 1) and near the Arkansas River (Plot 2), the profiles show an alternating sequence of sand and gravel interbedded with clay. The overlay of Plots 1 and 2 show remarkable similarities despite a lateral separation of 900 feet. As with the Kinsley profiles, the upper part of the logs indicates the development of soil horizons. The soil horizon is followed by unsaturated sand and gravel grading into saturated material of similar composition. The rise in electrical conductivity in Plot 1 at 8 feet represents the top of the capillary fringe. Plot 1 shows sand and gravel down to 21 feet followed by a clay unit approximately 1-2 feet thick. This clay unit appears to be continuous on the east side of the river and is indicated by the high EC signal between 17 and 22 feet on Plot 2. Below this clay unit, the sequence is predominantly sand and gravel until a prominent clay unit is reached at a depth of 32-33 feet. The Plot 1 profile shows a thin sand and gravel unit from 44 to 47 feet followed by another clay unit that was penetrated 2 feet before profiling was terminated.
Larned West
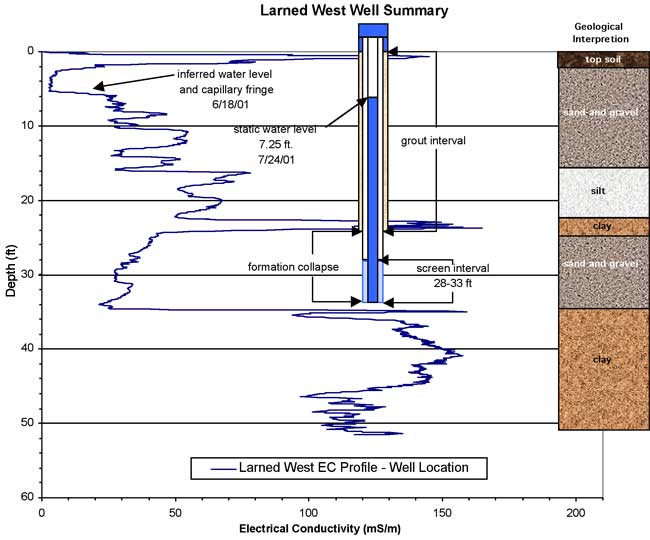
The Larned West site (NE, NW, NE Sec. 30, T. 21 S., R. 15 W.) lies approximately 1/4 mile west of the active channel of the Arkansas River on the south side of the paved county road just inside the fence line of a cultivated field on which cattle are grazed. Two EC profiles were completed at this location. Plot 1 corresponds to the well location and Plot 2 corresponds to a location closer to the river. Due to access limitations, Plot 2 was obtained more than 300 feet from the active channel. Both profiles were completed in the flat lying cultivated field directly to the west of the river.
The upper 45 feet of the EC profiles on the west side of the river are remarkably similar to those on the east. The topsoil (0-2 ft.) is underlain by unsaturated (2-5 ft.) and saturated sand and gravel to approximately 15 feet in depth. A silt and clay sequence extends from 15 to 24 feet, below which a series of clean sands and gravels extends to a depth of approximately 34 feet. Underlying this series of sand and gravel is a clay unit that appears on both sides of the river. Although Plot 1 shows a sand and gravel layer from 45 to 48 feet, Plot 2 does not show this feature. Both logs were terminated at a depth of 52 feet within a clay unit.
Only one EC profile was completed at each location at Great Bend due to access restrictions. The EC logs were terminated in the clay underlying the shallow sand units.
Great Bend North
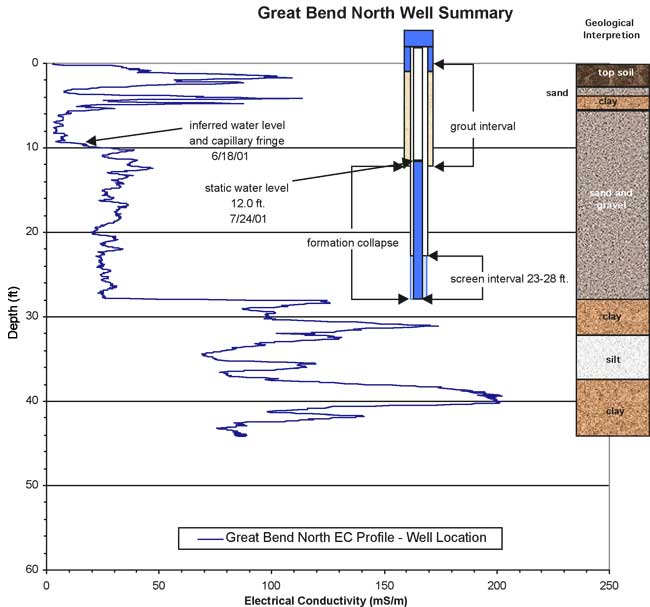
The Great Bend North site (NW, NW, SE Sec. 33, T. 19 S., R. 13 W.) lies approximately 1/10 mile north of the active channel of the Arkansas River at the base of the levee and inside the fenced area on the east side of highway U.S. 281. The EC profile completed at this location shows an alternating sequence of clay and silt in the upper 6 feet of the section followed by dry sand. The top of the capillary zone is 9-10 feet below land surface in a sand and gravel sequence that extends to a depth of 28 feet. Directly underlying the sand is a thick clay unit with interbedded layers of silt. Profiling ceased at a depth of 44 feet, approximately 16 feet below the top of the clay.
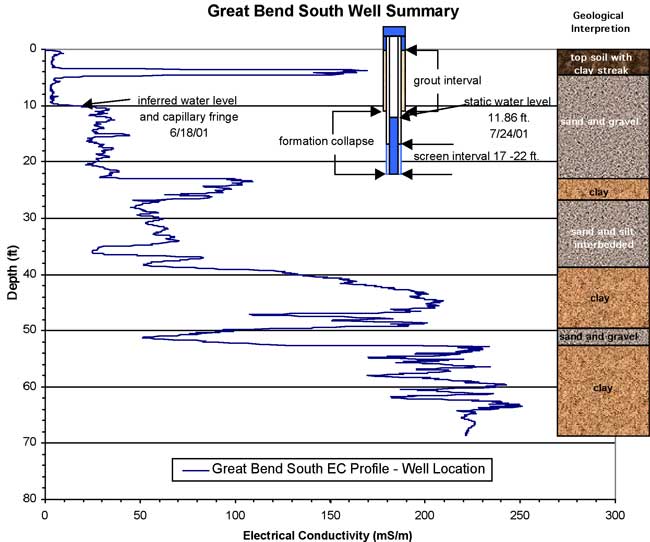
Great Bend South
The Great Bend South site (NW, SW, SE Sec. 33, T. 19 S., R. 13 W.) lies approximately 1/4 mile south of the active channel of the Arkansas River at the base of the levee and just inside the fenced area on the east side of highway U.S. 281. The total depth of the EC profile completed at this location is approximately 68 feet. The probe could not be driven deeper, most likely as a result of caliche layers. The EC profile shows an upper 10 feet of dry sand with a clay stringer of approximately two feet in thickness. The top of the capillary zone is at a depth of approximately 10 feet. Sands and gravels extend to approximately 24 feet in depth. This upper sand and gravel unit is underlain by 44 feet of alternating sequences of clay, silt, and sand.
All of the observation wells were completed in accordance with regulations established by the Kansas Department of Health and Environment. Well depths and screened intervals were chosen based on the EC logs and discussions with DWR personnel. Copies of the well completion forms (WWC-5) are included at the end of this report. The geologic interpretations given on the WWC-5 forms are based upon the electrical conductivity profiles obtained at each site.
All wells were constructed in the same manner with the KGS Geoprobe unit (66DT). The unit was used to drive 3.5-inch (outer diameter) flush-joint steel casing (type NW) with inner rods and pilot bit to the desired depth. Upon reaching that depth, the inner rods were extracted while the 3.5-inch NW casing was flooded with potable water to prevent sand heave. The total depth inside the NW casing was measured to ensure correct well screen placement.
Each well was constructed of 2-inch (Sch. 40 PVC) flush-joint (o-ring seals) casing with 5 feet of 2-inch (Sch. 40 PVC) 20-slot screen with a well point at the lower end. The casing string was assembled as it was lowered through the center of the NW pipe. After the PVC casing string, with the screen and well point at the lower end, was lowered to the bottom, the outer NW casing was retracted. The unconsolidated formation collapsed back against the PVC casing and screen as the NW pipe was removed. Retraction of the steel pipe continued until the bottom of the pipe string was adjacent to a zone where an annular seal was necessary. Bentonite slurry was then tremied into the annular space between the inner diameter of the NW pipe and the outer diameter of the PVC casing. After the NW pipe was removed from the hole, bentonite chips were poured into the borehole to fill the remaining annular space to the land surface. Placing a 4-inch steel well protector with a lock over the PVC casing completed the well.
The following diagrams show the well-construction details, the electrical-conductivity profiles, and a brief geologic interpretation for each well site. A table summarizing well details is provided following the diagrams.
| Table of Observation Well Details | |||||
|---|---|---|---|---|---|
| Location County/Site Name |
Legal Description |
Total Depth (Post-development from grade) |
Approximate Screen Interval (from grade) |
Approximate Interval for Annular Seals (from grade) |
Water Level During the 4th week of July 2001 (Post-development wrt TOC) |
| Edwards Co./ Kinsley East WWC5 Record |
Township 24 S. Range 19 W. Section 35 NE, NE, NE |
28.90 | 24 - 29 | 0-10 | 12.14 |
| Edwards Co./ Kinsley West WWC5 Record |
Township 24 S. Range 19 W. Section 26 SE, SE, SW |
20.13 | 15 -20 | 0-7 | 8.60 |
| Pawnee Co./ Larned East WWC5 Record |
Township 21 S. Range 15 W. Section 29 NW, NE, NW |
32.55 | 27 - 32 | 0-15 | 11.07 |
| Pawnee Co./ Larned West WWC5 Record |
Township 21 S. Range 15 W. Section 30 NE, NW, NE |
32.91 | 28 -33 | 0-24 | 9.25 |
| Barton Co./ Great Bend North WWC5 Record |
Township 19 S. Range 13 W. Section 33 NW, NW, SE |
28.63 | 23 - 28 | 0-12 | 14.00 |
| Barton Co./ Great Bend South WWC5 Record |
Township 19 S. Range 13 W. Section 33 NW, SW, SE |
22.23 | 17 - 22 | 0-11 | 13.86 |
| All measurements are given in feet. All wells are constructed of two inch Schedule 40 flush-joint casing with five feet of two inch 20-slot screen and a well point. In all cases, top of casing is two feet above land surface (grade). |
|||||
The completed wells were developed using a centrifugal suction pump capable of flow rates of over 10 gpm. While the pump was operating, the wells were mechanically surged by rapidly raising and lowering the pump intake line, which had a check valve at its lower end. The pumping and surging continued until groundwater turbidity was judged minimal. At that point, the intake line was removed from the well and a small diameter Grundfos submersible pump was installed. The well was then pumped continuously at 8 gpm for about 1/2 hour before groundwater sampling. No turbidity was observed in the pumped water during sampling. It is estimated that over 100 well volumes were removed during the development process at each well.
The KGS collected water samples from the Arkansas River and the observation wells between July 23 and July 26, 2001. The Arkansas River waters were collected at bridge locations. The bridge east of Dundee is downstream of the Dundee diversion dam. The ground waters were sampled using a Grundfos pump after the wells were developed using a centrifugal pump. The water after development was clear. There was no change in the temperature and specific conductance during pumping with the Grundfos unit for about 20 minutes before sampling.
The samples from the wells were filtered through 0.45 μm membrane filter cartridges in the field, and the river samples were filtered through 0.45 μm membrane filter paper in the laboratory. A portion of the field-filtered samples was acidified with hydrochloric acid for use in cation and nitrate determination. All samples were immediately placed in a cooler with ice and transferred to a refrigerator after arrival at the laboratory. The concentrations of silica and cations were determined using inductively-coupled plasma spectrophotometry. Alkalinity was measured by automated titrimetry and converted to bicarbonate and carbonate contents. Sulfate, chloride, and nitrate concentrations were determined using colorimetric or ultraviolet spectrophotometry on automated flow-injection or segmented-flow instruments. The location and collection information and chemical properties of the water samples are listed in Table A; the dissolved constituent concentrations are in Table B.
Table A--Location Information and Chemical Properties for Water Samples Collected from the Arkansas River and the Wells. SpC refers to specific conductance (μS/cm is equivalent to μmho/cm).
| Site name | Co. | Legal location | KGS lab no. |
Project number |
Sample date |
Sample time |
Field SpC μS/cm |
Lab SpC μS/cm |
Lab pH |
|---|---|---|---|---|---|---|---|---|---|
| Arkansas River waters | |||||||||
| Kinsley gaging station | ED | 24S-19W-26DCCD | 010098 | MARK-001 | 7/23/01 | 12:45 | 1970 | 1970 | 8.20 |
| At Garfield | PN | 23S-17W-07BBDB | 010104 | MARK-007 | 7/25/01 | 9:05 | 1810 | 1790 | |
| Larned gaging station | PN | 21S-15W-29BBAB | 010102 | MARK-005 | 7/24/01 | 11:42 | 1730 | 1720 | 8.40 |
| Southeast of Pawnee Rock | PN | 21S-15W-10DABB | 010105 | MARK-008 | 7/25/01 | 10:27 | 1700 | 1690 | |
| East of Dundee | BT | 20S-14W-15CCCB | 010108 | MARK-011 | 7/25/01 | 17:10 | 1300 | 1300 | |
| Great Bend gaging station | BT | 19S-1 3W-33DBCB | 010106 | MARK-009 | 7/25/01 | 12:04 | 1110 | 1100 | 8.40 |
| Observation well waters | |||||||||
| Kinsley, West well | ED | 24S-19W-26CDD | 010099 | MARK-002 | 7/23/01 | 13:47 | 1540 | 1540 | 7.30 |
| Kinsley, East well | ED | 24S-19W-35AAA | 010100 | MARK-003 | 7/23/01 | 16:55 | 1610 | 1590 | 7.60 |
| Larned, West well | PN | 21S-15W-30ABA | 010101 | MARK-004 | 7/24/01 | 10:06 | 1520 | 1510 | 7.40 |
| Larned, East well | PN | 21S-15W-29BAB | 010103 | MARK-006 | 7/24/01 | 17:20 | 1390 | 1370 | 7.60 |
| Great Bend, North well | BT | 19S-3W-33DBB | 010107 | MARK-010 | 7/25/01 | 16:17 | 1320 | 1315 | 7.80 |
| Great Bend, South well | BT | 19S-3W-33DCB | 010109 | MARK-012 | 7/26/01 | 11:50 | 1570 | 1550 | 7.80 |
Table B--Dissolved Constituent Concentrations for the Arkansas River and Observation Well Waters. TDS and SpC refer to total dissolved solids and specific conductance, respectively. The TDS was computed as the sum of dissolved constituents.
| Site name | SiO2 mg/L |
Ca mg/L |
Mg mg/L |
Na mg/L |
K mg/L |
Sr mg/L |
CO3 mg/L |
HCO3 mg/L |
SO4 mg/L |
Cl mg/L |
F mg/L |
NO3-N mg/L |
TDS mg/L |
TDS/SpC | Na/Cl equiv. ratio |
(Ca+Mg)/Na equivalent ratio |
SO4/Cl mass ratio |
|---|---|---|---|---|---|---|---|---|---|---|---|---|---|---|---|---|---|
| Arkansas River waters | |||||||||||||||||
| Kinsley gaging stn | 10.7 | 154 | 71.1 | 196 | 9.7 | 2.24 | 223 | 769 | 67.5 | 1.2 | 1.3 | 1397 | 0.709 | 4.48 | 1.59 | 11.4 | |
| At Garfield | 675 | 69 | 0.7 | 9.78 | |||||||||||||
| Larned gaging stn | 6.2 | 120 | 58.1 | 180 | 9.3 | 1.83 | 2.9 | 185 | 614 | 95.6 | 1 | 0.2 | 1178 | 0.685 | 2.9 | 1.38 | 6.42 |
| SE of Pawnee Rock | 566 | 103 | 0.8 | 5.5 | |||||||||||||
| East of Dundee | 424 | 67.2 | 0.9 | 6.31 | |||||||||||||
| Great Bend gag. stn | 14.7 | 95.7 | 30.8 | 93.8 | 6.8 | 1.07 | 2.7 | 240 | 276 | 61.4 | 0.8 | 2.6 | 710 | 0.646 | 2.36 | 1.79 | 4.5 |
| Observation well waters | |||||||||||||||||
| Kinsley, West well | 17.8 | 142 | 43 | 144 | 8.1 | 1.62 | 408 | 388 | 61 | 0.1 | 1.5 | 1016 | 0.660 | 3.60 | 1.70 | 6.29 | |
| Kinsley, East well | 19.1 | 181 | 28.7 | 139 | 9.3 | 0.90 | 215 | 575 | 52 | 0.90 | 1.0 | 1116 | 0.702 | 4.10 | 1.88 | 11.0 | |
| Larned, West well | 17.9 | 181 | 33.6 | 104 | 5.8 | 1.37 | 256 | 395 | 81.4 | 0.6 | 15.9 | 1017 | 0.673 | 1.97 | 2.61 | 4.85 | |
| Larned, East well | 17.6 | 150 | 31.6 | 110 | 5.1 | 1.13 | 281 | 374 | 65.0 | 0.5 | 8.3 | 930 | 0.679 | 2.61 | 2.11 | 5.75 | |
| Great Bend, N well | 12.6 | 91.5 | 35.1 | 137 | 8.8 | 1.04 | 207 | 369 | 83.1 | 1.5 | 1.0 | 846 | 0.643 | 2.54 | 1.25 | 4.44 | |
| Great Bend, S well | 16.4 | 69.4 | 30.2 | 198 | 15.2 | 0.98 | 348 | 117 | 251 | 0.7 | 0.1 | 870 | 0.562 | 1.22 | 0.691 | 0.466 | |
The specific conductance indicates that the dissolved solids contents of the river water decreased downstream from Kinsley to Great Bend. The total dissolved solids (TDS) computed from the measurements of all the major dissolved constituents for the samples at Kinsley, Larned, and Great Bend also illustrate the decrease in dissolved solids content downstream. The decrease in conductance was substantially greater between Kinsley and Garfield and between Pawnee Rock and Great Bend than between Garfield and Pawnee Rock. The river waters changed from a sodium, calcium-sulfate type water at Kinsley to a calcium, sodium-sulfate water at Great Bend. Sulfate was the dissolved constituent with the highest concentration in all of the river waters. The sulfate concentration and sulfate/chloride mass ratio decreased substantially from 769 mg/L and 11.4, respectively, near Kinsley to 276 mg/L and 4.5, respectively, at Great Bend. The chemical composition of the river water near Kinsley is relatively similar to that of upper Arkansas River water sampled at Dodge City during 1995-2000 (Whittemore, 2000); the sulfate/chloride ratio of the water at Dodge City averaged about 15 and nearly always ranged between 14 and 16. The nitrate content of the river water was low (less than or equal to 1.3 mg/L NO3-N) from Kinsley to east of Dundee during the July 2001 sampling, but increased to 2.6 mg/L at Great Bend.
The TDS content of the observation well waters generally decreased from the Kinsley to the Great Bend sites. The chemical water type ranged from calcium, sodium-sulfate, bicarbonate for the ground water from the Kinsley West well to calcium-sulfate for the Kinsley East well and on both sides of the Larned gage, to sodium, calcium-sulfate at the Great Bend North well, and to sodium-chloride at the Great Bend South well. The ground water with the highest sulfate/chloride ratio was located at the Kinsley East site and the water with the lowest ratio at Great Bend South site. The nitrate concentrations were less than 2 mg/L as NO3-N in the ground water at the Kinsley and Great Bend sites, but were substantially greater at the Larned sites. The highest nitrate concentration was in the water from the Larned West well and exceeded the standard of 10 mg/L for drinking-water use. The well is at the edge of a cultivated and irrigated field. The land use at the Larned East site is grazed pasture.
In general, it appears that past periods of high flows of upper Arkansas River water have provided high-sulfate water that recharged the alluvial aquifer along the river. The recharge mixed with other recharge derived from more local sources to form the water that was discharging to the river during the period of water collection in July 2001. The chemical impact of the recharge of upper Arkansas River water was greatest at the Kinsley East site. The ground water at the Kinsley West site appeared to be affected by evapotranspiration of local ground water but could also have partially reflected some upper Arkansas River water. At the Larned sites, the observation well water had a chemistry that could reflect upper Arkansas River mixing with a substantial amount of more local recharge. The more local source was probably a combination of recharge from high flows of the Pawnee River that joins the Arkansas River seven miles upstream of the Larned gaging station, direct ground-water recharge from precipitation, and ground-water flow from the Dakota and High Plains aquifer from the west and the High Plains aquifer from the east. The ground water at the Great Bend South site reflected a mixture of the intrusion of sodium-chloride type water, which derives from the Permian strata underlying the High Plains aquifer in south-central Kansas, and local ground water recharge.
The changes in the sulfate, chloride, and nitrate concentrations in the samples of Arkansas River water collected from Kinsley to Great Bend in July 2001 assist in understanding stream-aquifer interactions in this reach. During the period of river water collection (July 23-25; Table A), there was no flow in the Arkansas River at Dodge City, and the flow was slowly decreasing at Kinsley (9 to 8 cfs), Larned (18 to 16 cfs), and Great Bend (19-16 cfs). The diversion dam southeast of Dundee was diverting most of the flow of the river such that the discharge at the river bridge east of Dundee (about 1.5 miles downstream of the dam) was only a couple cfs. There was no flow in the Pawnee River at the gaging station at Rozel and there was no visible flow of the water standing in the river channel under the bridge at the southwest corner of Larned. Most of the middle Arkansas River during this period was probably gaining ground water discharged from the alluvial aquifer. The ground water was fresher than the saline river water at Kinsley and thus diluted the river water flowing from upstream, as reflected in the continuous, substantial decrease in sulfate concentration in the downstream direction. The greatest amount of ground-water discharge per mile to the Arkansas River was from the bridge east of Dundee to Great Bend. Although the conductance and sulfate concentration both decreased appreciably, the nitrate content of the river water increased from 0.9 to 2.6 mg/L NO3-N in this reach, indicating that the ground water discharged to the river contained substantially more nitrate that the upstream river water. The changes in the water quality along the river suggest that chemical methods may be a good approach to help in determining gains and losses in river flow due to stream-aquifer interactions.
This program of slug tests was carried out following guidelines for the design, performance and analysis of slug tests developed at the KGS (Butler et al., 1996; Butler, 1997; Fetter, 2000). The pneumatic method (Butler, 1997) was used for test initiation at all wells. This method involves placing an airtight wellhead apparatus on top of the well and pressurizing the air column in the sealed well casing. A slug test is initiated by a very rapid depressurization of the air column using a release valve. At least seven tests were performed at each well. The initial water-level change (H0) was varied in a systematic manner between tests so that the dependence of test responses on H0 and the significance of dynamic skin effects (Butler, 1997) could be assessed. Head dependence and dynamic skin effects were found to be negligible at all wells.
Changes in water level were measured using a pressure transducer (In-Situ PXD-261 0-20 psig transducer) connected to a data logger (Campbell Scientific CR23X). Air pressure within the sealed casing was also monitored using a pressure transducer (In-Situ PXD-261 0-20 psig transducer). Casing pressurization was accomplished using a nitrogen gas cylinder.
Test data were analyzed using two theoretical models for slug tests: 1) the high-K Bouwer and Rice model for slug tests with inertial effects in partially penetrating wells in unconfined aquifers (Springer and Gelhar, 1991; Butler, 1997); and 2) the KGS model for slug tests in partially penetrating wells in confined aquifers (Butler, 1997). All analyses were performed with AQTESOLV, an automated well-test analysis package (HydroSOLVE, 2001). The choice of confined or unconfined model was made on the basis of electrical conductivity logs and water level measurements.
The hydraulic conductivity (K) estimates obtained at the Great Bend and Kinsley wells are characteristic of coarse sands and gravels, while those obtained at the Larned wells are characteristic of medium sands. At the Kinsley and Larned sites, there is good agreement between K estimates obtained on either side of the river. The large difference between K estimates obtained on opposites sides of the river at Great Bend may indicate that the shallow aquifer consists of finer sand on the north side of the river at that location. Note that Butler (1997) emphasizes that the impact of incomplete well development on slug tests will be difficult to avoid and can lead to K estimates that are significantly lower than the actual hydraulic conductivity of the aquifer. However, considerable attention was paid to well development in this work, so the tabulated hydraulic conductivity values should be reasonable estimates of the hydraulic conductivity of the aquifer in the vicinity of the test wells.
| Well Location |
Test Date |
Test Number |
Theoretical Model |
Hydraulic Conductivity (feet/day) |
|---|---|---|---|---|
| Kinsley East | 7/25/01 | 4 | Springer-Gelhar | 309 |
| Kinsley West | 7/24/01 | 4 | Springer-Gelhar | 267 |
| Larned East | 7/24/01 | 5 | KGS | 39 |
| Larned West | 7/25/01 | 7 | KGS | 44 |
| Great Bend North | 7/25/01 | 5 | Springer-Gelhar | 145 |
| Great Bend South | 7/26/01 | 6 | Springer-Gelhar | 319 |
Six monitoring wells were constructed by the Kansas Geological Survey (KGS) at three locations along the Arkansas River in Edwards, Pawnee, and Barton counties in central Kansas as part of an effort to better understand the relationship between the Arkansas River and the adjacent aquifers. Wells were sited in the vicinity of Kinsley, Larned, and Great Bend. Direct-push electrical conductivity logging was used to understand the lithology of the shallow subsurface and to select appropriate intervals for well screens and annular seals. Following well construction and development, water samples were obtained from each well and a series of slug tests were performed. Water samples were also collected at six locations along the Arkansas River from Kinsley to Great Bend.
The total dissolved solids content of the Arkansas River waters and, in general, the observation well waters decreased from Kinsley to Great Bend. It appears that past periods of high flows of upper Arkansas River water have provided high-sulfate water that recharged the alluvial aquifer along the river, especially the upper portion of the reach. The recharge mixed with other recharge derived from more local sources to form the water that was discharging to the river during the period of water collection. Although the ground waters from both wells at the Kinsley and Larned sites and from the Great Bend North well were of sulfate chemical type, the ground water from the Great Bend South well was of chloride type, reflecting the impact of saltwater intrusion from the underlying Permian strata. The hydraulic conductivity estimates obtained from the slug tests at the Kinsley and Great Bend sites are characteristic of coarse sands and gravels, while those obtained at the Larned wells are characteristic of medium sands.
Although not funded by the Division of Water Resources contract, additional work has been conducted by KGS personnel in an attempt to better clarify the movement of waters between the Arkansas River and adjacent aquifers. This work included obtaining additional water samples along the Arkansas River between Kinsley and Great Bend after the installation of the six wells described in this report. The changes in the water quality along the river relative to the ground-water chemistry suggest that chemical methods may be a good approach to help in determining gains and losses in river flow due to stream-aquifer interactions. The KGS is currently pursuing the development of these and other methods as part of a research project directed at the quantitative assessment of stream-aquifer interactions.
Butler, J.J., Jr. 1997. The Design, Performance, and Analysis of Slug Tests. Lewis Publishers.
Butler, J.J., Jr., C.D. McElwee, and W.Z. Liu. 1996. Improving the reliability of parameter estimates obtained from slug tests. Ground Water 34, no. 3: 480-490.
Butler, J.J., Jr., J.M. Healey, L. Zheng, W. McCall, and M.K. Schulmeister. 1999. Hydrostratigraphic characterization of unconsolidated alluvium with direct-push sensor technology (abstract). GSA 1999 Annual Meeting Abstracts with Program. v. 31, no. 7: A350 (full report (Kansas Geological Survey Open-File Rept. 99-40) [available online]
Christy, C.D., T.M. Christy, and V. Wittig. 1994. A percussion probing tool for the direct sensing of soil conductivity: Proc. of the 8th National Outdoor Action Conf., NGWA: 381-394.
Fetter, C.W. 2000. Applied Hydrogeology (4th Edition). Prentice Hall.
HydroSOLVE, Inc. 2001. AQTESOLV for Windows User's Guide.
Springer, R.K., and L.W. Gelhar. 1991. Characterization of large-scale aquifer heterogeneity in glacial outwash by analysis of slug tests with oscillatory response, Cape Cod, Massachusetts: U.S. Geol. Surv., Water Res. Invest. Rep. 91-4034: 36-40.
Whittemore, D.O. 2000, Water quality of the Arkansas River in southwest Kansas: Kansas Geological Survey, Open-file Report 2000-44, 85 p. [available online]
Kansas Geological Survey, Geohydrology
Placed online Sept. 19, 2007, original report dated Oct. 2001
Comments to webadmin@kgs.ku.edu
The URL for this page is http://www.kgs.ku.edu/Hydro/Publications/2001/OFR01_48/index.html