Kansas Geological Survey, Open-file Report 83-17
KGS Open File Report 83-17
A Report for the Kansas Department of Health and Environment
June 1983
Read the PDF version (1 MB)
Saline water has been found in the irrigation well of M. Bell located in the SE of the NW~ of the NE of Section 4, T. 22 S., R. 7 W., approximately 1 1/2 miles northwest of the town of Nickerson, northwestern Reno County. The chloride concentration of a sample collected from this well on August 8, 1982 by the Kansas Department of Health and Environment (KDHE) was 1270 mg/L. The irrigation well is located about 200 feet south and east of the mud pits used during the drilling of an oil well (#1 "A" Bell Lease) in late 1981 and early 1982. A letter of the KDHE dated August 16, 1982 indicated that the mud pits had not been completely emptied by that time; the chloride concentration of fluid in the pit was 31,375 mg/L. This fluid was removed by September 1, 1982 as a result of a KDHE request to the oil well operator. Mr. Bell has been concerned that the saline water which his irrigation well had started to yield had been derived from the mud pits used for the oil well drilling. However, saline water exists naturally in Upper Permian bedrock underlying the sand and gravel aquifer of the Great Bend Prairie to the south and west of the Bell well area. Thus, a possible contention of the oil company might be that the irrigation well had been pumped so much that upcoming of natural saline water had occurred.
On February 19, 1982 the KDHE collected water samples from the Bell irrigation well and the gunbarrel of the tank battery of the BeIIIA" Lease, which were sent to the Kansas Geological Survey for identification of the saltwater source by the procedures of Whittemore et al. (1981) and Whittemore (1983). These methods are especially effective for distinguishing oil-field brine from halite-solution brine sources contaminating waters. This report gives the results of the chemical identification using the samples provided and data from previous saltwater source studies.
Bromide concentrations were measured by an automated phenol red method on a Technicon AutoAnalyzer (Basel et al., 1982). Dissolved chloride and iodide were determined by automated spectrophotometric methods on the same instrument using ferric thiocyanate and ceric-arsenious acid oxidation, respectively.
The chloride, bromide, and iodide concentrations of the irrigation well and oil brine samples are listed in Table 1 with Department of Health and Environment data for an earlier sample from the Bell irrigation well, and average chemical data from Hathaway et al. (1978) for five irrigation wells within a 5.3 mile radius of the Bell well. The latter five waters were collected while the wells were being pumped during the height of the irrigation season, thus, they indicate the general water quality in the aquifer in that area, including any upcoming effects. The chloride concentrations of samples from the Bell irrigation well were higher than any for the other irrigation wells. The two irrigation wells closest to the Bell well (1.7 miles to the east-southeast and 1.8 miles to the northwest) yielded waters with dissolved chloride of 80 and 73 mg/L, respectively. The well from which water with the highest chloride concentration (435 mg/L) of the five was pumped, is located one-half mile southwest of the Arkansas River and 2.9 miles south-southwest of the Bell well. The other two of the five wells are north of the river and to the northwest and southeast of the Bell well.
Table 1--Dissolved Constituent Concentrations and Ratios for Irrigation Well and Oil Brine Samples
| Bell Irrigation Wella |
Bell Irrigation Wellb |
Bell "A" Lease Oil Brineb |
Averages for 5 Irrigation Wells near Bell Wellc |
|
|---|---|---|---|---|
| Date collected, mon-day-yr |
8-10-1982; | 2-19-1983 | 2-19-1983 | 7-27-77d |
| Ca, mg/L | 160 | 92 | ||
| Mg, mg/L | 34 | 16 | ||
| Na, mg/L | 802 | 139 | ||
| HCO3, mg/L | 370 | 288 | ||
| Cl, mg/L | 1270 | 491 | 70,700 | 170 |
| SO4, mg/L | 137 | 97 | ||
| NO3 (as N), mg/L | 2.2 | 3.4 | ||
| Br, mg/L | 1.8 | 315 | ||
| I, mg/L | 0.048 | 8.7 | ||
| Na/Cl | 0.63 | 0.99 | ||
| Br/Cl × 104 | 37 | 45 | ||
| I/Cl × 106 | 98 | 123 |
a From Kansas Department of Health and Environment analyses.
b From Kansas Geological Survey analyses.
c All 5 wells are within 5.3 miles of Bell well. Data from Hathaway et al. (1978).
d All samples collected from July 25-29, 1977
The sodium/chloride ratio of 0.63 for the earlier sample from the Bell irrigation well suggests that much of the saline water could have been derived from solution of halite (rock salt), because the value is close to the theoretical ratio (0.649) for this source. Observed sodium/chloride ratios for ha ite solutions from observation wells in Kansas are within the range 0.6 to 0.7. However, there are two main types of halite solution sources in Kansas: (1) salt water derived from dissolution of naturally occurring salt in near-surface strata, usually of Permian age, and (2) solution of salt brought to and placed at the land surface by the activities of man. The latter halite source (and resultant salt water) includes both salt used in drilling mud and cuttings obtained when boring through salt beds. The thickness of the Hutchinson Salt Member of the Permian Wellington Formation is about 300 feet in the subsurface strata underlying the Bell well area. Thus, many salt cuttings and much salt water would have been in the mud pits used to drill the Bell "A" Lease oil well.
After a borehole drilled for oil is completed, tests are conducted to determine whether the well could produce enough oil to be economical. A small amount of salt water could be brought up from the deep subsurface strata in which the oil is expected during initial testing. If the results indicated that the well would be productive, additional salt water would probably be brought up during development of the well. The salt water (called oilfield brine) obtained during the period would generally be placed in the mud pits.
The sodium/chloride ratio of oilfield brines in Kansas are lower (generally 0.5 ± 0.1) than for halite solution brines. The difference in this ratio from that of halite solutions is not great enough to determine anything more than the major component of a mixture of oilfield and halite derived saltwaters. In addition, the ratio can decrease from ion exchange in clay-containing sediments when salt waters enter aquifers in equilibrium with fresher waters.
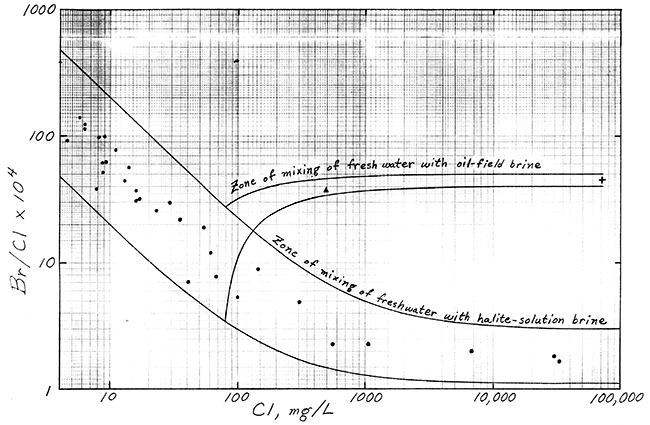
Better identification of the salinity sources affecting the Bell well water is given by a graph of bromide/chloride versus chloride concentration (Figure 1). The curves in Figure 1 are the boundary lines for the zone of mixing of fresh waters with salt waters derived from solution of halite in Permian Red Beds (and unaffected by oilfield brine) in the Great Bend Prairie, and the zone of mixing of fresh water in the vicinity of the Bell irrigation well with oilfield brine from the Bell "A" Lease. The observation well data represent water samples from the well network in Reno, Stafford, and Pratt Counties emplaced by the Big Bend Groundwater Management District and Kansas Geological Survey. A chloride concentration of 80 mg/L was chosen for the uncontaminated fresh water near the Bell well based on the chemistry of water from the two nearest irrigation wells sampled by Hathaway et al. (1978). The point for the Bell irrigation well water falls within the zone of mixing of fresh waters with oilfield brine, and lies appreciably above the zone of mixing with halite-solution brine.
The identification method is more sensitive to oilfield brine than halite-solution brine in a mixture of two salt sources, because the oil brine has the higher concentration of the trace constituents at a given chloride concentration. Thus, some salt water from halite-solution (such as derived from drilling through the Hutchinson Salt Member) could be mixed with the oilfield brine if the contamination source for the Bell irrigation water had come from the mud pits. If the chloride concentration in the irrigation water before the contamination occurred were higher than 80 mg/L, the percentage of oilfield brine in an oil-brine and halite-solution mixture would be greater, and vice versa, as determined by the position of the mixing curves and points on Figure 1. The highest possible chloride content (approximately 120 mg/L) in the original irrigation water that would fit in Figure 1 would have been for 100% oilfield brine as the pollutant source. The lower the original dissolved chloride in the unpolluted water, the smaller the amount of oilfield brine and the greater the percentage of salt-solution brine from drilling mud or halite cuttings sources.
Figure 1--Ratios of Bromide/Chloride for Zones of Mixing of Fresh Water with Oil-Field and Halite-Solution Brines, Great Bend Prairie. Symbols: ![]() observation wells,
observation wells, ![]() Bell irrigation well, + Bell "A" Lease oil-field brine.
Bell irrigation well, + Bell "A" Lease oil-field brine.
A graph of iodide/chloride versus chloride concentration would be similar to Figure 1. The iodide/chloride ratio for saline water with only a halite-solution source of chloride would be be less than 50 x 10-6. The iodide/chloride value for the Bell irrigation water (98 x 10-6) bears the same relative relationship to that of the oilfield brine (123 x 10-6) as do the bromide/chloride ratios for the same samples.
The main source of salt water contaminating the groundwater pumped by the Bell irrigation well is oilfield brine similar in chemistry to that from the nearby Bell "A" Lease. Some salt water from drilling mud or solution of halite cuttings derived from a borehole drilled for oil could be mixed with the oilfield brine. The geochemistry of irrigation well waters from the surrounding area and the position of points for the Bell well water and Bell "A" Lease oil brine relative to bromide/chloride versus chloride mixing curves suggest that the chloride concentration in the Bell irrigation water before contamination was less than 120 mg/L.
Basel, C.L., Defreese, J.D., and Whittemore, D.O., 1982, Interferences in automated phenol red method for determination of bromide in water: Analytical Chemistry 54:2090-2094.
Hathaway, L.R., Galle, O.K., Waugh, T.C., and Dickey, H.P., 1978, Chemical quality of irrigation waters in Ford County and the Great Bend Prairie of Kansas: Kansas Geological Survey, Chemical Quality Ser. 7, 41 p. [available online]
Whittemore, D.O., 1983, Geochemical identification of salinity sources: in R.H. French, ed., Proceedings of International Symposium on State-of-the-Art Control of Salinity; Ann Arbor Science, Ann Arbor, Michigan (in press).
Whittemore, D.O., Basel, C.L., Galle, O.K., and Waugh, T. C., 1981, Geochemical identification of saltwater sources in the Smoky Hill River Valley, McPherson, Saline, and Dickinson Counties, Kansas: Kansas Geological Survey, Open-File Rep. 81-6, 78 p. [available online]
Kansas Geological Survey
Placed online Feb. 17, 2017
Comments to webadmin@kgs.ku.edu
The URL for this page is http://www.kgs.ku.edu/Hydro/Publications/1983/OFR83_17/index.htm