![]()
Prev Page--Geology || Next Page--Ground water utilization and quality
Ground Water
Principles of Occurrence
The discussion of the occurrence of ground water in Mitchell County is based on the treatment of the occurrence of ground water by Meinzer (1923,). Moore and others (1940) discussed the principles of ground-water occurrence with special reference to Kansas.
All the water below the surface of the earth is called subsurface water to distinguish it from surface water and from atmospheric water. The rocks that form the crust of the earth are rarely, if ever, solid throughout but contain many open spaces called interstices. These open spaces range in size from minute spaces between particles of silt, clay, or shale, through larger openings between grains or pebbles in sandstone, sand, and gravel to open channels formed by fractures or solution. The percentage of the total volume of material that consists of open spaces is termed the porosity. A formation in which the openings are interconnected and large enough to allow water to move to a well is called an aquifer. Although the amount of water that can be stored in an aquifer depends on the porosity, it is the permeability of an aquifer that determines the rate at which ground water can move. The permeability of an aquifer depends upon the number and size of its open spaces, or interstices, and the extent to which these interstices are interconnected. The permeability of an aquifer is measured by the quantity of water that will flow per unit time through a unit area of the aquifer under a hydraulic gradient of unity.
Water percolating from the surface into the rocks of the earth is drawn downward by gravity. Some of the water will reach a zone where all the open spaces are filled with water under hydrostatic pressure. This zone is called the zone of saturation. A part of the water percolating downward will not reach the zone of saturation but will be held by molecular attraction, or surface tension, to the walls of the open spaces through which the water passes in its descent. This zone of suspended water above the water table is termed the zone of aeration. The zone of aeration consists of three parts: the belt of soil water, the intermediate belt, and the capillary fringe. The belt of soil water, lying just below the land surface, consists of soil and loose materials from which water discharges into the atmosphere by plant transpiration or by direct evaporation. The open spaces of the intermediate belt below the belt of soil water are usually filled with air and water and may at times contain appreciable amounts of water in transit to the water table. The intermediate belt may be absent, however, where the water table is near the surface. The capillary fringe lies directly above the water table and contains water drawn up by capillary action from the zone of saturation. In general, the thickness of the capillary fringe varies inversely with the size of the interstices. In clean gravel, the capillary fringe almost disappears; in silt or clay, the fringe may be several feet thick. Figure 6 is a diagram showing, in general, the divisions of subsurface water.
Figure 6--Diagram showing generalized divisions of subsurface water. (After Meinzer, 1923a, fig. 2)
Under water-table conditions, the term water table designates the surface between the zone of saturation and the zone of aeration. Where a water-bearing formation is confined between relatively impermeable beds and water is supplied to it from an adjacent area of higher altitude, the water table is absent and the water is said to be confined or under artesian pressure. Under artesian conditions, water enters the water-bearing formation at the intake area, percolates downdip, and exerts considerable pressure on the upper confining layer. Under these conditions, water is confined under hydraulic pressure similar to water in a pipe connected to a reservoir at a higher elevation. When an aquifer under artesian pressure is penetrated by a well, water will rise in the well to a height equal to the hydraulic head. The imaginary surface connecting this level in wells is called the piezometric surface. Whether the well flows at the surface depends on the altitude of the piezometric surface. For an artesian well to flow, the piezometric surface must be at a higher altitude than the land surface.
Ground water in Mitchell County is under both water-table and artesian conditions. Water-table conditions are present in shallow aquifers such as terrace deposits and alluvium. Much of the ground water in the Dakota Formation is under artesian pressure. To determine whether water is artesian or under water-table conditions may necessitate an aquifer test to determine the hydraulic characteristics of the aquifer.
Source of Ground Water
In north-central Kansas, as in other parts of the Great Plains, ground water is derived almost entirely from local precipitation in the form of rain or snow. Part of the precipitation that falls in Mitchell County becomes surface runoff and is carried away by streams; part of it is absorbed by vegetation and is transpired into the atmosphere; part of it is returned directly to the atmosphere by evaporation. The rest percolates downward to the water table, later to be discharged by effluent seepage to bodies of surface water, or to be evaporated and transpired.
The movement of ground water in Solomon Valley, as shown on Plate 3 by the slope of the water table, is in a downstream direction toward the east and southeast. Therefore, a small amount of water from the drainage basins of North and South Forks of Solomon River to the west and north eventually enters Mitchell County by subsurface inflow and contributes to the supply of ground water in the area.
Ground water available to wells in the Dakota Formation in the Dakota outcrop area in the eastern part of Mitchell County is for the most part derived locally, but wells that penetrate the Dakota Formation west of its outcrop area tap artesian water, and the piezometric surface at some places is more than 80 feet above the level at which the water is confined. This indicates that the water in the Dakota is derived from some adjacent area where the formation either crops out or is overlain by permeable beds. Bayne and Walters (1959) have constructed a water-table map for the Dakota Formation in Cloud County that indicates that ground water in the Dakota in the western part of Cloud County is moving westward into Mitchell County.
Water Table
The water table is not a level surface but is a sloping surface marked by many mounds, depressions, and ridges. In general, the water table is a subdued reflection of the land surface. The shape of the water table is affected by differences in permeability of the water-bearing material and by unequal additions or withdrawals of ground water. In places where recharge to an aquifer is exceptionally high owing to the presence of overlying permeable material, such as sandy silt, the water table may build up a low mound from which the water slowly spreads out. Depressions in the water table indicate places where ground water is discharging, generally where water is withdrawn by wells or along streams that are below the level of the water table. Streams that gain water from the flow of ground water are said to be gaining or effluent streams. Conversely, streams that are above the water table and contribute water to the water table are said to be losing or influent streams (Fig. 7).
Figure 7--Diagrammatic sections showing influent and effluent streams. A, Longitudinal section showing (right) how river gains water and (left) how it loses water. B, Transverse section across influent part of river. C, Transverse section across effluent part of river. (After Latta, 1944, fig. 14.)
The streams in Mitchell County are the principal features affecting the water table. Solomon River and its North and South Forks are perennial. The larger tributaries of Solomon River flow except during prolonged dry seasons. Most tributaries in the area are intermittent streams that are sometimes influent streams and sometimes effluent, depending upon the relation of the water table to the stream bed. Other streams in the area are ephemeral streams and flow only in response to precipitation.
Fluctuations of the Water Table
The water table does not remain stationary but fluctuates up and down in response to recharge and discharge of ground water. A rise of the water level indicates that recharge exceeds discharge; a decline of the water level indicates that discharge exceeds recharge. Thus, changes in water levels indicate to what extent the reservoir is being replenished or depleted. If the water-bearing materials have a specific yield of 20 percent, the addition of 1 foot of water to the ground-water reservoir will cause a rise of the water table of 5 feet.
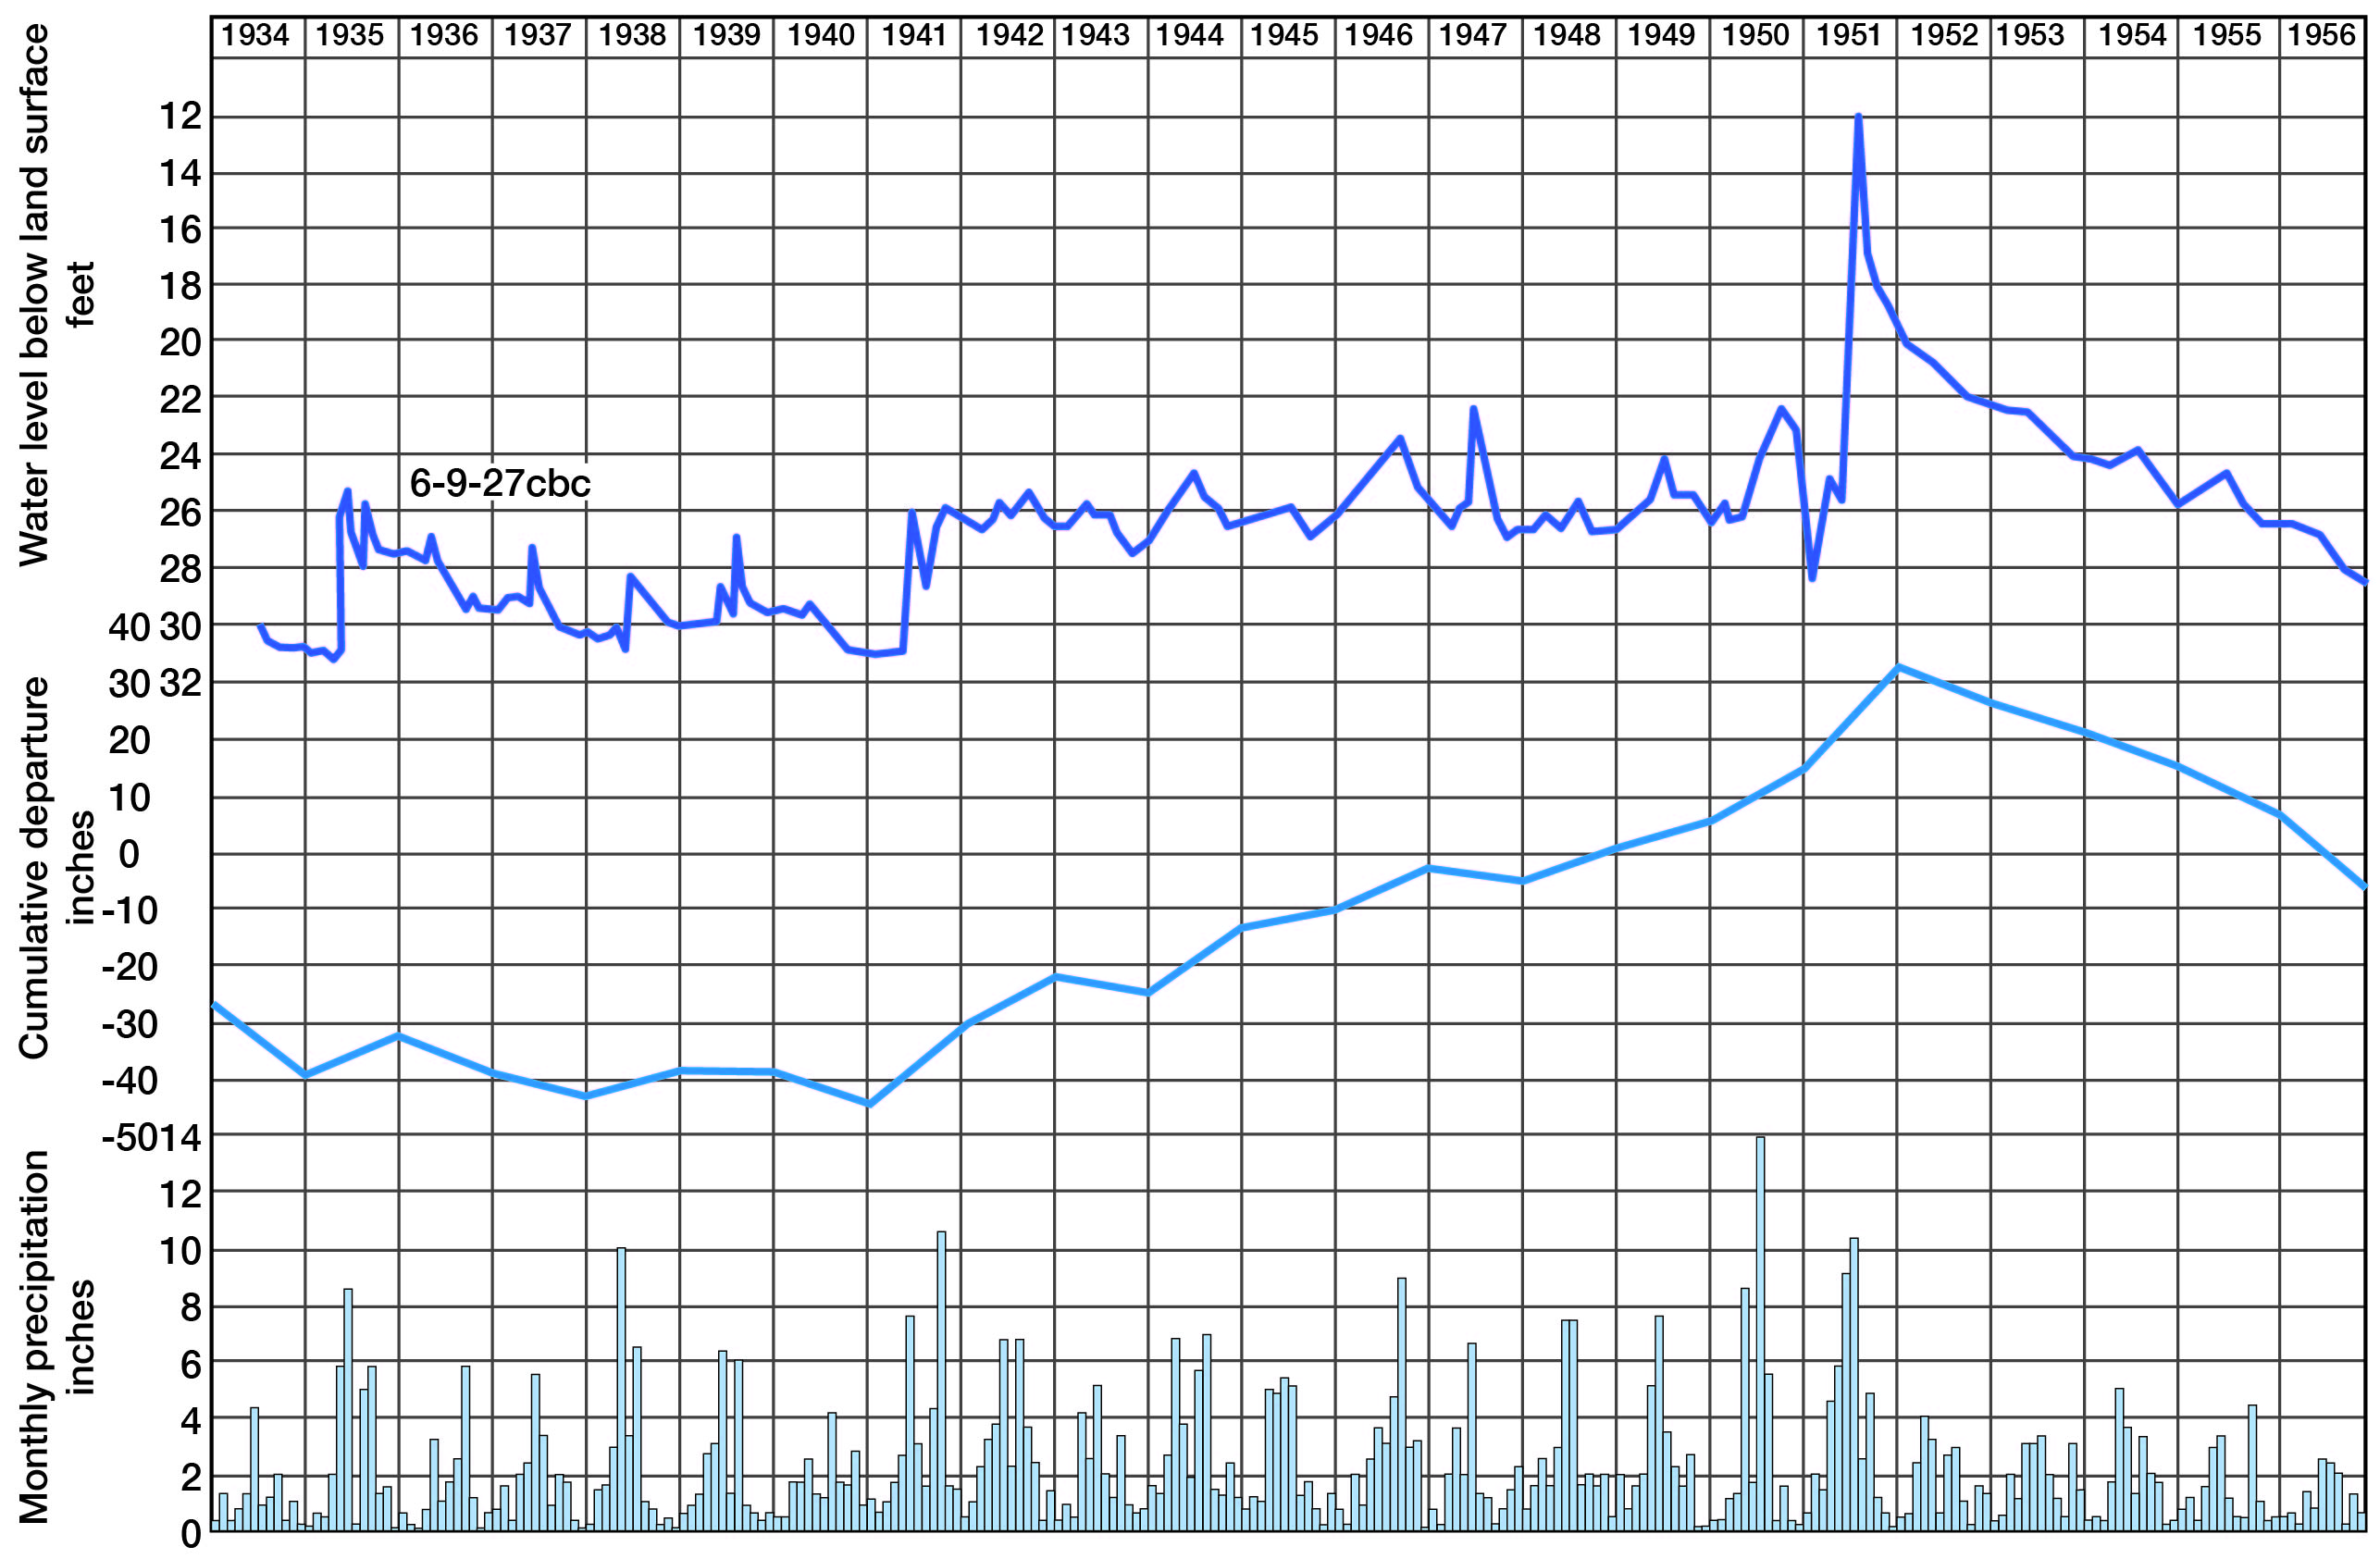
Hydrographs showing the fluctuations of the water level in 12 observation wells and graphs showing monthly precipitation are given in Figures 8 and 9. The graphs show the normal precipitation in the area of the wells, the monthly precipitation, and the cumulative departure from the normal annual precipitation. Figure 10 is a hydrograph of a well near Glen Elder having a 22-year record. The graphs indicate that, for a large part of the record, precipitation and fluctuations of the water levels correlate closely. Records of these water levels are published annually by the U. S. Geological Survey (1935-56). Water-level measurements in well 6-9-27abc from 1934 to 1956 are given in Table 16.
Figure 8--Hydrographs showing fluctuations of water levels in six wells, and graphs showing monthly precipitation and annual cumulative departure from normal precipitation at Beloit.
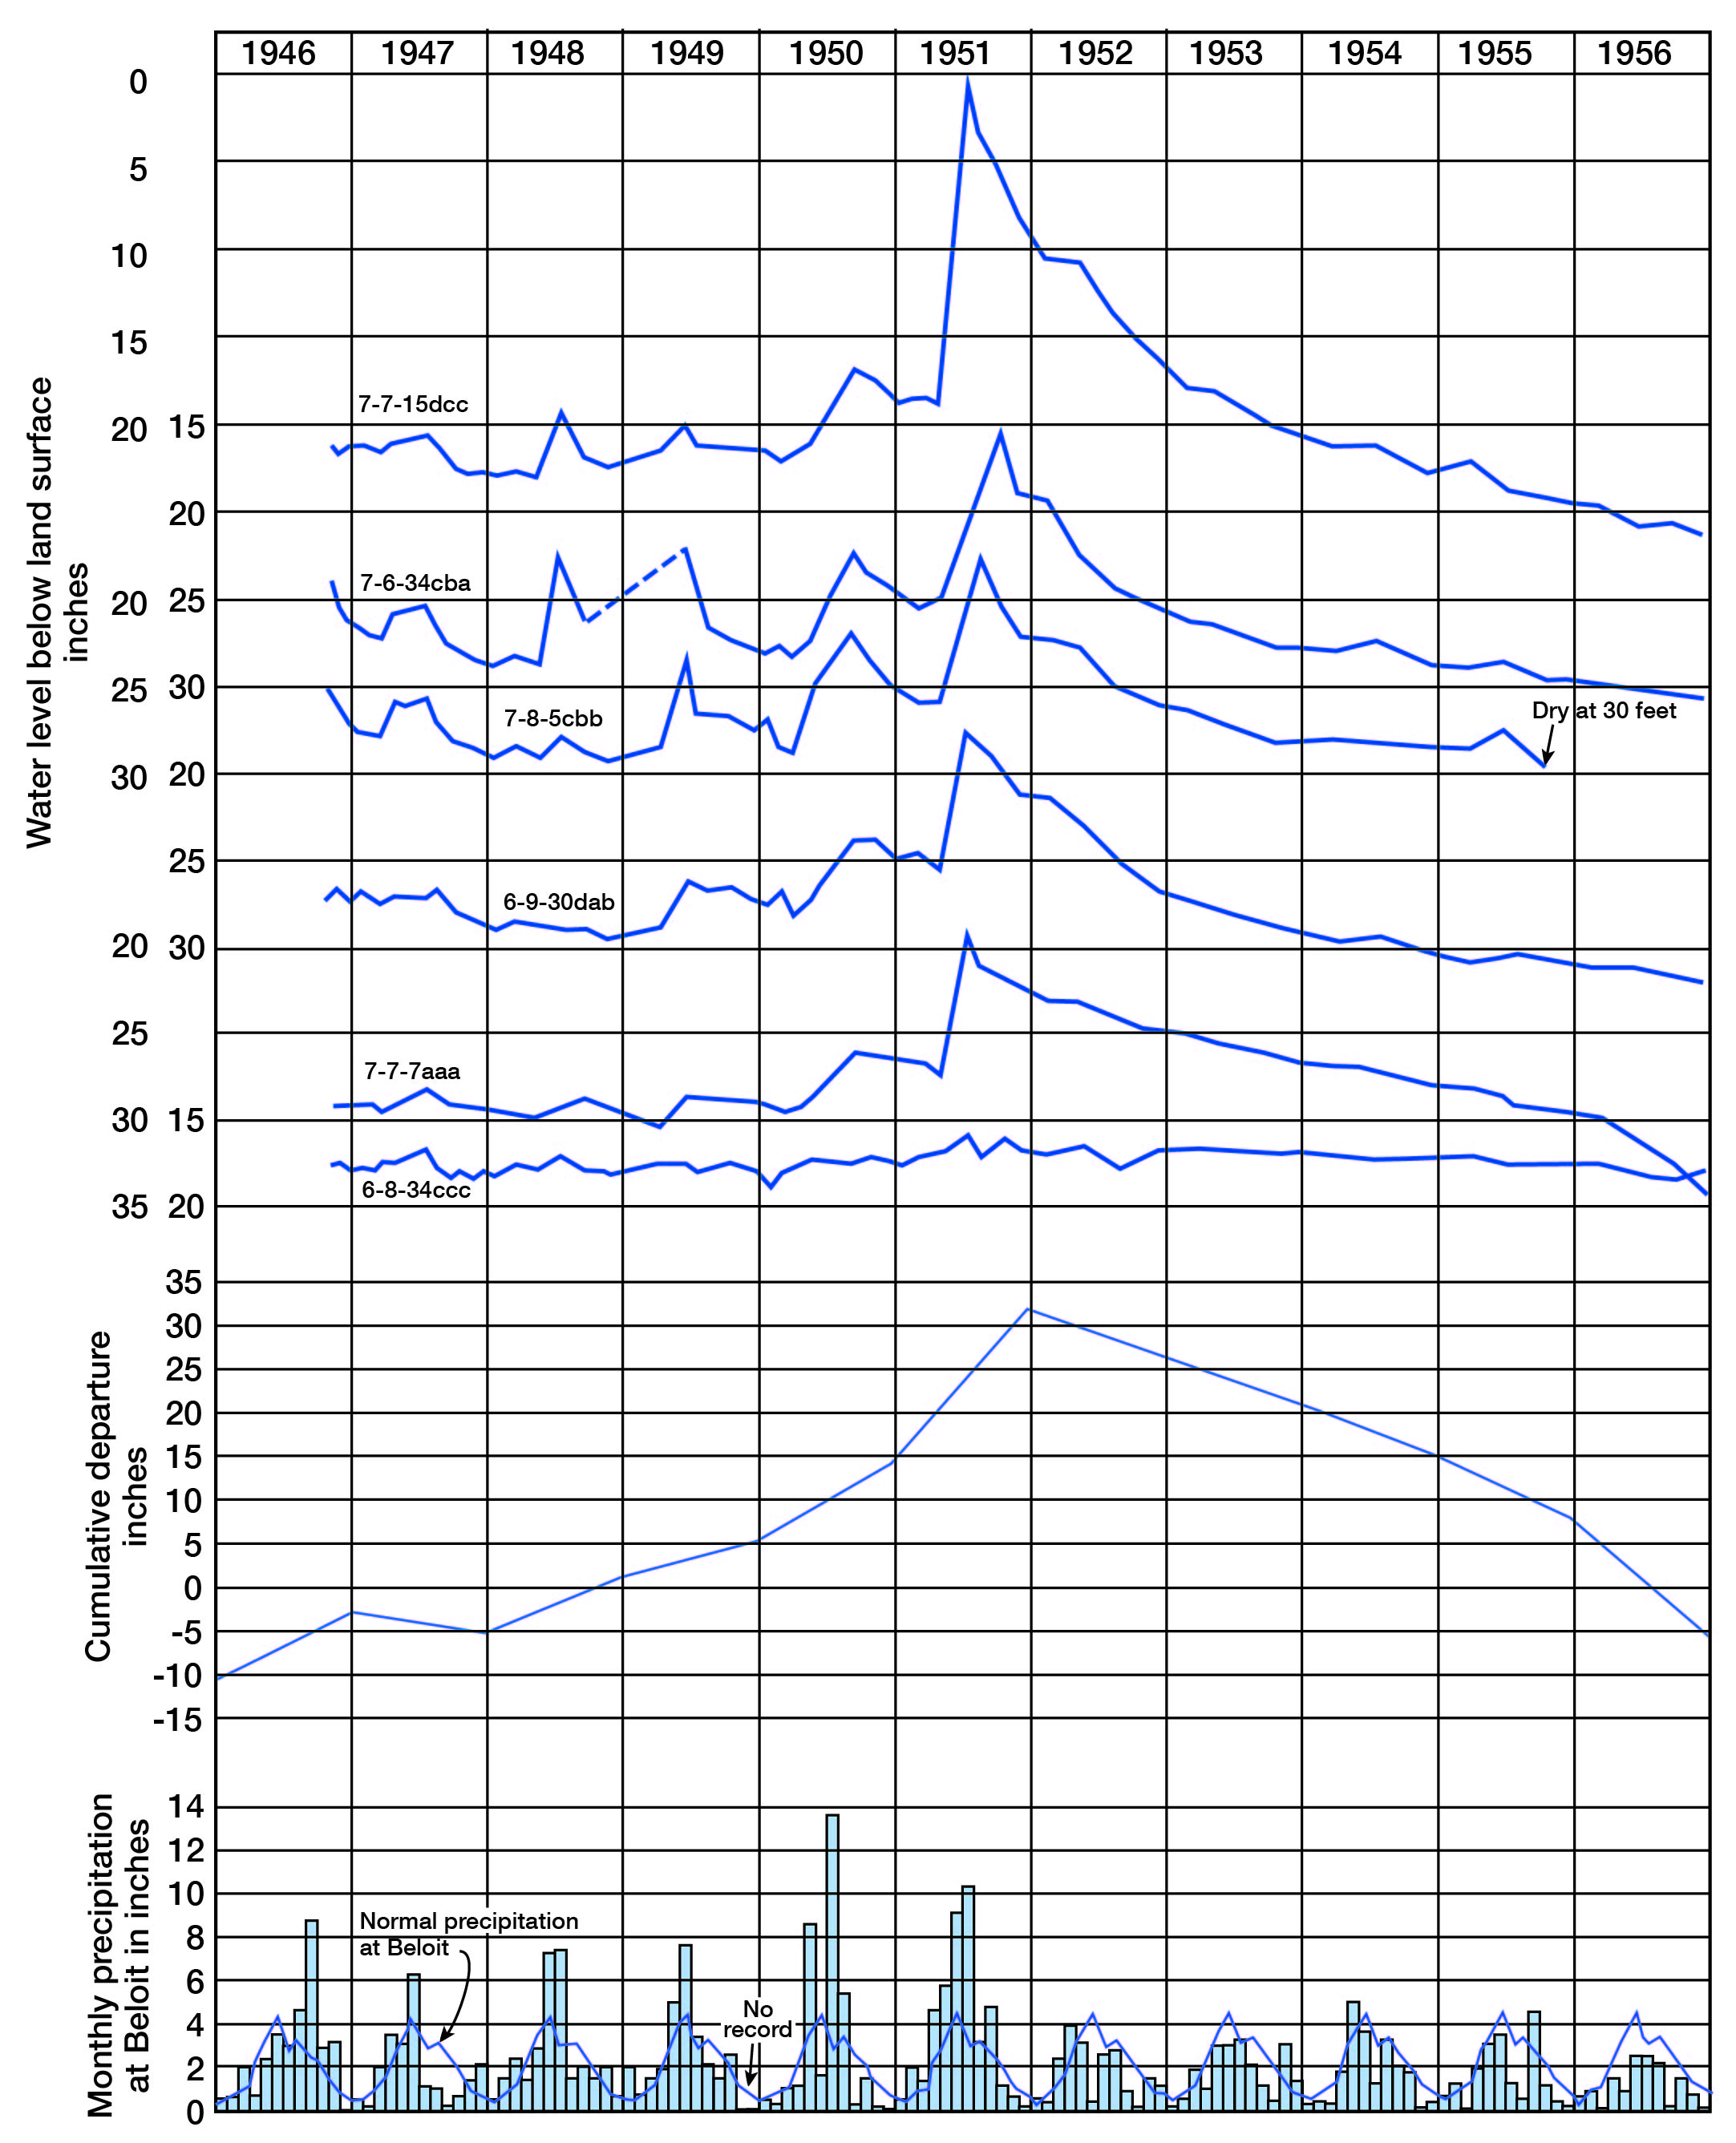
Figure 9--Hydrographs showing fluctuations of water levels in four wells, and graphs showing monthly precipitation and annual cumulative departure from normal precipitation at Beloit.
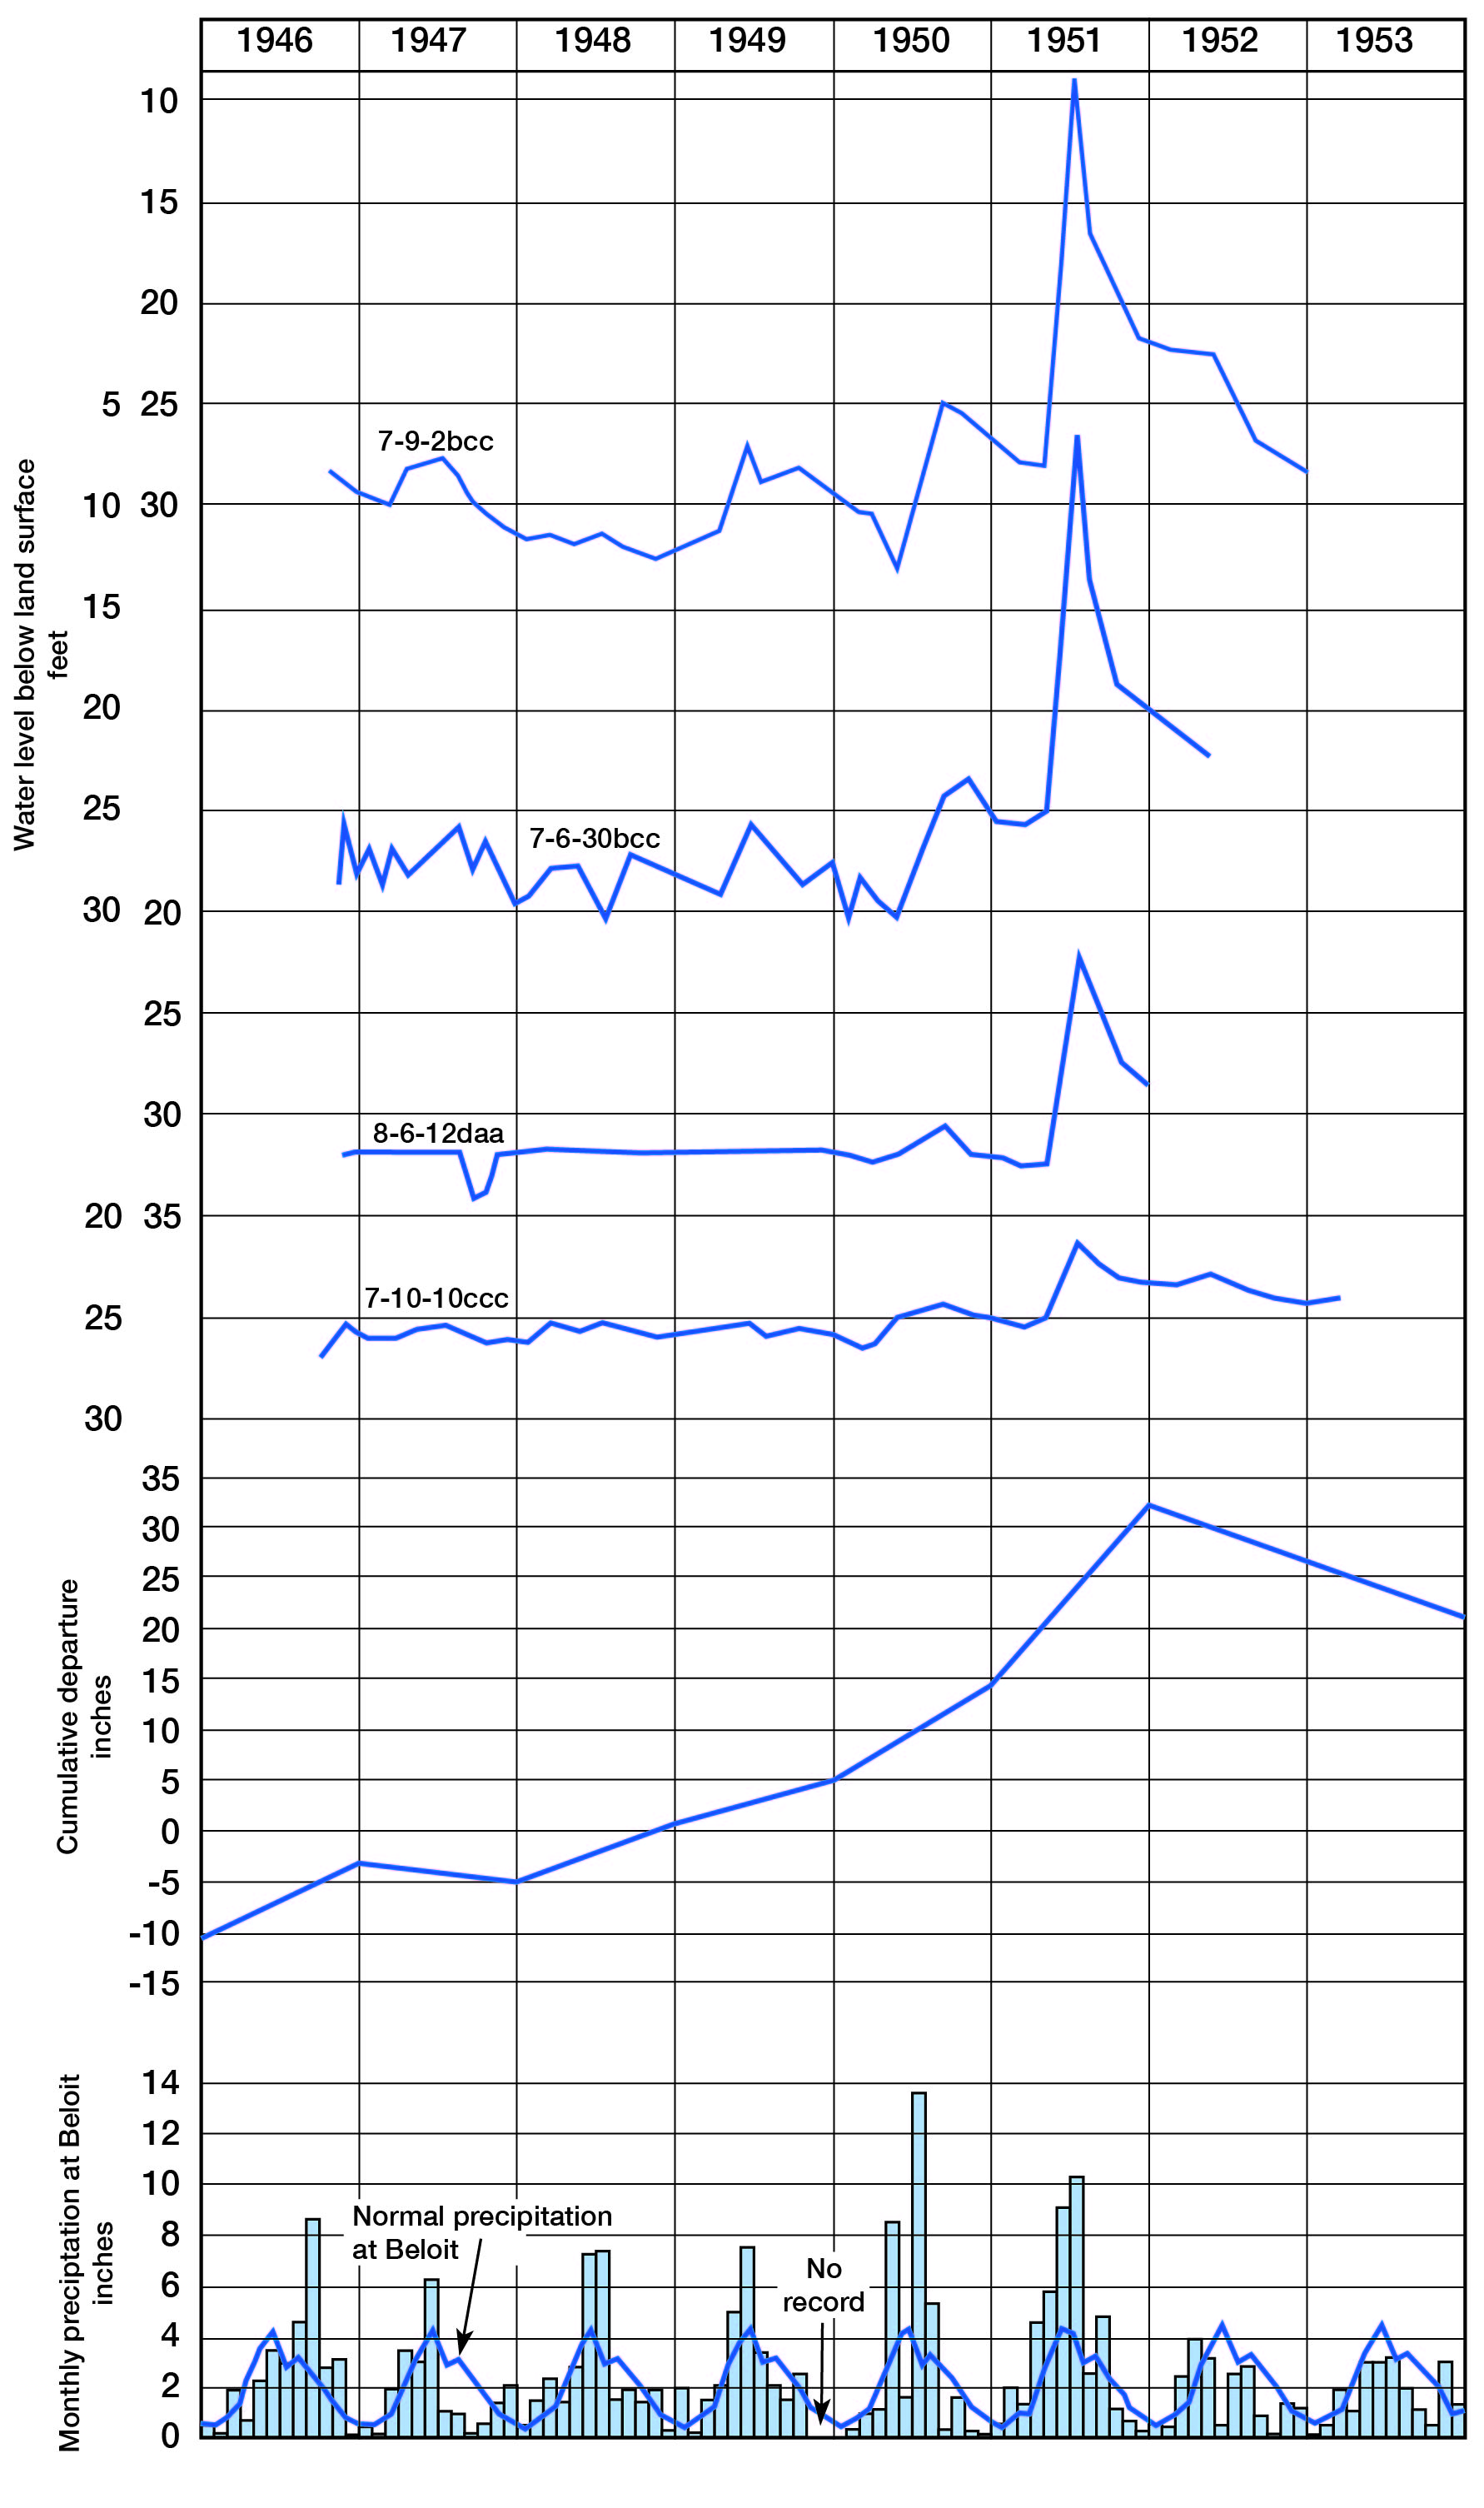
Figure 10--Hydrograph showing fluctuation of water levels of a wells, and graphs showing monthly precipitation and annual cumulative departure from normal precipitation at Beloit. A larger version of this figure is available.
Movement of Ground Water
The rate of movement of ground water is determined by the size, shape, number, and degree of connection of the open spaces in the aquifer and by the hydraulic gradient. The configuration of the water table in Solomon Valley is shown by water-table contours on Plate 3. The direction of ground-water movement is at right angles to the contour lines in the downslope direction. The movement of ground water is toward Solomon River and down the valley from the west toward the east. This conforms to the general rule that ground water under water-table conditions moves toward and with the major drainage.
In general, the slope of the water table varies inversely with the permeability of the aquifer. In areas where the water-bearing beds are less permeable, the slope of the water table steepens and the water-table contours are closely spaced; in areas of permeable water-bearing beds, the water-table contours are spaced farther apart. The downstream slope of the water table in Solomon Valley averages about 5 feet per mile across Mitchell County.
Ground-water Recharge
Recharge is the addition of water to the ground-water reservoir. Ground water in Mitchell County is derived primarily from local precipitation. One inch of water falling on 1 square mile amounts to more than 17 million gallons. Thus, the normal annual precipitation of 24.17 inches amounts to approximately 420 million gallons of water per square mile. Only a small part of the normal annual precipitation, however, reaches the ground-water reservoir. Part of the water that falls as precipitation is carried away as surface runoff by streams; part is evaporated into the atmosphere; part is absorbed by vegetation and later transpired to the atmosphere. Water that is not discharged by these processes percolates downward to the zone of saturation. After the water reaches the water table, it moves slowly down the gradient of the water table toward points of discharge such as springs, wells, or effluent streams.
The type of soil as well as the type of material above the water table are important in determining the amount of recharge in an area. A loose, permeable soil will allow penetration of water that would otherwise be discharged by surface runoff. A good vegetative cover will retard the velocity of runoff and will allow water to seep into the soil. Conditions are always much more favorable for rainfall infiltration during a gentle rain of considerable duration than during a sudden downpour. Conservation practices such as land terracing and contour farming tend not only to retard soil erosion but also to reduce runoff. Conservation practices such as these provide additional moisture for growing plants and where the precipitation is sufficient may increase the amount of recharge to the ground-water reservoir. In the upland of Mitchell County many ponds have been constructed to provide water for livestock. Most ponds are in small tributaries, and some of the water they impound eventually becomes ground-water recharge.
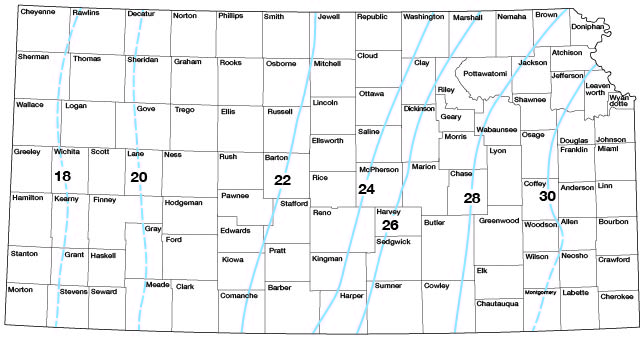
About 77 percent of the normal annual precipitation in Mitchell County falls during the months of April through September, when the climate is characterized by strong wind movement, high temperatures, and relatively low humidity. Consequently, a high rate of evaporation results, and much of the annual precipitation returns to the atmosphere. Because much of the precipitation falls during the growing season, a considerable part is returned to the atmosphere through absorption and transpiration by plants. In Mitchell County, the amount of annual precipitation that is discharged through evaporation and transpiration is estimated to be about 22 or 23 inches, as shown in Figure 11. The mean annual precipitation for Mitchell County is about 24 inches; thus, the amount of runoff, including both surface and ground-water runoff, averages only about 1 or 2 inches a year. The amount of recharge over Mitchell County is far from uniform, because of variations in soil conditions and topography and because of variations in the amount of precipitation from one place to another.
Figure 11--Map of Kansas showing lines of mean annual water loss, in inches (precipitation minus runoff) adapted from Williams and others (1940, pl. 2).
Ground-water Discharge
Ground-water discharge is the release of water from the zone of saturation. In Mitchell County, ground water is discharged into streams through effluent seepage, by discharge of springs, by transpiration of plants whose roots tap the zone of saturation or the capillary fringe, by evaporation, and by pumping of wells. Ground water leaves the valleys also by subsurface movement to the east and southeast.
Effluent seepage and springs--A stream whose bed is lower than the water table receives water from the zone of saturation. Water-table contour lines on Plate 3 indicate that ground water is moving toward Solomon River and its North and South Forks. Ground water also contributes to the flow of the larger tributaries of Solomon River, except during extended dry periods. A few small springs issue from the Greenhorn Limestone in Mitchell County. The springs generally are in stream beds or along stream banks where erosion has exposed the formation. Many of these springs are of the "wet weather" type and flow only during times of normal or excessive precipitation.
Evapotranspiration--Direct evaporation to the atmosphere from the zone of saturation is limited to areas where the water table is sufficiently near the land surface, such as along stream banks and in stream beds. As these conditions are restricted to a small part of Mitchell County, discharge by evaporation probably is not large. After floods or after long periods of exceptionally heavy rainfall when the water table is near the surface in local areas, appreciable amounts of ground water from lowland areas may be evaporated into the atmosphere.
Water may be taken into the roots of plants directly from the capillary fringe or from the zone of saturation, as well as from the soil zone, and discharged from the plants by evaporation from the leaves (transpiration). The depth from which plants will lift ground water varies with different plant species and with the type of material the roots penetrate. The lift of common field crops and grasses is only a few feet, but many water-loving plants, called phreatophytes, are capable of sending their roots deep in search of water. Certain desert plants are known to send their roots to depths of 50 or 60 feet (Meinzer 1923, p. 82). In Mitchell County, phreatophytes capable of obtaining ground water at considerable depths include alfalfa, cottonwood and willow trees, and certain weeds. Alfalfa may obtain ground water where the water table is as much as 30 feet below the surface. The discharge of ground water by transpiration is not significant in the upland of Mitchell County. In the Solomon Valley and some of the larger tributary valleys, however, alfalfa is one of the principal farm crops, and probably in some places considerable water is drawn directly from the zone of saturation through transpiration by this plant. In addition, many trees line the banks of Solomon River and its major tributaries and draw water from the zone of saturation.
Ground-water pumping--The pumping of ground water by wells is one of the principal means of ground-water discharge. The effect of pumping of wells upon ground water within an aquifer depends upon the size, extent, and permeability of the aquifer and the quantity of water pumped from the aquifer by all wells in the area. Discharge from domestic and stock wells obtaining water from sand and gravel in the alluvial deposits of the larger streams of Mitchell County produces little effect upon the water table. Discharge from wells in bedrock aquifers in the upland areas may deplete the water supply, especially during prolonged periods of deficient precipitation. The effect of pumping high-yielding wells from the alluvial deposits of the Solomon Valley is discussed [in Recovery of Ground Water].
Subsurface movement--Some ground water leaves the area by subsurface movement, principally toward the east and southeast. This movement of water takes place in the alluvium and terrace deposits of stream valleys, the most important of which are those of Solomon River and Salt Creek. Some water may move westward out of the county in the Dakota Formation and deeper rocks.
Waconda Springs
Waconda Springs, about 2 1/2 miles east of Cawker City, obtain water under artesian pressure from the Dakota Formation. As early as 1885, Hay recognized this probability (Hay, 1885). The largest spring, known as Great Spirit Spring, is the only one usually visited. Great Spirit Spring is at the northern edge of the flood plain of Solomon River. Another spring is on the flood plain about half a mile southeast of Great Spirit Spring. A third spring is in the bed of Solomon River, a short distance south of the second spring.
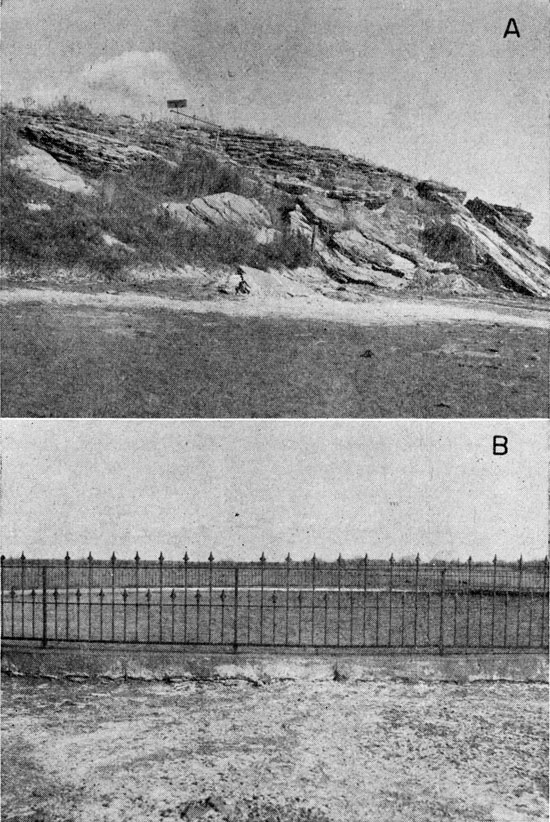
A mound of travertine has accumulated around the orifice of Great Spirit Spring. The travertine cone is about 300 feet wide at the base and rises about 30 feet above the flood plain. The top of the cone is approximately at the same level as the surface of the nearby Kirwin Terrace. The travertine of the cone consists of irregular thin sheets that tend to parallel the surface of the cone. The cone was circular in original development, but one side has been truncated by a chute across the flood plain caused by Recent stream action (Pl. 4A). The spring orifice, or vent at the top, is about 54 feet in diameter. The water of the spring rises nearly to the top of the mound, most of the water escaping through openings on the flanks of the mound (Pl. 4B).
Plate 4--A, Travertine cone of Great Spirit Spring. A chute, in foreground, and truncated one side of cone. B, Orifice of Great Sprit Spring.
Many opinions are expressed locally concerning the origin of Great Spirit Spring. Some people are of the opinion that the spring is of volcanic origin; others believe that it is connected with the ocean and is affected by the tides. The chemical analysis of the water shows that water from Great Spirit Spring and water from the Dakota Formation in Mitchell County are very much alike, both having a very high content of sodium, sulfate, and chloride.
Thus, Waconda Springs seem to be artesian springs in which water from the Dakota Formation rises in cracks or fissures to the surface under hydrostatic pressure. That water from the Dakota Formation will rise to the level of the Kirwin Terrace was demonstrated at a test hole in the SW cor. sec. 32, T. 6 S., R. _8 W., about 7 miles east of Waconda Springs. This test hole was drilled through the terrace deposits and into sandstone of the Dakota Formation. Until the hole was plugged, water that was salty to the taste flowed at the surface.
Swineford and Frye (1955) postulated a mechanism to account for Great Spirit Spring and its mound of travertine. They assumed a fault zone in the underlying Cretaceous bedrock through which artesian water from the Dakota Formation is transmitted upward via a tubelike vent through the fresh-water zone in the overlying alluvial deposits. The walls of the vent were made impermeable by precipitation, in the interstices of the alluvial material, of calcium carbonate from the mineralized artesian water.
Swineford and Frye (1955) dated the age of Great Spirit Spring as relatively recent by the association of its travertine cone with the terrace deposits and flood plain of the Solomon River valley. They concluded that the building of the travertine cone started less than 8,000 years ago and that the deposition of travertine may have terminated as much as 1,000 years ago. The chemical composition of water from Great Spirit Spring is given in Table 2.
Table 2--Chemical composition of water from Great Spirit Spring, November 1954 (Analysis by Howard Stoltenberg, Chemist, Division of Sanitation, Kansas State Board of Health).
| Constituents | PPM |
|---|---|
| Calcium (Ca++) | 213 |
| Magnesium (Mg++) | 413 |
| Sodium (Na+) | 6,230 |
| Silica (SiO2) | 6.0 |
| Iron (total Fe) | .52 |
| Manganese (Mn) | .15 |
| Total solids | 18,800 |
| Total hardness as CaCO3 |
2,230 |
| Carbonate (CO3--) | 0.0 |
| Bicarbonate (HCO3-) | 1,720 |
| Sulfate(SO4--) | 370 |
| Chloride (Cl-) | 7,700 |
| Nitrate (NO3-) | 2.0 |
| Fluoride (F-) | 1.6 |
Recovery of Ground Water
Discharge from a well (other than a flowing artesian well) is effected by the operation of a pump or some other lifting device. When a well is at rest, the head of water inside the well is in equilibrium with that of water outside the well. When water is discharged from a well, a difference in head is established between the water inside the well and water in the surrounding aquifer. As a result of this differential head, water moves from the aquifer toward the well.
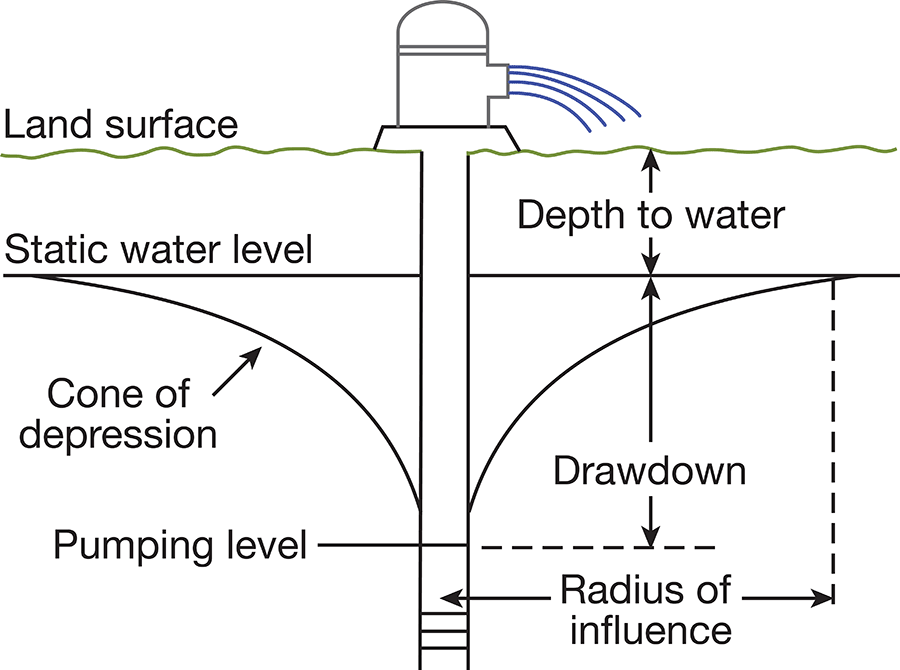
When water is withdrawn from a well, the water level in the vicinity of the well is lowered to form what is called the cone of depression (Fig. 12). The lateral extent of the cone of depression is called the area of influence, and the vertical distance that the water level is lowered is called the drawdown. When pumping stops, the cone of depression gradually fills with water from the surrounding area until equilibrium is again reached between the water level in the well and the surrounding aquifer. A higher pumping rate in a well produces a greater drawdown; thus, water moves toward the well under a steeper gradient and at a greater rate. When large quantities of water are withdrawn from a high-yielding well, such as an irrigation well, the water level drops rapidly at first, but gradually drops more slowly until it becomes almost stationary. When pumping stops, the water level rises rapidly at first, gradually rising more slowly until it finally reaches approximately its original position. A recovery curve of irrigation well 7-6-20bdd is shown in Figure 13.
Figure 12--Diagrammatic section of a well that is being pumped, showing its drawdown, cone of depression, and radius of influence, after Meinzer (1932a, fig. 30).
The character, thickness, and extent of the water-bearing materials as well as the construction and condition of the well determine the yield and resultant drawdown of a well. If the water-bearing material is coarse, well rounded, and uniform in size, it will readily yield large quantities of water and have relatively little drawdown. If the water-bearing material is fine or poorly sorted, it will offer more,resistance to the flow of water toward the well and decrease the yield and increase the drawdown.
Hydrologic Properties of water-bearing Materials
Porosity and specific yield--The amount of water that can be stored in an aquifer depends upon the porosity of the aquifer. Porosity is expressed quantitatively as the percentage of the total volume of material that consists of open spaces. An aquifer is said to be saturated when all its open spaces are filled with water.
Not all the water will drain from the aquifer, some being held by molecular attraction. The part that drains from the aquifer is called the specific yield and the part that is retained is called the specific retention. The specific yield of a water-bearing formation is defined by Meinzer (1923a, p. 28) as the ratio of the volume of water that a saturated sample of the formation will yield by gravity, divided by the volume of the sample. The specific yield is a measure of the quantity of water that a formation will yield when it is drained by a lowering of the water table and is usually stated as a percentage.
Permeability and transmissibility--The coefficient of permeability of an aquifer is defined as the rate of flow of water, in gallons per day, through a square foot of its cross section, under a hydraulic gradient of 1 foot per foot, at a temperature of 60° F. The field coefficient of permeability is the same, except that it is measured at the prevailing temperature rather than at 60° F. The coefficient of permeability of water-bearing materials may be stated as discharge per unit of area per unit of hydraulic gradient.
The coefficient of transmissibility is a function similar to the coefficient of permeability. The coefficient of transmissibility may be expressed as the rate of flow of water, in gallons per day, through a vertical strip of the aquifer 1 foot wide, under a hydraulic gradient of 1 foot per foot, at the prevailing temperature. The coefficient of transmissibility is equal to the field coefficient of permeability multiplied by the saturated thickness of the aquifer. Both permeability and transmissibility can be conveniently expressed for field use as the flow in gallons per day, across a section 1 mile wide under a hydraulic gradient of 1 foot per mile, rather than a section 1 foot wide under a gradient of 1 foot per foot.
Aquifer tests--The permeability and transmissibility of the alluvial materials in Solomon Valley were calculated from an aquifer test by use of the recovery method developed by Theis (1935, p. 522) and described also by Wenzel (1942, p. 94). According to the recovery formula:
T = (264Q log10 t/t') / s'
in which T is the coefficient of transmissibility, in gallons per day per foot,
Q is the pumping rate, in gallons per minute,
t is the time since pumping began, in minutes,
t' is the time since pumping stopped, in minutes, and,
s' is the residual drawdown at the pumped well at time t', in feet.
The residual drawdown (s') at any time after pumping ceases (t') is computed by subtracting the static water-level measurement before pumping began from the water-level measurement made at time t'. The ratio of log10 t/t' to s' may be determined graphically by plotting log10 t/t' against corresponding values of s'. This procedure is simplified by plotting t/t' on the logarithmic coordinate and s' on the arithmetic coordinate of semilogarithmic paper (Fig. 13). If log10 t/t' is taken over one log cycle, it will become unity and s' will be the difference in drawdown over one log cycle. The above formula then reduces to:
T = 264Q / Δs'
in which Δs' is the change in residual drawdown for one log cycle.
Figure 13--Curve obtained by plotting s' against t/t' for aquifer test using well 7-6-20bdd.
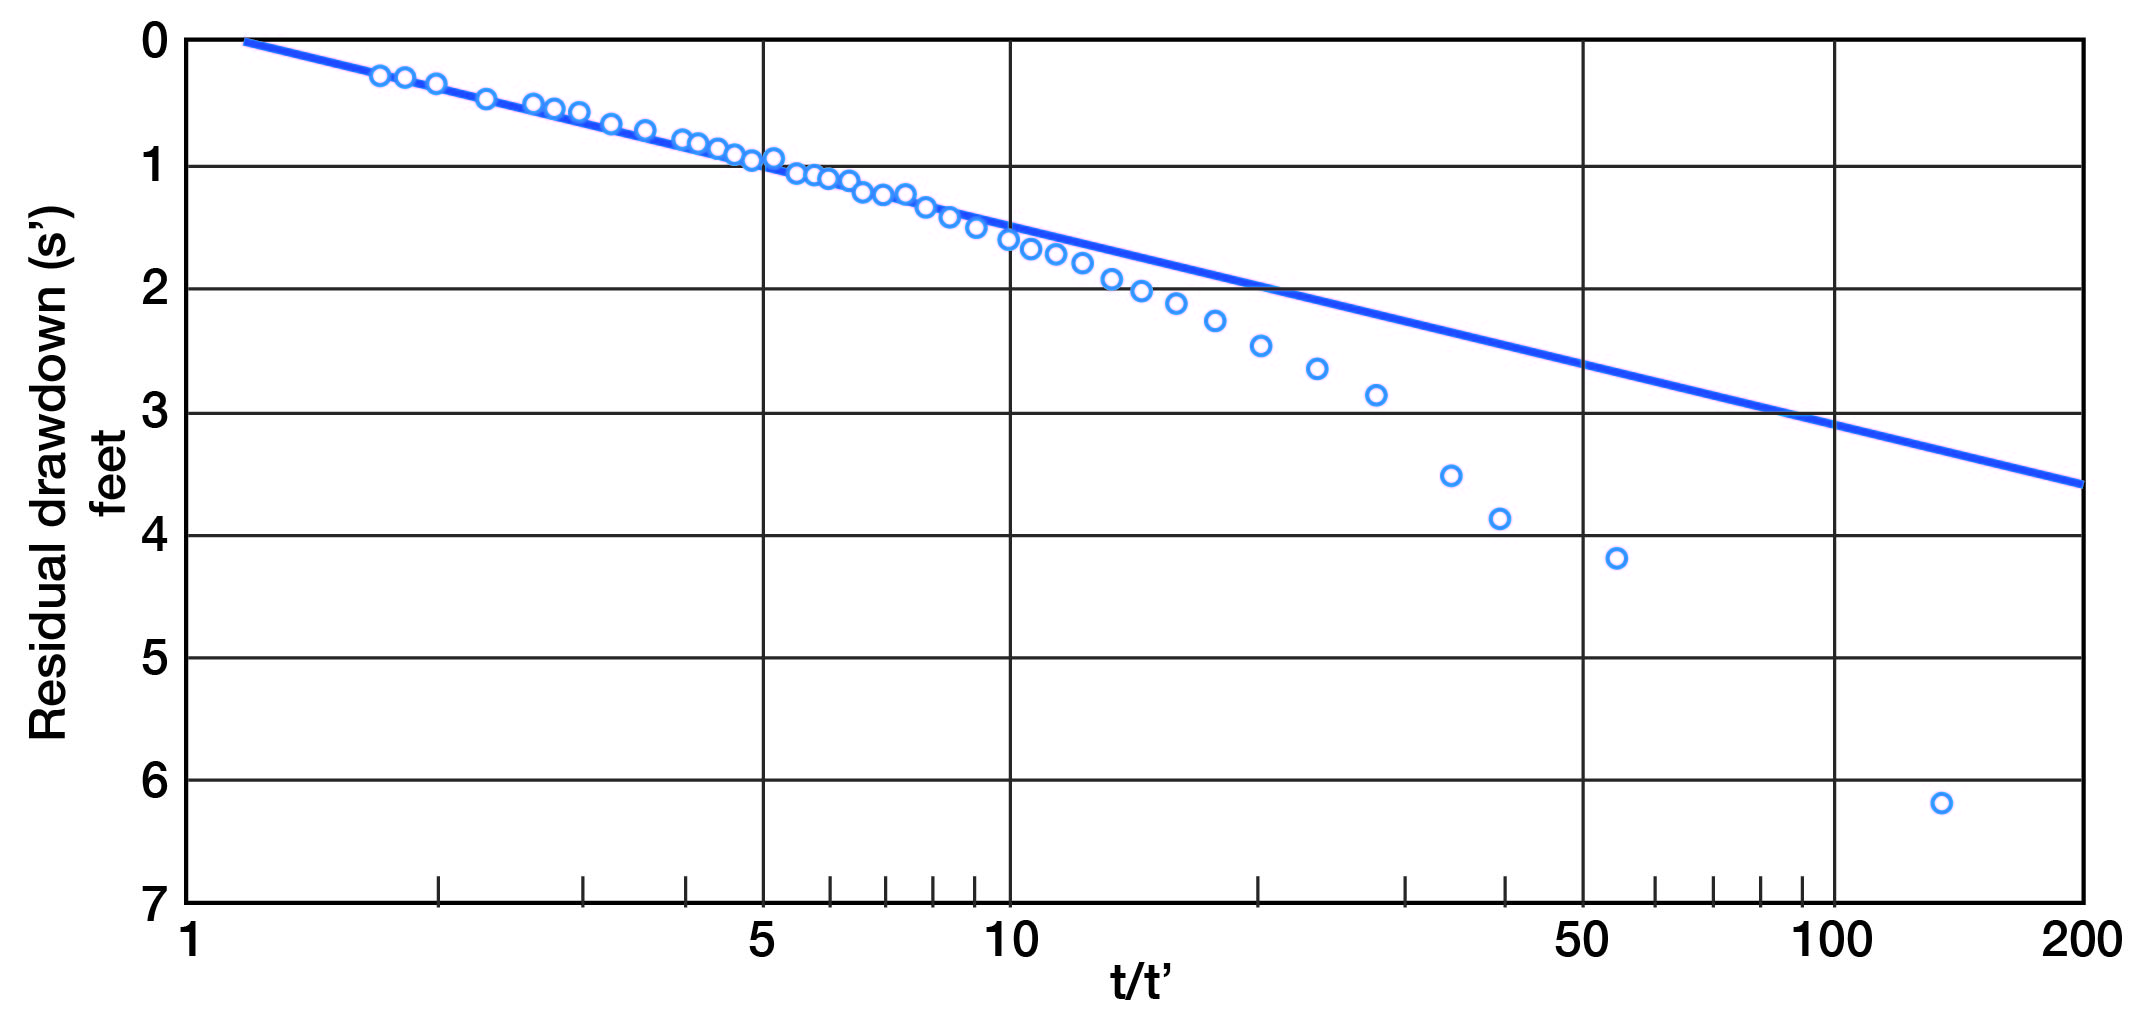
An aquifer test using irrigation well 7-6-20bdd, owned by Henry Remus, was made on September 30, 1954. The well was pumped 4 1/2 hours at a rate of 256 gallons per minute and the depth to water was measured frequently. Depth-to-water measurements were made frequently during the recovery period for 6 1/2 hours after pumping ceased. The data used in the calculation of the coefficients of transmissibility and permeability are given in Table 3. The time-versus-drawdown curve is shown in Figure 13.
Table 3--Data on aquifer test using well 7-6-20bdd, made on September 30, 1954.
| Time since pumping began, minutes (t) |
Time since pumping ended, minutes (t') |
t/t' | Depth to water level, feet |
Drawdown or residual drawdown, feet |
|---|---|---|---|---|
| 0 | 9.49 | 0 | ||
| 35 | 35.40 | 25.91 | ||
| 65 | 31.97 | 22.48 | ||
| 90 | 33.54 | 24.05 | ||
| 120 | 32.77 | 23.28 | ||
| 150 | 33.80 | 24.31 | ||
| 180 | 35.53 | 26.04 | ||
| 210 | 33.10 | 23.61 | ||
| 240 | 34.97 | 25.48 | ||
| 268 | 35.99 | 26.50 | ||
| 270 | 0 | |||
| 272 | 2 | 136.0 | 15.65 | 6.16 |
| 275 | 5 | 55.0 | 13.65 | 4.16 |
| 277 | 7 | 39.6 | 13.33 | 3.84 |
| 278 | 8 | 34.7 | 13.00 | 3.51 |
| 280 | 10 | 28.0 | 12.33 | 2.84 |
| 282 | 12 | 23.5 | 12.11 | 2.62 |
| 284 | 14 | 20.3 | 11.91 | 2.42 |
| 286 | 16 | 17.9 | 11.74 | 2.25 |
| 288 | 18 | 16.0 | 11.60 | 2.11 |
| 290 | 20 | 14.5 | 11.49 | 2.00 |
| 292 | 22 | 13.3 | 11.40 | 1.91 |
| 294 | 24 | 12.2 | 11.28 | 1.79 |
| 296 | 26 | 11.4 | 11.21 | 1.72 |
| 298 | 28 | 10.6 | 11.14 | 1.62 |
| 300 | 30 | 10.0 | 11.07 | 1.58 |
| 303 | 33 | 9.2 | 10.98 | 1.49 |
| 306 | 36 | 8.5 | 10.90 | 1.41 |
| 309 | 39 | 7.9 | 10.85 | 1.36 |
| 312 | 42 | 7.4 | 10.74 | 1.25 |
| 315 | 45 | 7.0 | 10.72 | 1.23 |
| 318 | 48 | 6.6 | 10.69 | 1.20 |
| 321 | 51 | 6.3 | 10.62 | 1.13 |
| 324 | 54 | 6.0 | 10.57 | 1.08 |
| 327 | 57 | 5.7 | 10.56 | 1.07 |
| 330 | 60 | 5.5 | 10.53 | 1.04 |
| 335 | 65 | 5.1 | 10.47 | .98 |
| 340 | 70 | 4.9 | 10.42 | .93 |
| 345 | 75 | 4.6 | 10.39 | .90 |
| 350 | 80 | 4.4 | 10.34 | .85 |
| 355 | 85 | 4.2 | 10.31 | .82 |
| 360 | 90 | 4.0 | 10.28 | .79 |
| 375 | 105 | 3.6 | 10.18 | .69 |
| 390 | 120 | 3.2 | 10.13 | .64 |
| 405 | 135 | 3.0 | 10.07 | .58 |
| 420 | 150 | 2.8 | 10.02 | .53 |
| 435 | 165 | 2.6 | 10.00 | .51 |
| 480 | 210 | 2.3 | 9.90 | .41 |
| 540 | 270 | 2.0 | 9.81 | .32 |
| 600 | 330 | 1.8 | 9.77 | .28 |
| 660 | 390 | 1.7 | 9.75 | .26 |
The computations are as follows:
T = (264)(256) / 1.60 = 42,000 gpd/ft.
Pf = 42,000 / 31.5 = 1,300 gpd/ft2
The coefficient of transmissibility is computed to be about 42,000 gallons per day per foot. The coefficient of permeability, which is obtained by dividing the transmissibility by the thickness of the water-bearing material, 31.5 feet, is about 1,300 gallons per day per square foot.
An aquifer test using irrigation well 7-8-1adc, owned by Gerald Smith, was made on June 9, 1955. The well was pumped about 2 1/2 hours at a rate of 650 gallons per minute and the depth to water was measured frequently. Depth-to-water measurements were made frequently during the recovery period for about 6 hours after pumping ceased. The transmissibility computed from these data was much too high and has been omitted from this report, but the data are given to show that the local permeability of the water-bearing material is high (Table 4).
Table 4--Data on aquifer test using well 7-8-1adc, made on June 9, 1955.
| Time since pumping began, minutes (t) |
Time since pumping ended, minutes (t') |
t/t' | Depth to water level, feet |
Drawdown or residual drawdown, feet |
|---|---|---|---|---|
| 0 | 35.27 | 0 | ||
| 5 | 46.55 | 11.28 | ||
| 8 | 42.40 | 7.13 | ||
| 12 | 42.30 | 7.03 | ||
| 20 | 42.29 | 7.02 | ||
| 25 | 42.31 | 7.04 | ||
| 35 | 42.30 | 7.03 | ||
| 50 | 42.32 | 7.05 | ||
| 60 | 42.13 | 6.86 | ||
| 73 | 42.25 | 6.98 | ||
| 85 | 42.36 | 7.09 | ||
| 130 | 42.45 | 7.18 | ||
| 135 | 42.42 | 7.15 | ||
| 155 | 42.43 | 7.16 | ||
| 158 | 0 | |||
| 159 | 1 | 159.0 | 35.79 | 0.52 |
| 161 | 3 | 53.7 | 35.70 | 0.43 |
| 162 | 4 | 40.5 | 35.66 | 0.39 |
| 164 | 6 | 27.3 | 35.62 | 0.35 |
| 167 | 9 | 18.6 | 35.60 | 0.33 |
| 170 | 12 | 14.2 | 35.58 | 0.31 |
| 175 | 17 | 10.3 | 35.54 | 0.27 |
| 180 | 22 | 8.2 | 35.53 | 0.26 |
| 186 | 28 | 6.6 | 35.52 | 0.25 |
| 192 | 34 | 5.6 | 35.50 | 0.23 |
| 196 | 38 | 5.2 | 35.49 | 0.22 |
| 230 | 72 | 3.2 | 35.44 | 0.17 |
| 365 | 207 | 1.7 | 35.38 | 0.11 |
The approximate rate of movement of water through the alluvium of the Solomon Valley can be obtained by application of the following formula: v = PI/395p, where v is the average velocity of the ground water in feet per day, P is the coefficient of permeability, defined in Meinzer's units (gallons per day per square foot under a hydraulic gradient of 100 percent and a temperature of 60° F), I is the hydraulic gradient in feet per mile, and p is the porosity in percentage. By substitution of the coefficient of permeability of the water-bearing material at well 7-6-20bdd of 1,300 gallons a day per square foot, a hydraulic gradient of 5 feet per mile, and an assumed porosity of 30 percent, the average velocity of the ground water can be computed by the above formula as follows:
v = (1,300 X 5) / (395 X 30) = 0.5 foot per day.
Prev Page--Geology || Next Page--Ground water utilization and quality
Kansas Geological Survey, Geology
Placed on web June 16, 2009; originally published April 1959.
Comments to webadmin@kgs.ku.edu
The URL for this page is http://www.kgs.ku.edu/General/Geology/Mitchell/05_gw.html