![]()
Prev Page--Start of Ground Water || Next Page--Recharge and Discharge
Ground Water, continued
The Water Table
The upper surface of the zone of saturation in ordinary permeable soil or rock has been defined as the ground-water table, or simply the water table. Where the upper surface is in impermeable material the water table is absent. The water table is not a plane surface in all parts of the area, but in places has irregularities comparable with and related to those of the land surface, although it is less rugged. It does not remain stationary but fluctuates up and down. The irregularities are caused chiefly by local differences in gain and loss of water, and the fluctuations are caused by variations from time to time in gain or loss of water. The water-table contours shown on Plate 2 were based on water-level measurements made during the summers of 1941 (Grant and Haskell Counties) and 1942 (Stevens County) and represent the approximate shape and slope of the water table at the time the measurements were made. Fluctuations in water level, particularly in the areas of shallow water, might cause considerable change in the shape and slope.
Shape and Slope
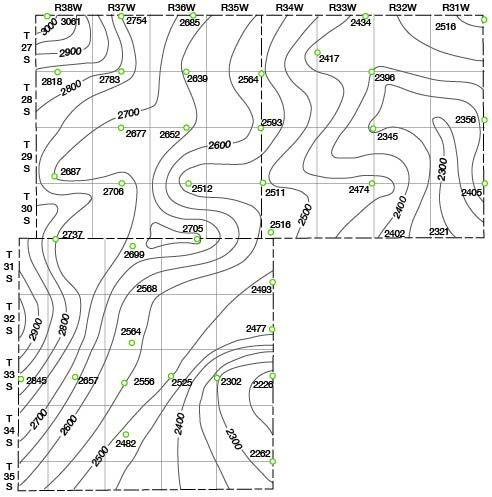
The shape and slope of the water table in Grant, Haskell, and Stevens Counties are shown on the map (Pl. 1) by contours drawn on the water table. Each point on the water table along a contour has the same altitude. The water-table contours show the configuration of the water surface just as topographic contours show the shape of the land surface. The direction of movement of the ground water is at right angles to the contours in the direction of the downward slope.
The map (Pl. 1) shows that the general movement of the ground water in Grant, Haskell, and Stevens Counties is toward the east, but that the slope and the direction of movement range considerably from one part of the area to another. The maximum slope is about 50 feet to the mile and is near Ryus in southeastern Grant County. The minimum slope is about 5 feet to the mile and is in eastern Haskell County. The average slope in the northern part of the area is 7.5 feet to the mile whereas the average slope in the southern part of the area is 10 feet to the mile.
The shape and slope of the water table determine the rate and direction of movement of ground water and are controlled by several factors. Irregularities in the shape and slope of the water table may be caused by: (1) configuration of the bedrock floor; (2) discharge of ground water into streams; (3) recharge of the groundwater reservoir by ephemeral streams; (4) unequal additions of water to the ground-water reservoir; (5) local differences in the permeability and thickness of the deposits; and (6) pumping of water from wells.
The shape of the underlying bedrock floor of Cretaceous and Permian rocks in Grant, Haskell, and Stevens Counties has no apparent effect upon the shape or slope of the water table. As indicated by Figure 10, the surface of the bedrock floor in Stevens County slopes toward the southeast whereas the water table slopes eastward and east-northeastward. Figure 10 also shows a trough in southeastern Haskell County and a ridge in northeastern Haskell County, neither of which is indicated by the shape of the water table. Figure 10 shows a high ridge in northwestern Grant County, which also is not indicated by the shape or slope of the water table.
Figure 10--Map of Grant, Haskell, and Stevens counties showing the topography of the rocks beneath the Tertiary and Quaternary deposits.
The discharge of ground water into the Cimarron and North Fork Cimarron Rivers has modified the shape and slope of the water table in this area, as indicated by the upstream flexure of the water table contours along the Cimarron River in the western part of its course through southern Grant County. Along North Fork Cimarron River the effect is noticeable both southeast and southwest of Ulysses.
Streams that flow only after rains are termed ephemeral or intermittent streams. Their channels lie above the water table and are dry much of the time. During periods of stream flow, part of the water in an ephemeral stream may seep into the stream bed and move downward to the ground-water reservoir; hence streams of this type are called losing or influent streams. Bear Creek in northwestern Grant County is an example of this type of stream. Water seeps into the stream bed and moves downward to the ground-water reservoir creating a ridge on the water table, as indicated by the downstream flexure of the water-table contours in the vicinity of Bear Creek (Pl. 1). The water-table ridge probably was caused in part by seepage of water from sinkholes in the vicinity of Bear Creek.
The Cimarron River is a losing stream in a part of its course in northwestern Stevens County, in southeastern Grant County, and in southwestern Haskell County (Pl. 5). As shown by Plate 1, there is a ridge on the water table beneath the Cimarron River from a point about 7 miles west of the Grant-Haskell line to about 3 miles below the point where the river crosses the Haskell-Seward line. North Fork Cimarron River is a losing stream in western and southeastern Grant County, but its effect on the shape of the water table could not be indicated on the water-table contour map because of insufficient data.
Unequal additions of water to the ground-water reservoir have caused some of the irregularities in the shape of the water table in the Grant-Haskell-Stevens area. In the northwestern part of Grant County, Bear Creek is a series of intermittent streams terminating in sinkholes. In addition, there are many other sinkholes or depressions in that area. After heavy rains, the water stands in the depressions until it evaporates or percolates downward to the water table (Pl. 6), and this is in part the cause of the ridge on the water table in the vicinity of Bear Creek. Similar though less pronounced depressions in many parts of the Grant-Haskell-Stevens area also contribute water to the ground-water reservoir. Conditions favorable for the addition of water to the ground-water reservoir are to be found in the sand-hills areas where there are many undrained basins underlain by moderately permeable rocks. (See Groundwater recharge.)
Local differences in permeability are among the principal factors affecting the shape and slope of the water table in this area. The area of steeply sloping water table in southeastern Grant County and southwestern Haskell County that is indicated by the closely spaced contours (Pl. 1), and which extends southeastward through southwestern Seward County and into Oklahoma, probably is caused by a relatively low permeability of the rocks through which the ground water moves. In western Grant and Stevens Counties the upper part of the zone of saturation is in the lower part of the Meade formation, which is primarily sand and gravel; hence water moves relatively freely through it and the slope of the water table is slight. In southeastern Grant and southwestern Haskell Counties, where the water table is in the clay and silt of the Rexroad formation, however, the water cannot move freely through the fine material and therefore the water table has a steep slope. The gradient of the river channel in this area is less than it is in areas upstream and downstream. Therefore, the water table gradient exceeds the stream gradient and the Cimarron becomes a losing stream (Fig. 11).
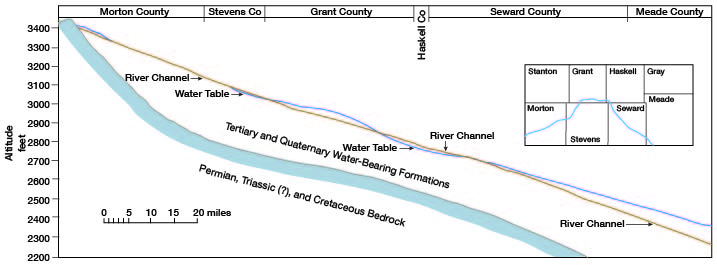
Figure 11 illustrates the relation of the channel of the Cimarron River to the level of the water table in adjacent upland areas. Where the water table is above the channel, the Cimarron River generally flows; and where the water table is below the channel, the Cimarron generally is dry. Throughout much of its course in eastern Morton County and northwestern Stevens County the channel of the Cimarron River is nearly level with or is below the level of the water table in adjacent areas. Figure 11 is based on water-level measurements made during the summers of 1941 and 1942 and may not represent accurately the conditions during other seasons or years.
Figure 11--Cross sections along Cimarron River between Point of Rocks in Morton County and the Kansas-Oklahoma line showing the relation of the river channel to the altitude of the water table and adjacent upland areas.
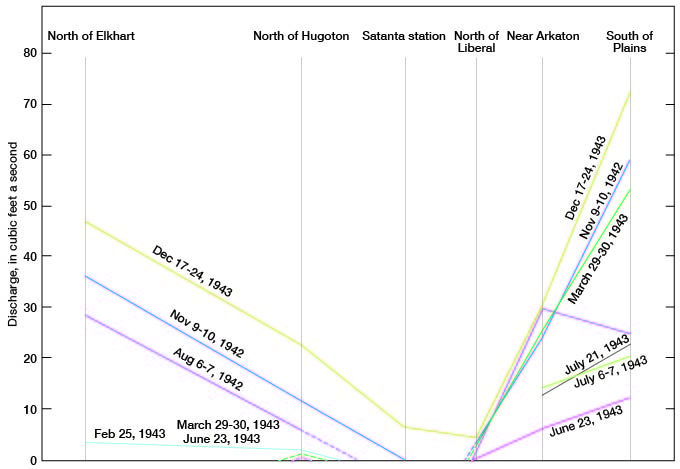
Some variations in stream flow in the Cimarron River are shown in Figure 12 which was compiled from data obtained by joint studies of the states of Kansas and Oklahoma and the Water Resources Branch of the U.S. Geological Survey. Measurements of stream flow along the Cimarron River show that the river valley between the Elkhart bridge and the Satanta station absorbs a large quantity of water. They also indicate that discharges of more than 40 cubic feet a second at the Elkhart bridge are required to produce a surface flow at Satanta. Small discharges have been observed in this losing section of the Cimarron River. When the stream is dry at the Elkhart bridge, discharges of as much as 1.13 cubic feet a second have been measured at the bridge north of Hugoton. Although the Cimarron River is a losing stream through Morton, Stevens, Grant, and Haskell Counties, there is a very rapid recovery of stream flow in Seward and Meade Counties.
Figure 12--Variations in stream flow in the Cimarron River.
Most of the water that is lost between Point of Rocks and the Satanta station is added to the ground-water reservoir although some is then lost by transpiration from vegetation on the valley floor. The relatively rapid addition of water to the ground-water reservoir in the losing sections of the stream generally forms a mound or ridge on the water table. The ground water moves from the ridge at approximately right angles to the stream. Water on the north or northwest side of the stream probably reenters the stream in a relatively short distance because the general movement of ground water is toward the east (Pl. 1). This may account for the small local areas where the Cimarron is a gaining stream. Ground water that moves south and southeastward from the ridge then flows eastward across the Cimarron Bend area. At least a part of this water reenters the Cimarron River between the Liberal bridge and the Forgan bridge. What effect the loss in stream flow between Point of Rocks and Satanta station has upon the gain in stream flow between the Liberal and Forgan bridges and upon the level of the water table in the Cimarron Bend area is not known. This could not be determined until the loss of water by transpiration and evaporation in the Cimarron Valley and the addition of water by ground-water recharge in the Cimarron Bend area are known.
Local depressions are formed on the water table when large quantities of water are pumped from wells. These generally are short-lived, however, because water moves in from adjacent areas to replenish the water that is withdrawn by pumping. There seems to have been no permanent lowering of the water table in this area by pumping from wells.
Relation to Topography
The depth to water level below the band surface in Grant, Haskell, and Stevens Counties is controlled largely by the configuration of the land surface. A map (Pl. 2) has been prepared showing by isobath lines the depths to water level in wells in the three counties. Isobath lines connect points of equal depth to water level. As shown on the map, the depths to water level in the Grant-Haskell-Stevens area range from less than 10 feet in the Cimarron Valley area to nearly 250 feet in the Haskell area. For the purpose of detailed description, Grant, Haskell, and Stevens Counties may be divided into eight areas based upon the depths to water level: (1) Syracuse upland, (2) Bear Creek depression, (3) Finney sand plain, (4) Stanton area, (5) Cimarron Valley area, (6) Haskell area, (7) Meade area, and (8) Cimarron Bend area. These areas are the same as the topographic divisions, and their locations and areal extent are described in the section on Topography and drainage on pages 16 to 21 (note Fig. 2).
Syracuse upland--On the Syracuse upland, which extends into northwestern Grant County, depths to water level range from about 50 feet near Bear Creek to about 120 feet at the northwest corner of the county, and the depths of wells range from about 60 feet to more than 130 feet. The Rexroad (?) and Meade formations are the principal water-bearing beds in this area.
Bear Creek depression--The area of sinkholes and depressions in the vicinity of Bear Creek is called the Bear Creek depression. As stated in the section on topography and drainage, it is difficult to distinguish the southern limit of the Bear Creek depression because it merges gradually into the Stanton area. In this discussion the limits shown in Figure 2 will be used. Wells in this area range in depth from about 50 feet to more than 110 feet and the water levels are 35 to 50 feet below land surface. The wells obtain water from are the Meade or Rexroad (?) formations or both.
Finney sand plain--Northeastern Grant County and northern Haskell County are a part of the Finney sand plain which extends northward to the Arkansas Valley in Kearny and Finney Counties. The depths to water level in wells range from a little more than 50 feet in the westernmost part of the area in Grant County and the northeastern corner of Haskell County to about 145 feet near the Grant-Haskell line. The wells in this area range in depth from about 70 feet to almost 200 feet. The principal water-bearing beds are the Meade or Rexroad (?) formations or both.
Stanton area--Most of western Grant County and the northwestern part of Stevens County are in the Stanton area which extends westward into Stanton, Hamilton, and Morton Counties. In Grant and Stevens Counties this is an area of shallow to intermediate depth to water, the water level in most of the area being less than 100 feet below band surface. The depth to water level in the area between Bear Creek and North Fork Cimarron River is in most places less than 50 feet, whereas in southwestern Grant County and northwestern Stevens County the depth to water level in most places is between 100 and 150 feet. Wells in the Stanton area obtain water from the Rexroad (?) or Meade formations or both; their depths range from 50 to more than 300 feet.
Cimarron Valley area--The valleys of the Cimarron River and its principal tributaries constitute the Cimarron Valley area (Fig. 2). Depths to water level are less than 10 feet in the lowlands along the Cimarron River, in the lower part of Lakin Draw, and in the lowlands in the central part of North Fork Cimarron Valley. Depths to water level are as much as 150 feet at the edges of the Cimarron and North Fork Cimarron Valleys near their confluence. The greatest depth to water in the Cimarron Valley is about 50 feet in southwestern Haskell County. The principal water-bearing formation in the Cimarron Valley is the alluvium. In the valleys of Lakin Draw, Sand Arroyo, and North Fork Cimarron River the Meade formation supplies most of the water to wells. In southeastern Grant County the slope of the water table exceeds the slope of the Cimarron River so that in southeastern Grant and southwestern Haskell Counties the water table is near the base of the alluvium (Pl. 3). Wells in this area obtain water from the Rexroad (?) formation and perhaps also from the Meade formation and from the alluvium, and range in depth from 15 to 61 feet.
Haskell area--Most of Haskell County and a large part of eastern Grant County lie within the Haskell area (Fig. 2) in which the depth to water level ranges from about 80 feet in the vicinity of Hickok to nearly 250 feet in northwestern Haskell County. The depth to water level is more than 150 feet in about 90 percent of the area, and is more than 200 feet in about 30 to 40 percent of the area. Wells in this area range in depth from slightly less than 100 feet to more than 300 feet, and most of them obtain water from the Rexroad (?) formation. A few get all or part of their water from the lower part of the Meade formation, and a few may obtain part of their water from the upper part of the Laverne formation.
Meade area--The headwaters of Crooked Creek in eastern Haskell County lie within the Meade area (Fig. 2). The depths to water level in this small area range from about 140 feet to 170 feet, and the depths of the wells range from about 150 to 200 feet. Most of the wells obtain water from the Rexroad formation.
Cimarron Bend area--Almost all of Stevens County and a small part of Grant County lie within the Cimarron Bend area, which also includes southern Morton and southwestern Seward Counties. The depths to water level range from about 75 feet in the area northwest of Feterita to about 215 feet in the area east of Moscow. The depths to water level in most of the area, however, are between 100 and 150 feet. The depths of wells in the Cimarron Bend area range from about 80 feet to more than 300 feet. The principal water-bearing formation is the Rexroad (?), but many wells get part of their water from the Meade formation and some of the deep wells may penetrate beds of the Laverne formation.
Fluctuations in Water Level
The water table does not remain stationary but fluctuates much like the water surface of any surface reservoir. Whether the water table rises or declines depends upon the amount of recharge into the ground-water reservoir and the amount of discharge. If the inflow exceeds the draft, the water table will rise; conversely, if the draft exceeds the inflow into the ground-water reservoir, the water table will decline. The water table fluctuates more by the addition or depletion of a certain quantity of water than does the level of a surface reservoir, because ground water occupies only part of the volume of a ground-water reservoir. If the sand and gravel of a water-bearing formation has an average specific yield of 25 percent, the addition of 1 foot of water to the sand and gravel will raise the water table in that material about 4 feet. Changes of water levels record the fluctuations of the water table and hence the recharge and discharge of the ground-water reservoir.
The principal factors that control the rise of the water table (ground-water recharge) in the Grant-Haskell-Stevens area are:
(1) the amount of rainfall that penetrates the soil and descends to the zone of saturation, (2) seepage from streams and depressions, and (3) the quantity of water added to the ground-water reservoir by underground movement from the west and northwest. The factors that cause a decline in the water table in this area (groundwater discharge) are: (1) movement into areas to the east and to the south, (2) evaporation and transpiration, (3) seeps and springs, and (4) pumpage from wells. If the quantity of ground water discharged from a ground-water reservoir during a year is greater than the recharge during that year, the water table will decline. During a period of dry years, however, the water table may decline, even though there has been little or no pumping from wells, but in a subsequent period of wet years the water table may rise. The decline of the water table during a dry year, therefore, does not necessarily mean that there has been an excessive withdrawal of water from the ground-water reservoir, for during dry years there is less recharge of the ground-water reservoir because of the decreased precipitation. At the same time the discharge of ground water is increased by greater evaporation and transpiration and by increased pumpage for irrigation. Conversely, during wet years the recharge from precipitation is increased and the loss of water by evaporation, transpiration, and pumpage is reduced.
The fluctuations of the water table in Grant, Haskell, and Stevens Counties were determined by observing the water levels in wells. Periodic water-level measurements were begun on 28 wells in Grant and Haskell Counties in May and June 1941, and on nine wells in Stevens County in October 1942. Water-level measurements in these wells were made monthly by Woodrow W. Wilson of the Federal Geological Survey and later by Allen Graffham and Howard Palmer of the Division of Water Resources of the Kansas State Board of Agriculture.
Water-level measurements in 1941, 1942, and 1943 have been published in annual water-level reports of the U.S. Geological Survey (Water-Supply Papers 938, 946, and 988), and future measurements will be published in ensuing reports of this series. The well numbers used in this report and the Water-Supply Papers are given in Table 7.
Table 7--Observation wells in Grant, Haskell, and Stevens Counties.
| Grant County | Haskell County | Stevens County | |||
|---|---|---|---|---|---|
| Well numbers in... | |||||
| this report | Water-Supply Papers 938, 946, and 988 |
this report | Water-Supply Papers 938, 946, and 988 |
this report | Water-Supply Papers 938, 946, and 988 |
| 4 | 6 | 136 | 13 | 242 | 28 |
| 18 | 5 | 141 | 1 | 245 | 21 |
| 22 | 1 | 143 | 3 | 265 | 29 |
| 24 | 4 | 144 | 14 | 266 | 27 |
| 28 | 2 | 153 | 4 | 288 | 30 |
| 42 | 14 | 157 | 8 | 294 | 15 |
| 43 | 7 | 165 | 15 | 299 | 10 |
| 51 | 9 | 170 | 6 | 309 | 26 |
| 61 | 3 | 171 | 5 | 311 | 12 |
| 64 | 11 | 204 | 7 | ||
| 71 | 8 | 206 | 12 | ||
| 73 | 13 | 209 | 11 | ||
| 82 | 15 | 217 | 9 | ||
| 120 | 10 | 227 | 10 | ||
Prev Page--Start of Ground Water || Next Page--Recharge and Discharge
Kansas Geological Survey, Geohydrology
Web version May 2002. Original publication date July 1946.
Comments to webadmin@kgs.ku.edu
The URL for this page is http://www.kgs.ku.edu/General/Geology/Grant/05_gw3.html