


Kansas Geological Survey, Open-File Rept. 96-1a
Proposed Management Areas--Page 5 of 16
Figure 3. Distribution of total dissolved solids (TDS) concentrations in ground waters in the Dakota aquifer in western and central Kansas. Water less than 1000 mg/L TDS is defined as fresh. Water with 1000-2000 mg/L TDS is usable for many purposes but is less desireable than freshwater. A concentration of 10,000 mg/L TDS is defined in the state regulations of the Kansas Corporation Commission as the upper limit of usable water; above 10,000 mg/L a water is classified as unusable or mineralized.
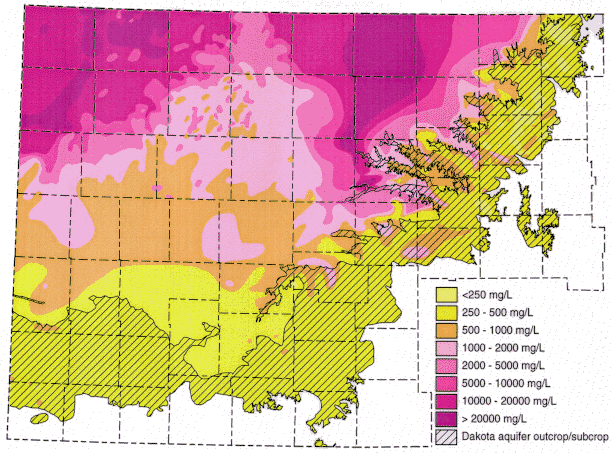
Ground water in the areas of the upper Dakota aquifer with high TDS or salinity (greater than 5,000 mg/L) shown in Figure 3 are of sodium-chloride type. Waters in the area of the confined aquifer with 500-2,000 mg/L TDS are generally soft (low calcium and magnesium content), sodium-bicarbonate in chemical type, and usually have elevated fluoride concentrations. Ground water with 2,000 to 5,000 mg/L TDS in the confined area are typically transitional between sodium-bicarbonate and sodium-chloride type. Waters in the outcrop and subcrop areas with less than 500 mg/L TDS are usually of calcium bicarbonate and sometimes of calcium, magnesium-bicarbonate type. Concentrations of TDS between 500 and 2,000 mg/L in waters in the outcrop/subcrop areas are often due to high calcium and sulfate levels such that the waters can be calcium-sulfate in type. Elevated sulfate concentrations can also produce sulfate type waters in less saline portions of the confined aquifer.
Where saline waters exist in the Dakota aquifer or in underlying strata, the salinity in the Dakota aquifer generally increases with depth. The rate of change with depth is seldom uniform; TDS is often substantially greater below low permeability layers which impede the upward movement of salinity. This is especially true where the Kiowa Formation is mainly shale and separates saltwater in the Cheyenne Sandstone from fresh or much less saline water in the overlying Dakota Formation.
Previous page--Ground-Water Flow Patterns ||
Next page--Local Effects of Well Pumping
Start of this report ||
Table of Contents