Gamma Ray Colorlith Cross Section
Description


|
Gamma Ray Colorlith Cross Section |
 |
| Main Page | Description | Applet | Download | Help | Copyright & Disclaimer | |
Work is partially supported by the U.S. Department of Energy (DOE) National Energy Technology Laboratory (NETL) under Grant Number DE-FE0002056.
"Correlation of petroleum reservoirs is a fundamental task in reservoir characterization used to establish the geometry of the reservoir and strata surrounding it and to delimit the distribution of flow units that comprise the reservoir. Correlations are primarily accomplished via construction of cross sections through the reservoir using wireline logs where depth patterns, trends, and surfaces define probable continuity within the reservoir between well locations. The correlations are validated through analyses of fluids recovered, flow tests, and possibly seismic surveys, in the later case if the reservoir is sufficiently thick to be seismically resolvable. Cross sections display the log curves at various scales and, to be effective, should show formation and reservoir tops, correlation surfaces, intervals of tests, perforations for production, and intervals that are considered flow units that are correlatable and connected between wells." GEMINI Project
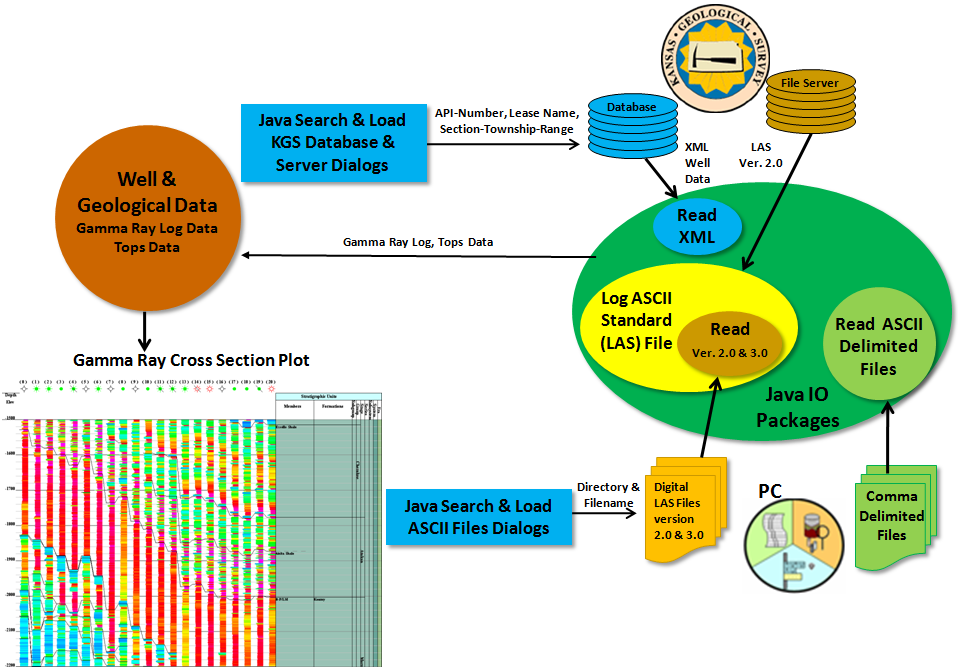
The Gamma Ray Colorlith Cross Section was created to investigate the subsurface geology by visual means. Many geologist use the gamma ray log to pick stratigraphic units (tops), which this web app exploits. The user can select between a gray scale or a reverse rainbow color schema to display the colorlith. Colorlith was first represented by David Collins in a report for the USGS(1) to represent the process of converting log data into Red-Green-Blue (RGB) Color combinations. In the USGS Report, Collins displayed a Gamma Ray Colorlith of wells along Township 16S, from Range 43W in northwest Greeley County to Range 26W in northern Ness County, Kansas in a Gray Scale. This presentation gave a very nice look at the subsurface geology over the region, where the clean formations were light gray and shales a dark gray, one could visualize the rock layers.
This web app starts with the Cross Section app and restricts the data only to gamma ray log curves and tops. This reduced the memory needed to display multiple wells. The Cross Section Web app is restricted to 4 wells or regions only because of the memory size of the well data that is displayed. This program is presently restricted to 100 wells, which is large enough to paint a picture of the subsurface. This program reads a Log ASCII Standard (LAS) version 2.0 or 3.0 file for each well considered. The user can display a map of the wells to verify ordering an save the basic information needed to reproduce the Gamma Ray Colorlith Cross Section in a Extensible Markup Language (XML). The XML file saves the location of the LAS File for each well as well as the Well Header Information and the Tops. The user can edit the tops in this web app to correct any issues and when saved to the XML, will reproduce your changes.
The Gamma Ray Color Scale is divided over the following API and Color range as follows
Color Scale
Gray Scale
Example: Gamma Ray Colorlith Cross Section XML - wells along Township 16S, from Range 41W in northwest Greeley County to Range 26W in northern Ness County, Kansas. The tops for each well are from the source "Stratigraphic.Mcfarland". Download this file to your pc and import it into this web app as an example of a cross section. This is the same region done by David R. Collins in the USGS Report(1).

Reference:
(1) Visualization of Subsurface Geology from Wireline Logs
By David R. Collins
USGS
Digital Mapping Techniques '98 -- Workshop Proceedings
U.S. Geological Survey Open-File Report 98-487
Author: John R. Victorine jvictor@kgs.ku.edu

