
Brine Plot and Data Entry
Description
|
|
Brine Plot and Data Entry |
|
| Main Page | Description | Applet | Download | Help | Copyright & Disclaimer | |
Work is partially supported by the U.S. Department of Energy (DOE) National Energy Technology Laboratory (NETL) under Grant Number DE-FE0002056.
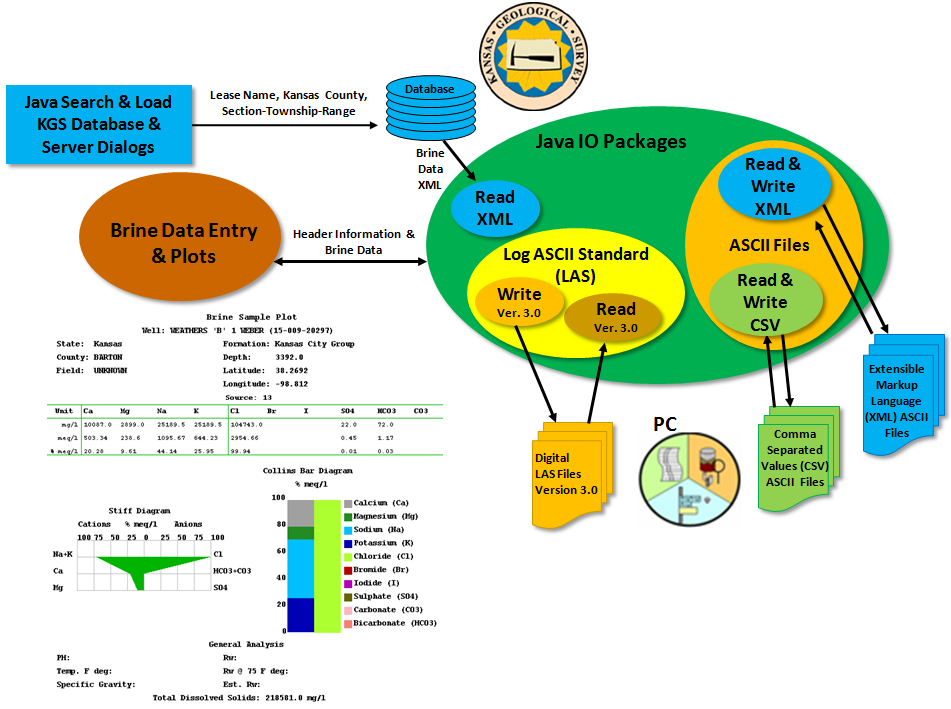
The Brine Plot & Data Entry Web Application was created to provide a means to manually insert the brine data or to import brine data from the Kansas Geological Survey Database or to import/export brine data from/to ASCII Files, i.e., Log ASCII Standard (LAS) version 3.0, Comma Separated Values (CSV) and Extensible Markup Language (XML) Files. The web application also provides a number standard brine plots to present the most common Anions and Cations as a Piper Diagram and Brine Sample Plot, which displays a Stiff and Collins Bar Diagrams.
Stiff Diagram: The Stiff diagram is a graphical representation of brine fluid, first developed by H.A.Stiff in 1951. It is usually plotted without the labeled axis and is useful making visual comparison of waters with different characteristics. The patterns tend to maintain its shape upon concentration or dilution.
Collins Bar Diagram: Collins diagrams (Collins 1923) present the relative major ion composition in percent milliequivalent per liter. Both the cations and anions have a total of 100 %. The bar diagram used in the Brine Sample Plot, the cations are plotted on the left and the anions are plotted on the right.
Piper Diagram: The Piper diagram plots the major ions as percentages of milli-equivalents in two base triangles. The total cations and the total anions are set equal to 100% and the data points in the two triangles are projected onto an adjacent grid. This plot reveals useful properties and relationships for large sample groups. The main purpose of the Piper diagram is to show clustering of data points to indicate samples that have similar compositions.
Concentration Plot: Box and whiskers plot showing the distributions of the measured concentrations. Boxes extend from the 25th to the 75th percentile, horizontal bars inside the boxes represent the median and the mean, vertical line to the 5th and 95th percentile and the maximum and minimum observations presented as crosses.
This web application will take advantage of over 13 years of Java development experience at the Kansas Geological Survey (KGS) in developing web applications that plot oil & gas data and allows the geologist to perform analysis with that data, i.e. GEMINI Project & Tools on the KGS Web Site.
GEMINI (Geo-Engineering Modeling through INternet Informatics) Project was developed to allow the geologist to seamlessly integrate databases and geological analytical tools across the web. Analytical tools were designed for the independent oil and gas operators, consultants, and widely separated team members within and outside companies.
Reference:
Stiff, H.A., Jr., 1951, The interpretation of chemical water analysis by means of patterns:
Journal of Petroleum Technology, v. 3. no. 10, p. 15-17.
COLLINS, W.D. (1923): Graphic presentation of water analysis. Ind. Eng. Chem., 15: 394 p.
Piper, Arthur M.: A graphic procedure in the geochemical interpretation of water-analyses,
Transactions, American Geophysical Union, Volume 25, Issue 6, p. 914-928
Author: John R. Victorine jvictor@kgs.ku.edu
The URL for this page is http://www.kgs.ku.edu/stratigraphic/BRINE/description.html