
Pickett and Hingle Plots
Description
(Determination of Archie Parameters from Porosity - Resistivity Cross Plots)

|
|
Pickett and Hingle Plots |
|
| Main Page | Description | Applet | Download | Help | Copyright & Disclaimer | |
Work is partially supported by the U.S. Department of Energy (DOE) National Energy Technology Laboratory (NETL) under Grant Number DE-FE0002056.
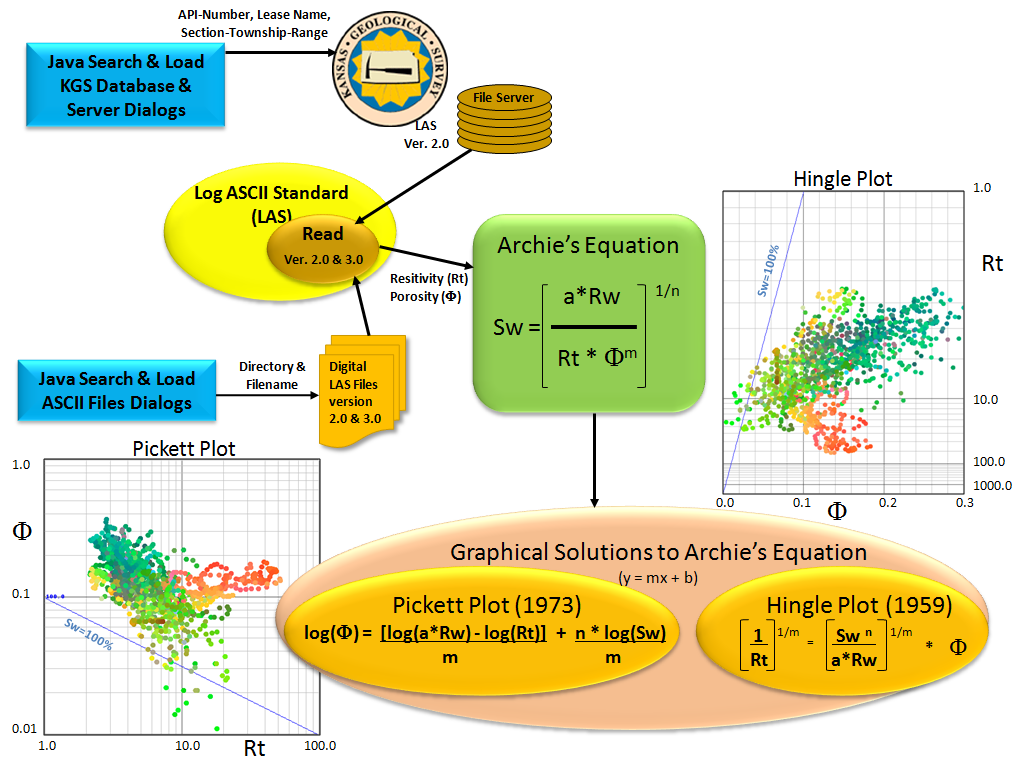
This web application was created to allow the user the ability to determine the Archie parameters though graphical means. The Hingle (1959) & Pickett (1973) Plots developed graphical solutions to Archie's equation, i.e., Water Saturation (Sw), Formation Water Resistivity (Rw), Archie Cementation factor (M), Archie Saturation Exponent (N) from the log data without numerical calculations.
Pickett & Hingle Plots allows the user to add Water Saturation (Sw) Lines to the plot. Pickett Plot also allows the user to include Bulk Volume Water (Bvw) and Permeability (K) Lines.
The web application was designed to help the user to create a best fit for the 100% Water Saturation Line by varying the product of Archie constant, Formation Water Resistivity (a*Rw) and varying the Archie Cementation factor (M).
Hingle Plot:
The y-axis is built from (1/Rt) 1/m but scaled in resistivity or conductivity. This allowed the user to plot data directly to the plot. As m varies so does the grid lines and plotted log data. In the past Hingle Plots were plotted with a fixed grid lines as 1/M = 1/2, but with computers the axis can easily be changed to fit the data more clearly. The porosity (Φ) is plotted as a linear scale on the x-axis.
Pickett Plot:
A graphical solution to Archie's equation by plotting logarithmic scales of resistivity (Rt) versus porosity (Φ), which will allow linear representation of the data as y = m*x + b.
log(Φ) = (-1/M)*log(Rt) + log(a*Rw)/M - N*log(Sw)/M
where log(Φ) is the y-axis and log(Rt) is the x-axis.
log(a*Rw) is the y-intercept and (N*log(Sw)/M) is a family of lines.
This web application will take advantage of over 13 years of Java development experience at the Kansas Geological Survey (KGS) in developing web applications that plot oil & gas data and allows the geologist to perform analysis with that data, i.e. GEMINI Project & Tools on the KGS Web Site.
GEMINI (Geo-Engineering Modeling through INternet Informatics) Project was developed to allow the geologist to seamlessly integrate databases and geological analytical tools across the web. Analytical tools were designed for the independent oil and gas operators, consultants, and widely separated team members within and outside companies.
Reference:
1959, Hingle, A.T., The use of logs in exploration problems : SEG 29th Annual Meeting.
1973, Pickett, G.R., Pattern Recognition as a Means of Formation Evaluation, The Log Analyst, Vol, 14, no. 4 pgs 3-11
http://www.onepetro.org/mslib/servlet/onepetropreview?id=SPWLA-1973-A
Author: John R. Victorine jvictor@kgs.ku.edu
The URL for this page is http://www.kgs.ku.edu/software/Pf/description.html