Winter 1999
Vol. 5.1
| |
||
| Kansas Geological Survey | Winter 1999 |
Vol. 5.1 |
|
Mapping Sends Survey Geologists to the Field
CONTENTS Geologic Mapping–page 1
|
Looking
out on the Kansas countryside, most people notice the colorful grasses,
weathered barns, hawks perched on fenceposts, whatever catches their eye
and interest. Geologists, however, look at the landscape differently.
Instead of focusing on what’s visible at the surface, they often
try to visualize what lies beneath it. “I want to know what kind of cake is under all that frosting,”
said Jim McCauley, Kansas Geological Survey geologist, referring to the
bedrock or solid rock that lies underneath the soil. He said he’s
always looking for clues about the bedrock. Sometimes the clues are in
plain view, as in rocks laid bare by a roadcut. Often they’re more
subtle—the slight bump on a gravel road that signals exposed bedrock,
the color and thickness of the soil. Taken together, these clues provide
a picture of the mostly hidden bedrock. McCauley is part of the Survey’s geologic mapping program, which
produces maps of bedrock in the state’s counties. Because geologic
maps show the rock formations likely to be encountered in a given location,
they are useful in construction, in understanding soils and agriculture,
in searching for water and mineral deposits, and in a variety of engineering
and environmental applications. Although most Kansas counties have modern geologic maps, a handful are
being mapped for the first time. Since 1991, the Survey has released new
geologic maps for Finney, Phillips, Butler, Riley, Chautauqua, Russell,
Montgomery, Ness, Stafford, and Elk counties. McCauley recently finished
mapping Leavenworth County and is currently at work on maps of Wyandotte
and Comanche counties. Mapping a county’s bedrock, most of which is covered by soil and
vegetation, involves both painstaking sleuthing and a thorough knowledge
of the local stratigraphy, the sequence of rock layers found in a given
area. Some information about a county’s geology can be gleaned from
published materials—old maps, aerial photographs, soil surveys.
But, said McCauley, “there’s no substitute for getting out
in the field.” Though technology has changed how some geological research is conducted,
McCauley’s approach to mapping is essentially low tech. Generally
he works his way across the county stratigraphically, starting with the
uppermost (and youngest) rock unit and tracing it throughout the county
before going on to the next unit. “This way I get really familiar
with the characteristics of the unit,” he said. Generally, unit
boundaries represent a change from one rock type to another—for
example, from a shale to a limestone. Out in the field he tries to locate
as many of these boundaries as possible. Armed with a stack of U.S. Geological Survey topographic maps (from 15
to 30 depending on the county’s size), a hand level, and a small
vial of dilute hydrochloric acid (if it fizzes, it’s limestone),
McCauley drives the county roads, scanning the landscape for clues about
the underlying rocks. “I always keep an eye on the ditches,”
McCauley said. Because ditches are constantly being eroded, they are a
good place to look for exposed rock, as are streambeds and gullies. He
also scans hillsides, looking for breaks in the slope, which signal a
change in the underground rock. Vegetation can also provide clues about
the bedrock: oaks, for example, tend to grow in soils formed from sandstones.
Manmade exposures such as roadcuts and quarries are good places to examine
the bedrock in detail. In urban areas, construction sites can be an important
source of information about the bedrock in a largely altered landscape.
“You take whatever markers you can find,” McCauley said. Once a rock unit has been identified, its location is pinpointed on the
topographic map, along with its elevation. Each of these locations becomes
a data point for the rock unit that’s being mapped. Eventually these
points are connected with a line that represents the contact between rock
units (which show up on the final geologic map as different colored areas).
Because outcrops may be scarce, geologists must fall back on their experience
and knowledge (for example, that rock units in Kansas generally dip gently
to the west) to fill in the blanks. This has led critics to claim that geologic mapping is more art than science. McCauley admitted that, in the absence of good exposures, geologists are often forced to make inferences. “But these inferences are preceded by a lifetime of observation and study of our subject and are based on the recognition and interpretation of the form, pattern, and structure that we see in our subject.” With that in mind, he’s willing to stand by the maps. “Plus,” he said, “they make great wall hangings.” |
|
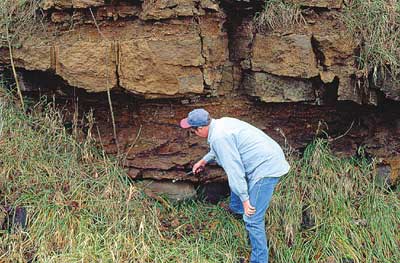
At this Leavenworth County roadcut, Survey geologist
Jim McCauley points out the contact between the Stranger Formation and
the Stanton Limestone. |
 |
| Online February 10, 2003 Comments to: lbrosius@kgs.ku.edu Kansas Geological Survey URL:http://www.kgs.ku.edu/Publications/GeoRecord/1999/vol5.1/Page1.html |