| Original published in W.W. Hambleton, ed., 1959, Symposium on Geophysics in Kansas: Kansas Geological Survey, Bulletin 137, pp. 63-103 | ||
Department of Geology, University of Wisconsin
The complete article is available as an Acrobat PDF file, with plates available separately.
An analysis of gravity anomaly variations in Kansas is .presented in terms of known geologic features such as the thickness and nature of the sedimentary rocks, the configuration and composition of the crystalline basement rock complex, probable but as yet unknown lithologic variations within the basement complex as suggested by magnetic studies as well as gravity measurements, and probable variation in crustal thickness and composition. Because the basal portion of the stratigraphic column in Kansas consists chiefly of limestone whose density equals or exceeds that of the average crystalline basement rock material, the configuration of the basement rocks is for the most part effectively masked. Where there are apparent correlations with basement structure, as over the Central Kansas Uplift and part of the Nemaha Anticline, the gravity effect must be attributed to probable mafic rocks at depth, most of which do not reach the surface of the crystalline rock floor. The mean density of the geologic column down to the -3000-ft. level (lowest sediments) shows a progressive decrease from about 2.67 gm/cc to 2.54 gm/cc from east to west across the state, and this decrease seems to correlate with the regional east-west gravity anomaly gradient of about 65 mgal, but the geologic effect actually computes to be only about 6 mgal, The isostatic effect, on the other hand, for the change in elevation of about 3000 ft. demands a regional gravity change of about 90 mgal, As the net observed change after correcting for the surface geology is only about 59 mgal, the change in crustal thickness seems to be considerably less than that implied by isostatic theory. This is substantiated by average negative isostatic anomalies of about 20 mgal over the eastern part of the state. Residual gravity anomalies as well as the magnetic anomaly pattern suggest a crystalline basement mosaic embodying about twenty major and numerous minor areas of abnormality. Most of these are not known from more than 1600 wells penetrating to basement, which suggest a much more nearly homogeneous basement although rocks ranging in composition from acidic to basic, as well as schists, gneisses, and quartzites, are present.
The first published investigation of the relation of gravity anomalies to geology in Kansas was by Woollard (1943) in connection with transcontinental gravity and magnetic measurements. This study consisted of a single traverse across northern Kansas along a line running through Kansas City, Missouri, and Hill City, Kansas. The results obtained showed: (1) a systematic east-west increase in negative Bouguer anomalies amounting to about 100 mgal; (2) a strong local gravity anomaly (50 mgal) in the vicinity of Clay Center not related to any known basement feature; (3) weak anomaly values (5 mgal) over the Cambridge Arch extension of the Central Kansas Uplift; and (4) little or no expression (less than 1 mgal) of the pronounced basement uplift represented by the Nemaha Anticline.
The question naturally arose as to how representative were the measurements. A review of anomaly values for pendulum gravity stations established in other parts of Kansas by the U. S. Coast and Geodetic Survey suggested that the regional negative Bouguer gravity anomaly gradient from east to west was a representative condition, but it was not possible to extend the study further without a considerable number of auxiliary gravity measurements. Through the cooperation of Mr. Hart Brown, who has carried out many regional gravity surveys both on an independent and contractual basis, Ohio Oil Co., Shell Oil Co., Sun-Ray Oil Co., The Texas Co., the U. S. Coast and Geodetic Survey, and the Kansas Geological Survey, it has now been possible to assemble raw data for about 3000 gravity stations covering most of the state and gravity anomaly maps for which original data are not available covering much of the remaining area. This material has been adjusted as nearly as possible to a common datum (the international Potsdam datum) and reduced to yield simple Bouguer anomalies by use of the international gravity formula for the determination of the theoretical sea level value of gravity at the observation site, a value of -0.09406 mgal/ft for the vertical gradient in correcting for the elevation of the observation site, and a density of 2.67 gm/cc in computing the effect of the included rock column above sea level.
As various gravity meters having various calibration standards had been used in making the measurements, it was necessary to evaluate not only the datum shift in the original measurements but also to adjust individual surveys to the same calibration standard. Ideally this procedure would be based on measurements with the Gulf quartz pendulum apparatus (Woollard, Harding, and Rose, 1955); however, it was not possible to make adjustment because (a) there were no funds for making field measurements, and (b) descriptions of main bases for exact reoccupation could not be obtained for most of the work. As a second-best adjustment technique, the Bouguer anomaly values in the vicinity of the U. S. Coast and Geodetic Survey pendulum gravity sites, Woollard's (1958) airport gravity base stations, and the transcontinental survey observation points (Woollard, 1943) were compared and adjustment determined on the basis of the difference in anomaly value. How accurate the resulting adjusted values are on the international scale can only be surmised through comparison of values for the same area covered by different surveys. On this basis, accuracy is better than 1 mgal in many areas but as poor as 5 mgal in other areas. Discrepancies as large as 5 mgal probably are not related to observed gravity values, but are due to differences in reduction constants used in deriving the anomalies. For example, it has not been possible to determine the density value or values used in obtaining the anomalies on a single survey; thus the accuracy is not all that can be desired.
Despite the above limitation, the results are believed to be adequate for regional geologic interpretations involving principally changes in basement lithology as indicated by local anomalies ranging from 5 to 20 (or more) milligals. Gravity variations related to changes in basement configuration are not likely to be significant in Kansas because, as will be explained in more detail later, there is no significant contrast in the density of the average basement rock and the enclosing sedimentary rocks. Even on a structure as pronounced as the Nemaha Anticline, which has an average over-all relief of 1200 ft., the gravity effect to be expected is considerably less than 1 mgal, and this small relief may well vary in sign over the structure depending upon the density of the rocks locally constituting the crystalline complex.
In Plate 1 the Bouguer gravity anomalies have been contoured on a 5-mgal contour interval. The distribution of gravity stations on which this map is based also is shown. Although it is believed that the contours approach 1 mgal in accuracy, there are reasons, as stated earlier, to question even a 2-mgal accuracy in the southwest quarter of the state. The significant features brought out by the map are:
These features agree in gross form with those depicted on a regional gravity map of the United States published in 1950 by Paul Lyons, but, as seen in Figure 1, there is considerable difference in local pattern and also in magnitude of the regional change depicted. These differences presumably are related to differences in the amount of data available and differences in methods of adjustment used. One feature brought out by Lyons' map, however, is verification of the fact that the pronounced positive anomaly observed in northern Kansas does terminate southward in Kansas but continues northward across Nebraska into Iowa. In point of fact, it has been mapped as a more or less continuous feature all the way into Lake Superior, where it seems to terminate. (Black, 1954; Thiel, 1956).
Figure 1--Map showing Bouguer gravity anomalies in Kansas and surrounding states, contour interval 20 mgal. (After Lyons, 1950).
As the anomalies represent composite effects derived from (a) the mass distribution associated with the thickness and composition of the earth's crust, (b) changes in basement and intrabasement lithology, (c) the configuration and depth of the basement surface, and (d) the thickness and character of the sedimentary section, some method must be used for resolving the anomalies into component parts.
The first step is the isolation of the deep-seated contribution related to the crust. This can be done in several ways, an obvious one being based on isostatic theory. So long as isostasy is a real phenomenon, it makes little difference whether the concept of a floating crust or a crust of varying density but constant mass is used. If isostasy does not prevail throughout an area, then the derived isostatic anomalies will have only limited geologic value. The anomaly pattern might indicate accurately the geologic structural grain and the areal extent of anomalous bodies, but the values would have little or no significance for determining depth or kind of rocks present.
The regional effect may be removed empirically by subtracting smoothed contours from an original isoanomaly map, through the use of profiles, or by more sophisticated methods involving the mathematical determination of regional values or by the construction of derivative maps. In all methods the significance of the residual values is limited by the accuracy of the original data.
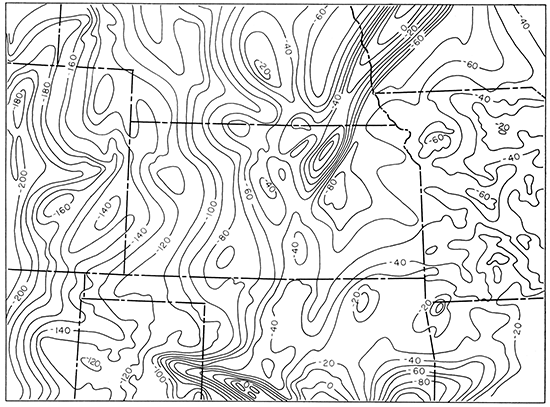
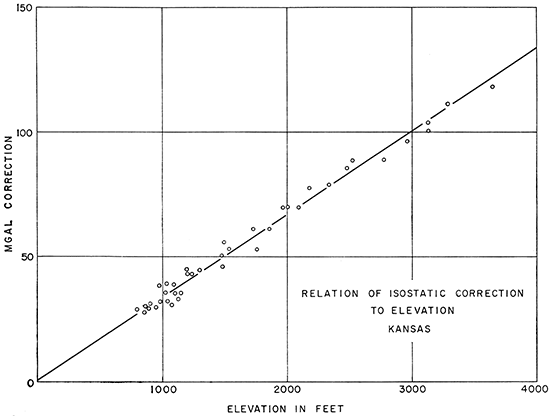
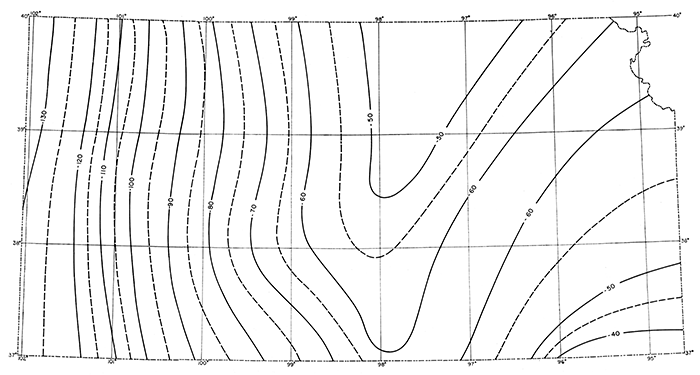
Isostatically reduced data for 29 gravity stations established by the U. S. Coast and Geodetic Survey (Duerksen, 1949) in and adjacent to Kansas were reviewed along with material for seven unpublished stations and nine other stations in Kansas established by the writer but reduced isostatically by the U. S. Coast and Geodetic Survey (Table 1). It is apparent that the isostatic field in Kansas is drastically disturbed inasmuch as the isostatic anomaly values range from +51 mgal to -35 mgal, According to one school of thought, this variation would be attributed entirely to mass variations associated with the near-surface geology; in some areas such a relationship does seem to hold. But the possibility that the mass distribution causing the isostatic anomaly is associated with the underlying crust cannot be ignored. Recent seismic refraction studies of crustal structure in selected areas of pronounced gravity anomalies (Steinhart, Meyer, and Woollard, 1958) have shown that the crust is far from uniform in either thickness or composition and does not conform to any simple model as visualized under the various concepts of isostasy. To examine this phase of the problem in greater detail, a map based on the isostatic correction for the stations listed in Table 1 was prepared to show what the regional change in Bouguer anomaly values should be, according to isostatic theory, for the east-west increase in elevation of nearly 3000 feet. This map (Fig. 2) also includes 1000-ft. elevation contours, and it is seen that the isostatic correction does follow faithfully the elevation contour pattern on a regional basis. In addition, agreement with elevation is linear (Fig. 3), and on a regional basis in Kansas it would be safe to assume an isostatic correction based on the equation y=mx+b where the slope (m) is 33.2 mgal per 1000 ft. change in elevation, x=the elevation above sea level, and b=O. A reasonable correction for regional isostatic compensation good to about 4 mgal also could be obtained by the simple process of subtracting contours as shown in Figure 2 from those for a Bouguer anomaly map plotted on the same scale.
Table 1--Isostatic stations in Kansas and adjacent area.
| Position | Elev., ft. |
Obs. g Wash. (980-1180) |
Anomaly | ||
|---|---|---|---|---|---|
| Bouguer | Isostatic | ||||
| Kansas: U.S.C.& G.S. Station | |||||
| Boyle (1149) | 39-20.0N 95-19.8W |
1128 | 979.986 | -68 | -35 |
| Bullard (456) | 37-52.5N 100-52.5W |
2958 | .707 | -106 | -10 |
| Burlington (1148) | 38-11.1N 95-44.1W |
1017 | .902 | -58 | -23 |
| Carbondale (1151) | 38-46.9N 95-45.5W |
1103 | .946 | -61 | -26 |
| Doyle (298) | 39-12.4N 96-05.4W |
965 | .990 | -63 | -25 |
| Ellsworth (40) | 38-44.2N 98-14.1W |
1539 | .926 | -45 | +8 |
| Kan. State Col. (420) | 38-51.0N 99-20.0W |
1995 | .883 | -75 | -5 |
| Lawrence (1130) | 38-57.4N 95-14.6W |
1032 | .972 | -54 | -22 |
| Mound (1145) | 38-08.7N 94-46.0W |
881 | .904 | -60 | -30 |
| Neodesha (1147) | 37-25.7N 95-35.0W |
891 | .855 | -46 | -15 |
| Newton (1152) | 38-04.5N 97-18.0W |
1496 | .864 | -59 | -13 |
| Norton (1154) | 39-50.4N 99-53.1W |
2321 | .962 | -66 | +13 |
| Olathe (1153) | 38-51.4N 94-51.5W |
1088 | .963 | -51 | -20 |
| Pittsburg (1146) | 37-28.2N 94-42.0W |
937 | .854 | -48 | -18 |
| Pratt (1150) | 37-38.9N 98-41.5W |
1845 | .793 | -71 | -10 |
| Seneca (974) | 39-51.7N 96-03.1W |
1086 | 980.051 | -53 | -14 |
| Wallace (41) | 38-54.7N 101-35.4W |
3295 | 979.758 | -128 | -16 |
| Wellington (976) | 37-16.6N 97-23.6W |
1232 | .826 | -42 | +1 |
| Wilkins (296) | 39-04.3N 97-02.9W |
1188 | .962 | -66 | -22 |
| Zeandale (975) | 39-09.7N 96-25.5W |
1008 | .980 | -66 | -27 |
| Beloit (1195) | 39-27.3N 98-06.2W |
1382 | .997 | -53 | +1 |
| Meade (1193) | 37-17.0N 100-19.6W |
2430 | .704 | -93 | -9 |
| Larned (1190) | 38-11.2N 99-06.2W |
2044 | .847 | -52 | +16 |
| Dodge (1192) | 37-46.5N 100-00.8W |
2602 | .746 | -83 | -3 |
| Shields (1191) | 38-33.5N 100-27.9W |
2787 | .788 | -99 | -9 |
| Coldwater (1194) | 37-16.5N 99-19.1W |
2141 | .732 | -81 | -13 |
| Meade's Ranch (1189) | 39-13.4N 98-32.5W |
1966 | .936 | -58 | +1 |
| Kansas: Woollard Station | |||||
| B342 | 39-23.9N 101-04.2W |
3138 | 979.814 | -126 | -25 |
| B353 | 39-21.9N 99-49.2W |
2172 | .912 | -83 | -5 |
| B364 | 39-30.7N 98-34.8W |
1497 | .991 | -57 | +3 |
| B373 | 39-22.0N 97-40.1W |
1484 | 980.004 | -32 | +19 |
| B378 | 39-22.8N 97-10.6W |
1197 | 980.060 | +6 | +51 |
| B382 | 39-18.2N 96-50.0W |
1279 | 979.962 | -81 | -37 |
| B396 | 39-04.2N 95-39.6W |
875 | .992 | -54 | -19 |
| B406 | 38-58.6N 94-55.4W |
790 | .992 | -51 | -22 |
| Colorado: U.S.C.& G.S. Station | |||||
| Springfield (1171) | 37-23.1N 102-36.5W |
4415 | .539 | -148 | -11 |
| Laird (455) | 40-02.7N 102-03.7W |
3640 | .845 | -118 | 0.0 |
| Colorado: Woollard Station | |||||
| B333 | 39-18.2N 102-17.5W |
4180 | .811 | -158 | -28 |
| Nebraska: U.S.C.& G.S. Station | |||||
| Red Cloud (1155) | 40-05.5N 98-30.8W |
1709 | 980.022 | -65 | -3 |
| Missouri: U.S.C.& G.S. Station | |||||
| Kansas City (39) | 39-05.8N 94-35.4W |
915 | 979.993 | -53 | -23 |
| Joplin (140) | 37-05.4N 94-30.8W |
995 | .844 | -22 | +10 |
| Oklahoma: U.S.C.& G.S. Station | |||||
| Fairland (1144) | 36-45.7N 94-49.6W |
852 | .819 | -27 | +3 |
| Nowata (1138) | 36-43.2N 95-45.3W |
831 | .810 | -33 | -5 |
| Burbank (1143) | 36-42.2N 96-41.0W |
1132 | .788 | -36 | -1 |
| Guymon (100) | 36-40.7N 101-28.7W |
3120 | .574 | -130 | -26 |
Figure 2--Map showing theoretical regional Bouguer anomaly values based on isostatic corrections for stations in Table 1, and elevation change. Bouguer anomaly contour interval = 2 mgal; elevation contour interval = 1000 ft.
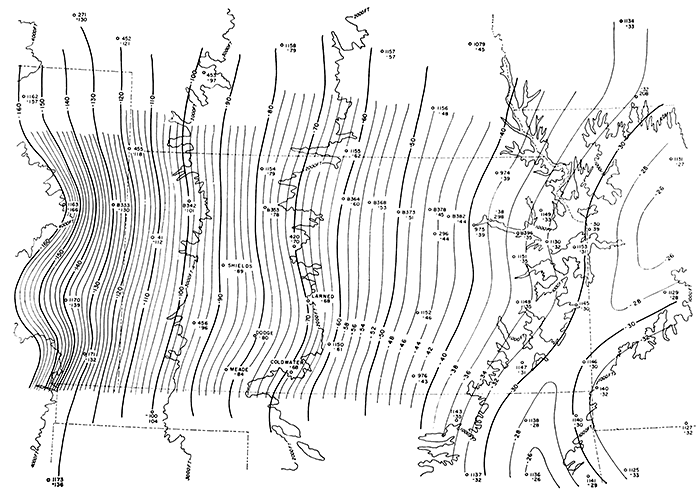
Figure 3--Graph showing relation of isostatic correction to elevation.
The problem here is not so much the determination of isostatic anomalies as deciding whether the source of the large isostatic anomalies is related to deep-seated or near-surface geologic causes.
Fortunately, the subsurface geology of Kansas is fairly well known, as at least 1600 wells extend to the basement rock complex. Using these data, Farquhar (1957) prepared a map of the basement surface and also described the lithology of the basement rocks and their relation to basement surface relief. He describes granite and quartzite as the two chief varieties of basement rock logged in oil wells and describes general relations as follows: "The Precambrian rocks of Kansas include a metamorphic group composed of quartzite, granulite, schist, phyllite, and gneiss (some granitic). This group has been intruded by a suite of igneous rocks consisting not only of granite, but also of some darker magmatic rocks. The intrusive granite is of batholithic dimensions…" These granites form the dominant rock type composing the basement rock complex. Gabbro is known from only two localities, one in Barton County and the other in Rice County. Peridotite is reported in both Woodson and Riley Counties, and diabase in Clay and Chase Counties. Hornblendite is mentioned as occurring in Marion and Marshall Counties.
In discussing the basement relief, Farquhar mentions that on the Central Kansas Uplift, quartzite is the rock type associated with most points of high relief. This relation also seems to obtain in Wisconsin (Thwaites, 1940; Sumner, 1955).
The geology of the overlying stratigraphic section is even better known than that of the basement and has been very well summarized by Ver Wiebe (1952). From the standpoint of mass variations it is seen that the section is composed predominantly of carbonate rocks over the eastern part of the state but there is a regional transition westward to an area where the section is composed of roughly equal amounts of carbonate rocks and fine-grained clastics. This distribution should result in a regional east to west decrease in mass attraction that should further augment the decrease due to isostatic compensation for the regional increase in elevation in the same direction. In order to determine the order of magnitude of this effect, the geologic cross section of Kansas prepared by Kellett (1932) was modified to agree with an east-west section and with Farquhar's basement map and was extended to the Colorado border. The mean density of the geologic column was computed along this section to the -3000-ft. level at intervals of about 60 miles across the state. The -3000-ft. level was chosen as a base because it included the deepest basement depression crossed. Although the writer has no actual density values for samples taken in the area, on the basis of determinations on rocks of the same character, age, and geologic history in other areas and on the basis of measurements by others, the following values seem to be applicable:
| Tertiary shales | 2.2 gm/cc | |
| Mesozoic shales | 2.4 gm/cc | |
| Mesozoic limestones | 2.6 gm/cc | |
| Mesozoic sandstones | 2.5 gm/cc | |
| Paleozoic limestones | 2.7-2.8 gm/cc | |
| Paleozoic shales | 2.5 gm/cc | |
| Paleozoic sandstones | 2.5 gm/cc | |
| Precambrian | ||
| granite | 2.67 gm/cc | |
| quartzite | 2.65 gm/cc | |
| other metamorphics | 2.7-2.8 gm/cc | |
| gabbro | 2.9 gm/cc | |
As a mean density of 2.67 had been used in the Bouguer reductions, any significant departures in the mean density of the geologic column should be reflected in the anomaly values. As shown in Figure 4 the mean density of the geologic column ranges from a low of 2.54 gm/cc at the Colorado border to about 2.67 over the Nemaha Anticline and is 2.64 at the Missouri border. The difference between these values and the standard density of 2.67 gm/cc used in the reductions indicates a regional change of -6.3 mgal west of the Nemaha Anticline and about -0.4 mgal east of the Nemaha Anticline. In other words, the actual Bouguer anomaly regional pattern should differ systematically in an east-west direction from the theoretical pattern shown in Figure 2 by about 6 mgal if the mass variations due to regional changes in near-surface geology are allowed for. Profiles were plotted (Fig. 5) for four traverses across the state, and a smoothed regional anomaly map (Fig. 6) based on Plate 1 was drawn for comparison with Figure 2. As is seen in Figure 5, the actual Bouguer anomaly values are very close to the theoretical values dictated by isostatic theory in the western part of the state but depart progressively from theoretical values eastward. The observed change is about 25 mgal less than the theoretical change. That the situation is not a fortuitous coincidence along these profiles is indicated by the smoothed regional anomaly pattern (Fig. 6) that was derived from the actual Bouguer anomaly map (Pl. 1). Not only is the actual regional change about 25 mgal less than the theoretical change but also it is opposite in sign from that to be expected because of the change in mass distribution associated with the near-surface geology. Correcting for the effect of the near-surface geology results in a net regional change of about 59 mgal, and it is this change that seems to be related to change in crustal composition and thickness.
Figure 4--Cross section showing lithology and density; profiles showing change in mean density, regional isostatic change, observed regional gravity change, and observed regional gravity change corrected for surficial geology.
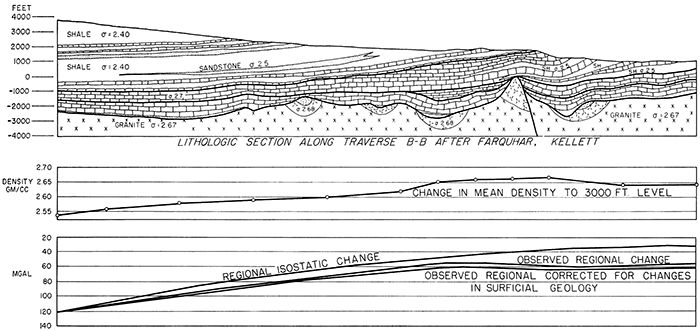
Figure 5--East-west profiles showing surface elevation, basement surface elevation, and isostatic correction and Bouguer gravity anomaly values.
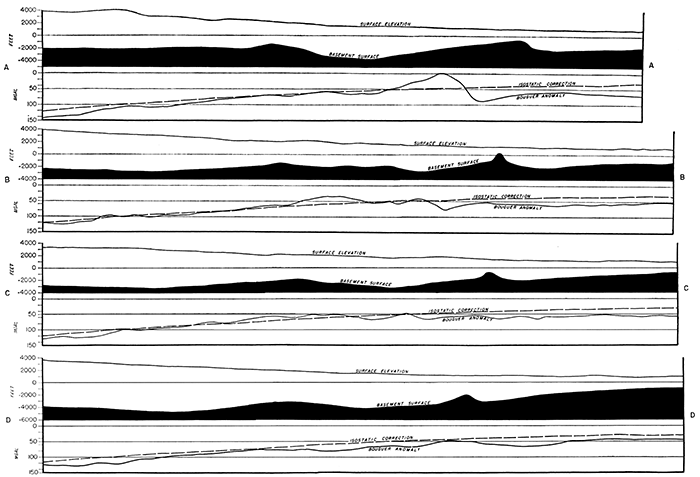
Figure 6--Map showing smoothed regional Bouguer anomaly pattern, contour interval 5 mgal.
Although there are no seismic refraction measurements of crustal+structure and composition in Kansas, there have been some estimates by Press and Ewing (1957) based upon phase velocity dispersion of earthquake surface waves. These estimates indicate that the base of the crust in the midcontinent area changes in elevation from about -36 km at 950 west longitude to about -40 km at 1020 west longitude. The net anomaly change of 59 mgal across the state and the estimated change of 4 km in crustal thickness indicate a density differential of 0.35 gm/cc between the crust and underlying mantle rocks. If a density of 3.27 gm/cc is assumed for the mantle rock, the indicated density for the crust is about 2.92 gm/cc. On the assumption of a crust having a mean density of about 2.84 gm/cc overlying mantle rocks of about 3.27 gm/cc as postulated by Worzel and Shurbet (1955), this change in thickness should result in a regional gravity gradient of about 75 mgal across the state. This value is about midway between the observed regional change corrected for surface geology (59 mgal) and the theoretical isostatic change of 90 mgal.
The implication of the above taken in conjunction with the negative isostatic anomalies in the eastern part of the state is that the crust is thicker than normal and characterized by a layered structure involving both granitic and gabbroic material. The proof of this conclusion cannot be demonstrated at this time, but perhaps it is significant that refraction seismic measurement carried out by the University of Wisconsin in Arkansas during 1958 showed the crust to be abnormally thick (43 km) and to be composed of material having a velocity of about 6.9 km/sec., and that in order to satisfy the gravity anomaly values a mean density of about 3.03 gm/cc would have to be postulated.
Up to this point the significance of regional gravity variations has been examined. In order to study the effects related to surficial geology, the regional effect first must be removed. This was done by subtracting contours of the smoothed regional field shown in Figure 6 from the observed field shown in Plate 1. The resulting residuals were contoured and are shown in Plate 2 superimposed upon the basement configuration map as drafted by Farquhar. It can be seen at a glance that over most of the state there is little or no correlation between the residual contours and basement configuration, although there seems to be a possible correlation on the southern part of the Nemaha Anticline and in the central part of the state on the Central Kansas Uplift. The regional trend of about 6 mgal attributable to the over-all east-west change in thickness and type of sedimentary rock was previously removed in deriving the regional anomaly map, hence residual anomalies cannot be attributed to that factor and therefore must represent variations attributable to the configuration of the basement and to differences in basement and intra-basement lithology. As is seen in Figure 5, little or no correlation can be expected between the gravity values and changes in basement configuration, because the basement is everywhere topped by enveloping limestones having a density about equal to that of the average basement rock. As most of the high points on the basement surface away from the Nemaha Anticline are composed of resistant quartzite, whose density is less than that of the limestones, any correlation with relief would be inverse. The anomaly further would be small in magnitude because the density differential involved averages only about 0.1 gm/cc. The Nemaha Anticline, which is the most pronounced basement structure in the state, having about 1200 ft. average relief, also is buried in limestone, hence the maximum anomaly to be expected is of the order of only 0.2 mgal and may be of positive or negative sign depending upon the local type of basement rock involved in the uplift. The large residual anomalies of 5 to 50 mgal therefore must be related to changes in basement and intra-basement lithology.
As discussed earlier, Farquhar identifies most of the basement rock as granite, although some areas include metamorphosed sediments and even basic and ultra-basic rocks. On the basis of observations elsewhere by Woollard (1948), Miller (1946), Bean (1953), and Garland (1950), to mention a few, granite intrusives have been found to be characterized by pronounced local negative gravity anomalies. Similarly, areas of mafic rocks have been found to be characterized by pronounced local positive gravity anomalies (Steenland and Woollard, 1952). For the present study, however, the writer is fortunate in having basement information covering most of the state and also some magnetic data to aid in interpreting the gravity measurements. It therefore is not necessary to depend entirely upon analogy and model studies in deducing the geologic situation depicted.
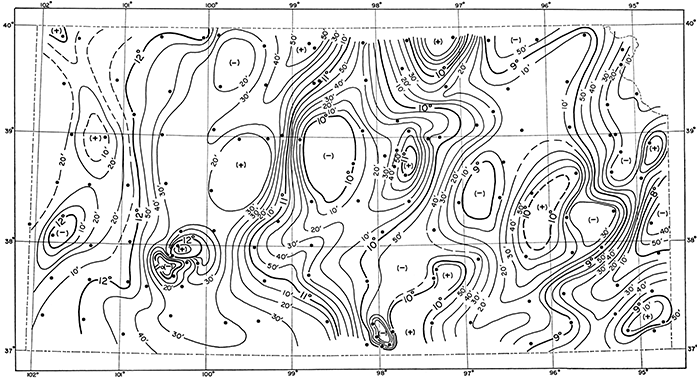
To aid in resolving the gravity anomaly relations, two maps were constructed based on data from the 130 magnetic control stations of the U. S. Coast and Geodetic Survey in Kansas (Howe and Knapp, 1935). As these are distributed in a more or less uniform pattern over the state, nearly all major regional changes in magnetic field strength are detected. Figure 7 is based on the magnetic inclination and Figure 8 is based on the magnetic declination. Two magnetic components were used, inasmuch as the magnetic effects produced in each by a disturbing geologic body do not have the same space distribution, and conceivably an anomalous area related to a change in geology might be missed if only a single component were used, the data being so sparse.
Figure 7--Magnetic iso-inclination map of Kansas. Contour interval 10 minutes.
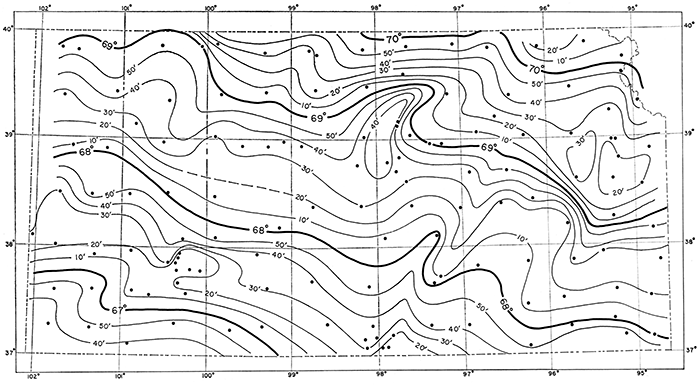
Figure 8--Magnetic iso-declination map of Kansas, east declination. Contour interval 10 minutes.
The magnetic field distortion to be expected for a given geologic situation depends upon the direction of field. In Kansas, a region of east declination, an area west of a disturbing body of greater than normal magnetic susceptibility will show greater than normal declination, and an area east of the body will show less than normal declination. If the body is composed of material having less magnetic susceptibility than the surrounding rock, the relations will be reversed. In either case, paired areas, one plus, the other minus, lie along a line perpendicular to the magnetic meridian and flank the geologic body causing the anomalous condition. Similarly, if inclination measurements are used in the Northern Hemisphere, the effect of a body of greater than normal susceptibility is to reduce locally the inclination over an area south of the disturbing body and increase it on the north side. Because of the north-south regional change in inclination, areas of greater magnetic susceptibility are indicated by spreading of contours on the south side of the body and by northward displacement of contours and development of steep gradients locally on the north side of the body. In the latitude of Kansas the disturbing body will be located about where the steep gradient begins. Areas of low magnetic susceptibility will exert an inverse effect. As the east-west regional change in declination with distance (gradient) is small as compared to the north-south change in inclination, declination anomalies are more obvious than inclination anomalies. If data were abundant a residual inclination anomaly map would be desirable, but data are so sparse that an unmodified map based on the available information is regarded as preferable.
From Figures 7 and 8 it is seen that, as on the gravity residual map, there are numerous anomaly areas that seem to be fairly well defined despite the scanty control. In general the results complement each other and aid in resolving whether the anomalous areas are related to areas of greater or less magnetic susceptibility within the basement rocks. As most areas of high magnetic susceptibility are associated with basic rocks having a high density, and areas of lower than normal susceptibility are associated with granite or quartzitic rocks having a lower than average density for crystalline rocks, the magnetic and gravity measurements give complementary information.
Magnetic effects related to basement configuration can be disregarded, as they will be small as compared to those resulting from difference in basement lithology. The magnetic effect of the relief associated with the Nemaha Anticline is probably no more than 100 gammas, yet magnetic anomalies of 1000 gammas or more are indicated on a random basis throughout the state,
To aid in studying the anomalous areas, the gravitational and magnetic data have been superimposed and each anomaly area given a letter designation (Fig. 9).
Figure 9--Map showing residual Bouguer anomalies, declination anomalies, and inclination isogams superimposed. Letters refer to discussion of anomaly areas in text.
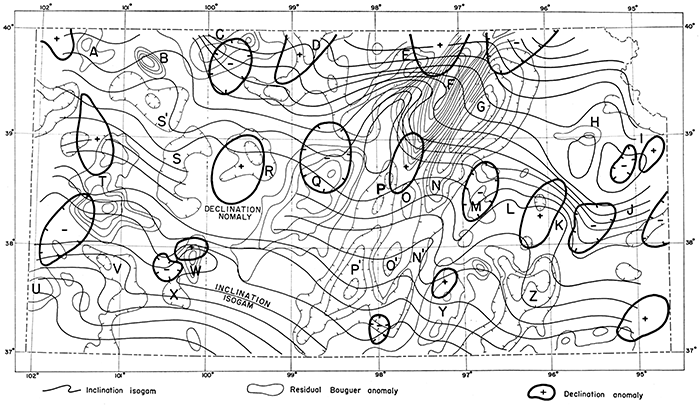
Area A--This is a local positive gravity anomaly area of about 10 mgal located on the Cheyenne-Rawlins County line. The anomaly is elongate north-south and covers an area 10 by 25 miles. A positive magnetic declination zone lies to the west of the area; absence of an associated negative magnetic declination zone east of the area probably is due to insufficient data. The inclination isogams are displaced northward over the gravity anomaly, suggesting paramagnetic material. A rock body of intermediate or more mafic character is thus indicated. It is not known whether this body reaches the basement surface or not.
Area B--This is a strong local positive gravity anomaly area of about 20 mgal that straddles the Rawlins-Decatur County line. It is elongate northwest-southeast and covers an area 10 by 20 miles. There is no obvious declination anomaly associated with the area, but inclination isogams are displaced northward. This anomaly and the anomaly in Area A lie on the south flank of the Cambridge Arch almost 25 miles due west of the Jennings Anticline. All the indications point to a basic intrusive body, which may well be gabbro as suggested by the large gravitational effect. The steep gravitational gradient associated with it suggests that the body probably reaches the basement surface, but well data do not confirm this.
Area C--This is a pronounced local positive gravity anomaly of about 15 to 20 mgal, which is elongate slightly north of east. The anomaly probably is the composite effect of two small bodies about 25 miles apart on the axis described. The over-all anomaly covers an area roughly 10 by 35 miles in the northern part of Norton and Phillips Counties. A pronounced declination minimum more or less coincides with the area, and there is pronounced northward displacement and increase in inclination gradient just west of the area. Material of high magnetic susceptibility is indicated, and it is probable that there is a positive magnetic declination anomaly area in Decatur County that does not show on the declination map (Fig. 8) because of scarcity of data. Farquhar (1957) in discussing this general area comments on "dark minerals, mostly tourmaline, hornblende, and magnetite" as being conspicuous in the granite samples from Decatur, Norton, and Rawlins Counties, the area characterized by positive gravity anomaly areas A, B, and C. These mineralogic data suggest a possible granodiorite-dioritic rock having a density close to 2.8 gm/cc. Because of the magnitude of the anomalies, the intrusive bodies must be pipe-like and extend to considerable depth. Taken together, areas A, B, and C seem to be a series of intermediate to basic intrusive bodies aligned more or less east-west over a distance of about 100 miles between Cheyenne and Phillips Counties. That the rocks may be more mafic than granodiorite is suggested by a bleached specimen from Phillips County, which may originally have been diabase, as reported by Farquhar. The occurrence of syenite in Norton County also suggests associated mafic material. Country rock other than granite seems to be the normal crystalline complex matrix, as schist and quartzite are reported. Structurally this series of postulated intrusives cuts across the Cambridge Arch and the alignment of the metasediments.
Area D--This area is a gravity minimum of about 10 mgal. It seems to be part of a larger structure extending southward from Nebraska, which has three local minima associated with it, one in Smith County aligned north-south covering an area about 10 by 20 miles, one in Rooks County covering an area 10 by 15 miles and elongate slightly north of west, and one on the Osborne-Mitchell County line covering an area about 5 by 10 miles and aligned more or less north-south. There is an associated magnetic declination high in Smith County, which has a steep gradient on the east side, suggesting an unmapped negative declination area to the east. There also is southward displacement of the magnetic inclination isogams and some increase in inclination gradient to the south extending down through Osborne County. This suggests less than normal magnetic susceptibility in the area extending from the Nebraska line, at the Smith-Jewell County border southwestward into Osborne County. Although there is little detailed information about lithology of the basement in this area, at least one of the gravity minima coincides with an area of infolded quartzite. As the average basement complex has a density exceeding 2.7 gm/cc, any extensive quantity of quartzite should give rise to small gravity minima. A second interpretation is that these gravity minima represent intrusions of the "late" granite described by Farquhar, the three localized areas of more negative values representing source areas. A third explanation for these minima is based on the upward migration of mafic material to form a cap of basic rock over a granitic column. The associated basic rock is discussed further in the summary of results.
Just east of this area is a positive gravity anomaly of 5 to 10 mgal centered in western Jewell County and trending slightly east of north. No distinctive magnetic effect is associated with it, however, and presumably it represents basic rock.
Areas E, F, and G--These three areas are treated as a unit because they are believed to be genetically related. Area E is characterized by a pronounced gravity minimum of 15 mgal that extends from the Nebraska line in Republic County southwestward into Lincoln County and covers an area roughly 15 by 70 miles. Structurally it cuts across the southern end of the Salina Basin, which trends slightly west of north. Area F is a pronounced gravity anomaly maximum of about 50 mgal covering a somewhat larger area, which extends along the same strike from the Nebraska border at the Washington-Marshall County line into southern Ottawa County. Area G is a gravity anomaly minimum that starts in southern Marshall County near the Nemaha County line and extends along the same strike as E and F to the Wilson-Burns structural element in central McPherson County. All three anomalies seem to terminate along a line that almost coincides with the axis of the Salina Basin. The abrupt termination of these anomaly areas and the seeming correlation with a structural axis strongly suggest basement faulting. The fact that the compound anomaly pattern of a "high" flanked by parallel "lows" is resumed but on a diminished scale and displaced eastward south of this postulated fault may substantiate the hypothesis. Magnetically the positive gravity anomaly area is flanked by two pronounced magnetic declination anomaly areas; the western area is positive and the eastern area negative, suggesting material of high magnetic susceptibility. The inclination isogams are severely distorted over an area about 100 miles long along the western boundary of the gravity high, and exhibit strong gradients in the northern part of this area, suggesting material of high magnetic susceptibility in the Ottawa-Clay County area. It was in Clay County that a strong vertical-component magnetic anomaly extending over a width of about 20 miles was encountered on the transcontinental series of gravity and magnetic measurements (Woollard, 1939). Farquhar (1957) in discussing this area mentions diabase, interlayered in quartzite, in Clay County and hornblendite in Marshall County, on the axis of the gravity high, and five peridotite plugs in Riley County, which lies off the axis but on the east flank of the high. Other rocks in the area are described as granite and schist. There is nothing structurally or lithologically unusual about the area of gravity minimum to the west, area E, but area G to the east includes the west flank of the Nemaha Anticline, and here the rocks of the basement seem to range all the way from orthoclase granite through schist, gneiss, and quartzite to limestone. Of these only the granite, gneiss (?), and quartzite would be expected to have a pronounced gravity negative anomaly in association. The anomaly indicated is -30 mgal, and this taken in conjunction with the associated high of +55 mgal results in a net difference of 85 mgal in a distance of only 20 miles. The change on the west flank of the high is 70 mgal in 18 miles. Because this pattern persists all the way to Lake Superior, the writer feels the high and its flanking lows should be treated as a single unit inasmuch as over-all mass distribution represented is probably related to a common cause.
In the Wisconsin-Minnesota area of this anomaly, the high seemingly is associated with a thick accumulation of basaltic lavas where emplacement locally warped down the crust to form a basin (the Lake Superior Syncline) in which thick Precambrian arkose accumulated in border areas. Thiel (1956) showed that most of the anomaly change (here 100 mgal), although not all, could be accounted for by the above conditions after post-intrusive faulting had elevated the central area of thick basaltic flow material.
In Kansas, although the geologic data verify the presence of basic and ultrabasic material in the positive anomaly area, there are no known flanking basin areas of low density sediments to explain the lows. Other geologic situations that would explain the anomaly are few. One would be that the arkosic material of the Wisconsin area is represented by quartzite in Kansas and that the situations are really the same. Another is that the Wisconsin correlation established by Thiel is fortuitous and that the basic explanation is related to some other cause. A dike-like body of mafic rocks similar to the Great Dike of Rhodesia, flanked by local granitic material, or some similar mass distribution in association with a near-surface laccolith might account for the anomaly. The latter explanation would call for a structural inversion because the granitic mass usually is in the center rather than the flank position of such bodies, as an upper-level differentiate. As the Duluth lopolith lies on the axis of the same anomaly feature in Minnesota, it seemed that relations described by Thiel (1956) might clarify the problem in Kansas. He found a transition in lithology from gabbro eastward to "red rock", but this differentiate is not believed to be a border facies. Because of glacial till cover to the west and the presence of Lake Superior to the east, the actual lithologic conditions at the boundary could not be determined. Eskola (1949) has reported small-scale conditions in Finland that would explain the anomaly pattern. There gabbro and amphibolite fill an in-folded synclinal area in granite gneiss. Of particular interest is the fact that the gabbro boundary on both flanks is marked by a thick layer of quartzite necessarily derived by erosion of older granitic terrain. Basic material in the syncline probably was emplaced as sills and flows. Subsequent regional metamorphism would then yield the situation observed. The answer to the problem in Kansas probably will not be solved until more well material becomes available and is studied petrologically. As indicated in the Conclusion, Professor R. C. Emmons at the University of Wisconsin is now conducting experiments that may provide a solution.
Area H--This is a local positive gravity anomaly area of 10 mgal centering at the junction of Shawnee, Douglas, and Jefferson Counties. It covers an area about 10 by 25 miles and is elongate east-west. It lies on the southern edge of a marked displacement of the inclination isogams, suggesting an area of marked magnetic susceptibility. Well data do not indicate any abnormal rocks in the area, but the magnetic vertical-component measurements made in 1940 across the area (Woollard, 1943) show a pronounced magnetic anomaly of about 1200 gammas just a mile north of the gravity structure. The two sets of data therefore strongly suggest the presence locally of basic rocks in the basement.
Area I--This area is anomalous only because of an apparent localized area of less than normal magnetic susceptibility. Two adjacent declination anomalies, the positive one on the east, indicate a disturbed area that seems to have a diameter of about 15 miles and is centered on the Johnson-Miami County line at Longitude 95° West. There is no gravity anomaly associated with the area.
Area J--This area centers on the Franklin-Anderson County line and shows only a small (5 mgal) negative anomaly closure, but a very disturbed magnetic field. Although the declination values do not give a clear picture, the inclination isogams show a displacement to the south, and an increase in gradient in this direction suggesting, as in area I, an area of less than normal magnetic susceptibility. There is no obvious explanation for the large inverse magnetic effects shown in areas I and J. They lie about 30 miles apart on a line trending slightly east of north and crossing a rise in the basement extending west-northwest from the Ozark Uplift. Another weak (5 mgal) minimum closure south of the area on the same line suggests presence of either granite or quartzite.
Area K--This is another area showing no pronounced local gravity anomaly but showing magnetic disturbance. The area includes most of Coffey County and the northern part of Woodson County. There are two pronounced adjacent declination anomaly areas, the positive one lying to the west. The inclination isogams are displaced to the north and the gradient steepens in that direction. Both sets of measurements therefore indicate material having greater than normal magnetic susceptibility. Farquhar, in discussing the basement lithology of this area, mentions the presence of peridotite as a sill-like body in Pennsylvanian sedimentary rocks and also refers to local magnetic anomalies observed in Wilson and Woodson Counties (Hambleton and Merriam, 1955). All the basement rocks seem to be granitic.
Area L--Just west of area K is a similar area of magnetic disturbance centered on the Chase-Lyon County boundary. As in area K, there is no pronounced gravitational anomaly, but there are a small (5 mgal) positive closure in the northwest corner of Lyon County and a somewhat larger area about 8 miles in diameter, involving a positive 5 mgal closure, in the western part of Lyon County opposite the Coffey County boundary with Osage County. These suggest small intermediate or basic rock bodies in the general vicinity of the magnetic disturbance. Structurally the area falls in the Brownsville Syncline.
Area M--This is an elongate area centering in Chase County embracing three 5-mgal positive gravity anomaly closures aligned along the axis of the Nemaha Anticline over a length of 50 miles. Magnetically, they coincide with a narrow area showing marked southward displacement of the inclination isogams. Farquhar reports both gabbro and porphyry in Chase County in the area of the central and largest positive gravity anomaly. This positive anomaly alignment continues southward along the axis of the Nemaha Anticline all the way to the Oklahoma border. As has already been shown, if the Nemaha Anticline were composed of normal granitic rocks, the relief would not produce a gravity anomaly of more than a fraction of a mgal, The positive anomaly closures in association with it here must therefore be related to included basic rocks. Their emplacement is probably a consequence of basement faulting, and the emplacement may have been late, as indicated by intrusion of peridotite into Carboniferous sedimentary rocks nearby.
Area N-O-P--This area seemingly is a slightly offset and very much diminished repetition of the major anomaly pattern represented by areas E-F-G farther north. The pattern centers over the Wilson-Burns element in McPherson County in the north and extends south about 80 miles, terminating just south of the Sedgwick-Reno-Kingman County line junction. The positive anomaly values are only about 10 mgal, in contrast to 55 mgal in the northern part of the state, and the parallel negative anomaly strips average 10 and 15 mgal respectively. Magnetically there are an associated pair of declination anomalies, the positive area to the west, and a northward displacement and increase in gradient of the inclination isogams, suggesting an area of material of high magnetic susceptibility in the southeast corner of Dickinson County. There is nothing known from well data that might explain this anomaly. The wide displacement between the declination high and low suggests that the body causing the anomaly probably lies at considerable depth.
Area Q--This area is a pronounced positive gravity anomaly (about 25 mgal), which centers in Barton County. The area is elongate northeast-southwest and is roughly 40 by 100 miles. It is the largest anomaly area in Kansas and embraces most of the Central Kansas Uplift. The anomaly area, however, strikes at right angles to the structural trend of the uplift. Magnetically there is an associated pair of declination anomaly areas, the positive area to the west. The source area indicated lies west of the gravity structure but over the center of the uplift between the Rush Rib and Russell Rib. No pronounced distortion of the inclination isogams is evident. Because of the wide spacing of the declination anomalies, the source seems to be deep seated, as is true for a similar anomaly pattern east of here in area N. Geologically there is abundant evidence to explain the gravity high, as gabbro is reported in Barton, Russell, and Rice Counties, although granitic igneous rocks, quartzite, and gneiss also are reported.
Area R--This area, slightly elongate northwest and about 20 miles wide, is characterized by a gravity minimum of 10 mgal. It occurs near the center of the southwest flank of the Central Kansas Uplift, in the southeast half of Ellis County. There is no obvious magnetic effect associated with it, and the logical interpretation is to ascribe it to either an intrusive granite body or a thicker section of quartzite. The fact that the area is known to be underlain by quartzite and that it is on strike with the Rush Rib of the Central Kansas Uplift, which is a known quartzite ridge, suggests strongly that the anomaly is due to quartzite rather than a granitic body.
Area S-S'--Area S is an elongate negative gravity anomaly area of about 5 mgal, which trends north-south and lies just west of the 1000 meridian. It extends from southern Graham County into Ness County, a distance of about 60 miles. There seems to be no pronounced magnetic anomaly associated with it. In outline the anomaly area resembles the anomaly area west of it, area T, and may be genetically related to it. North and west of the area is another similar area, S', a gravity minimum of 5 to 10 mgal centered over the Thomas-Sheridan County line. The magnetic picture is confused here by the strong effects associated with areas Band C. Wells in Thomas County show the presence of quartzite, but this mayor may not be the explanation for the anomaly. A granite body would have a similar effect.
Area T--This is a positive gravity anomaly area made up of two parts, a southern area involving 25 mgal centered over the Wichita-Scott County line and a northern area involving 10 mgal centered in the eastern half of Logan County. Actually three and possibly four positive anomaly centers are involved lying on two alignments, one trending just east of north and the other at right angles to it and intersecting it at its southern end. The magnetic field is disturbed, but it is not clear whether the effects are the same throughout. Because of the southward displacement of the inclination isogams and steepening of gradient southward and also because of the occurrence of a negative declination area farther west, the area of greatest gravity effect seems to be one of lower than normal magnetic susceptibility or else one polarized opposite to the earth's present field. In view of the strong gravity effect, the latter seems more logical. There are no well data for the area that help to explain the geophysical results, but it is likely that there is a cluster of four small basic rock masses on two perpendicular alignments in a sag area forming the tip of the Hugoton Embayment of the Anadarko Basin.
Area U--This is a local positive gravity anomaly area of 10 mgal, which occupies the western half of Stanton County. The magnetic inclination isogams are displaced northward over the body, which would therefore seem to be basic rock material. There are no basement well data for the area.
Area V--This is a fairly large negative gravity anomaly area of 5 to 10 mgal that has a general trend east of north from the Oklahoma line in Stevens County to northern Haskell County but there it hooks off at right angles into Kearny County, where it terminates. No well-defined magnetic effect is associated with the gravity anomaly, which therefore is probably related to an area of quartzite or granite. Basement information for the area is lacking.
Area W--This is a marked local positive gravity anomaly area of 15 mgal centering at the junction of Hodgeman, Ford, and Gray Counties. The area is characterized by a pronounced magnetic disturbance, the inclination isogams being displaced northward over the area, resulting in local development of a steep gradient. In the same area a marked positive declination anomaly is indicated. Although an associated declination minimum is not indicated, there probably is one just east of the area along the Hodgeman-Ford County line. The presence of an intrusive body of basic rock is indicated, but well data in the area do not substantiate this. Either the wells just miss the body or it does not reach the basement surface.
Area X--This area lies slightly south of area Wand is a weak negative gravity anomaly of 5 mgal centered over the GrayMeade County line. The presence of a pronounced negative magnetic declination closure east of the body suggests material of less than normal magnetic susceptibility. As in other areas of similar relations, either a local granite intrusive or a thick infolded quartzite section seems to be present here.
Area P'-O'-N'--This is a southward continuation of area P-O-N and is the southern extremity of the gravity pattern of a pronounced high flanked by lows that extends from here to Lake Superior. The western minimum here (area P') reaches a magnitude of -22 mgal and centers in Kingman County. The maximum (area O') is only 5 mgal and centers in the southeast corner of Reno Comity. The eastern minimum (area N') occupies a relatively narrow strip about 12 miles wide and averages -13 mgal all the way to northern Harper County. From the standpoint of origin it perhaps is significant that here in the terminal area the minimum continues around the high as a continuous belt from area N' to area P' and has an average anomaly of -12 mgal, This boundary area lies in southern Kingman County and adjacent parts of Sedgwick and Sumner Counties. Some deep well data here might go a long way toward resolving the cause of this anomaly feature, which is the most pronounced gravity feature thus far known in North America. The fact that the lows are of greater amplitude here than the high, in contrast to the relations observed farther north, strongly suggests that here the minima have been amplified by effects related to the parallel positive gravity anomaly elements in areas Q and Y.
Area Y--This is a marked positive gravity anomaly area characterized by three local centers of 15 mgal each. The area as a whole corresponds in position with the crest of the Nemaha Anticline and is a continuation of area M, which occupies a similar structural position. As in area M, the anomaly axis is slightly displaced to the west from the structural axis, but the northernmost local anomaly centers just east of the structural axis in northern Butler County. Although the magnetic data are far too sparse over the area, they do indicate a positive declination area over the Butler-Sedgwick County boundary west of the gravity high, suggesting that the material has a high magnetic susceptibility and hence is mafic. Gabbro has been reported in the area and this rock could cause the anomalies.
These relations over the Nemaha Anticline south of Wabaunsee County seem to be similar to those observed over the Arbuckle-Wichita-Amarillo Uplift of southern Oklahoma and northern Texas. This area of uplift is also characterized by a pronounced gravity maximum, part of which is shown in the regional gravity map (Fig. 1). Here also are pronounced magnetic anomalies, and in the heart of the uplift area, gabbro as well as granite and metamorphic rocks has recently been reported (Widess and Taylor, 1958). As on the Nemaha Anticline, it is not known whether the intrusions here are a cause or a consequence of the uplift.
Area Z--This area is a fairly large gravity anomaly minimum of about -15 mgal extending from the Oklahoma line in the vicinity of the Cowley-Chautauqua County line northward about 60 miles and averaging about 35 miles in width. The anomaly has its greatest development in southern Greenwood County and northern Elk County. A southward displacement of the magnetic inclination isogams suggests material of less than normal magnetic susceptibility and, as in other areas showing similar relations, an extensive body of granite and quartzitic material is indicated. Both materials are reported in the area, but the distribution pattern as plotted by Farquhar does not conform to the anomaly pattern, hence it is assumed that the effect is derived from an underlying granite body. This interpretation may also apply to all the other negative gravity anomaly areas, which without exception seem also to be areas of lower than normal magnetic susceptibility.
Although there are indications of a magnetic declination difference in the southeast corner of the state in the area of Cherokee, Labette, and Crawford Counties, there is no pronounced gravity anomaly in the area, and the disturbing body probably lies across the state line in Missouri.
To aid in the interpretation of the structural pattern suggested, Figure 10 shows the anomaly axes along with the basement structural axes and the -2500-foot contour on the basement surface and such additional basement contours as are needed to indicate the principal structural elements. The gravity anomaly axes are dashed, and the structural axes are drawn as solid lines. Positive anomalies and anticlinal or ridge axes are shown by outwardly directed arrows. Negative anomalies and synclinal or depression axes are indicated by inwardly directed arrows. Most of the points on structural alignment brought out in the previous discussions are graphically displayed on this map. The marked agreement on the whole between the azimuths of the anomaly trends and those for the two dominant structural trends, the Nemaha Anticline and the Central Kansas Uplift, is most striking. The common alternation of parallel positive and negative gravity axes suggestive of folding but actually signifying changes in lithology within the basement complex poses the principal problem. It would seem as though all the area were fundamentally granitic in character as suggested by Farquhar, and that there had been introduced into this homogeneous matrix a series of basic rocks along alignments that originally constituted a fracture pattern. Most areas of basic rock seem to be small, but there are two major ones. One centers in Clay County, has a strike parallel to the Nemaha Anticline, and lies west of it. This anomaly terminates at about 30°40' north latitude. The other, probably lying at greater depth, extends southward from about the same latitude but lies farther west, and underlies most of the eastern part of the Barton Arch. It is elongate at right angles to the structural trend of the uplift, however.
Figure 10--Map showing gravity anomaly axes, basement structural axes, and -2500-foot contour on basement surface (with such additional contours as are needed to show principal structural elements).
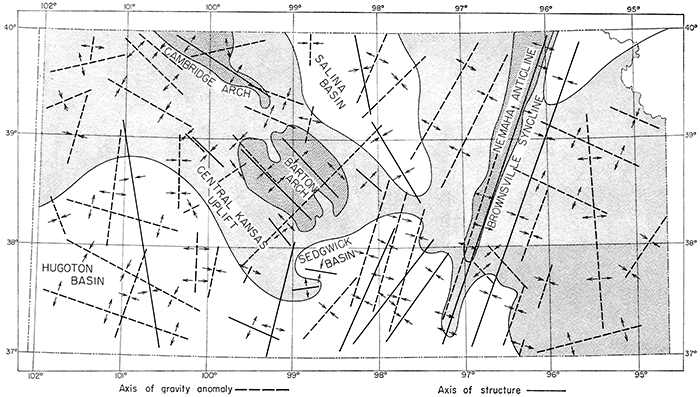
If these postulated basic rock masses were emplaced along fracture lines in a granitic area, then concordant areas of gravity minima parallel to the areas of gravity maxima would be formed automatically. To explain minima of less than near zero value, however, it is necessary to postulate that there is some physical or geochemical process associated with the emplacement of basic material that will produce an adjacent mass deficiency.
First to be considered are the mass variations that might be related to the intrusion of rocks of basic composition and the magnitude of an associated positive gravity anomaly. A pluton of basic material emplaced by assimilation of the invaded rocks would be expected to have a smaller gravity effect than the same material deposited at or near the surface and also would be characterized by weaker gravity gradients. These effects would be caused by a difference in proximity, possible difference in mafic mineral content, and the probable development of a border transition zone as a consequence of country rock alteration because of a slower rate of cooling. There is also a difference in the associated surface mass distribution to be expected. Assuming some domal uplift over an intrusive, there would be increased erosion of this area if it were exposed and not in a marine environment, and there would then also be deposition of sediments in a peripheral zone. The surface mass variations produced would be related to the density of the rocks uplifted, the density of the sediments produced, the ease with which these sediments could be removed elsewhere, the duration of uplift, the final thickness of detrital material produced, and the subsequent geologic history of the area.
In the case of surface or near-surface emplacement of basic rock material (basalts, associated sill-like bodies, or a basic laccolith), the uplift prior to actual emplacement would probably be greater than for a pluton, leading to more rapid erosion and a greater thickness of peripheral clastics. Actual eruption of basic rocks in the center of uplift, or the emplacement of a near-surface laccolith, would produce larger surface mass differential, giving rise to a more pronounced local gravity differential. In an area of surface eruption there might also develop a surface sag area that would create a locus of sedimentation for material from the adjacent highlands, further accentuating the difference in surface mass distribution because sediments from two sources would be involved.
Certainly in the Lake Superior area the geologic evidence indicates progressive synclinal downwarp of the area following and concurrent with the emplacement of the surface lavas (Hotchkiss, 1923). Here there are thick border areas of arkose, and although boundary faults have complicated the picture and the central area of greatest lava thickness has been subsequently uplifted, the basic structural picture and associated gravity relations are in agreement with the concept presented.
Another explanation that might fit the observed distribution of alternate gravity maxima and minima and their alignment on geologic structural axes is that the areas of gravity maxima and minima represent the distribution of sedimentary rocks in the basement areas prior to regional metamorphism. Carbonate and shale areas may be converted to schists containing heavy mineral assemblages such as diopside, garnet, and magnetite, and thus lead to positive gravity anomaly areas. Similarly areas of coarse clastic material would be granitized; quartzite formed in the areas of clean sands would now show gravity minima. Farquhar's map (1957) of the distribution of rock types in the basement of Kansas, however, does not confirm such a relation. There are extensive areas of "non-granitic" gneiss, schist, and phyllite and infolded quartzite, but none of these areas, either the "nongranitic" ones or the cores of infolded quartzite, seem to correlate in plan with the gravity and magnetic anomaly areas. It therefore seems likely that the mass distribution portrayed by the gravity measurements is predominantly related to the effects of intra-basement rock masses.
A third explanation is that the suggested basic rock areas really exist as "basic fronts" (Reynolds, 1947) or some analogous phenomenon associated with an underlying granitic body. Under this concept the basic rock would resemble the "cap rock" formed over the head of a salt dome. In terms of gravitational field disturbance the two would result in similar conditions. Where the basic rock material is near the surface it would dominate, giving a local gravity high, which would, however, be centered in a peripheral area of gravity minimum related to the deficiency in mass associated with the underlying acidic rock column extending to depth. This gravity relation is the one commonly observed in the Gulf Coast area in connection with salt domes having a cap rock. Where the crown of mafic material was removed by erosion or did not develop, a local gravity minimum would be associated with the granite column. As mentioned earlier, this is the relation that is commonly observed in connection with granites in areas of exposed basement rocks. There are, however, two objections to the "basic front" hypothesis: (1) it has yet to be demonstrated that "basic fronts" are a common geologic phenomenon, and (2) the writer so far has had poor success in deriving reasonable geologic models under this hypothesis that will fit the data. A condition that win fit this general concept, however, has been suggested by R. C. Emmons (personal communication) of the University of Wisconsin, based on work in progress. If we assume favorable structural conditions at centers of structural disturbance, such as intersections of basement fractures, the mafic constituents would migrate upward as a gas and become fixed in the upper 20,000 feet of the basement, principally through the action of water, to form a stable mafic mineral suite. This mechanism should produce a crown of basic rock expanding as the surface is approached and overlying an acidic rock column extending to depth.
The writer is also indebted to Professor Emmons for an alternate hypothesis concerning the gravity relations observed in Clay County and extending northward into Lake Superior. Here, as indicated earlier, it has not been possible to explain all the observed change in gravity on the basis of the known geology, despite the marked changes in mass associated with the central area of thick basalts and the deep flanking basins of arkose. Under the concept proposed by Professor Emmons and substantiated in part by laboratory experiments, any major crustal shear zone can be expected to have associated with it a migration of mafic material giving rise to a parallel arrangement of mass excess and deficiency.
As it is not the purpose of this paper to delve into the problems of petrology, the relative merits of the various hypotheses presented will not be discussed. The writer is convinced, though, that there is no single explanation for the gravity observations; that the explanation for the large anomalies in eastern Kansas is not the same as for those in western Kansas; and that there may be compound effects related to intrusion at depth as well as surface effects produced by domal uplift and the possible formation of concentrations of mafic material.
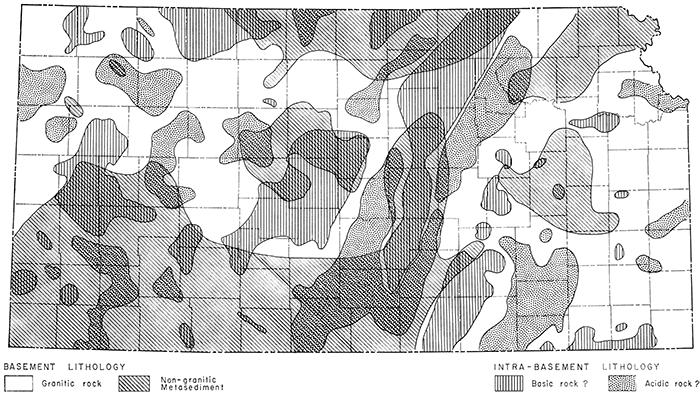
In view of all the uncertainties, it seems best at this time to assume that there is (1) a direct correlation between rock type and anomaly value, (2) the associated rock lies beneath the anomaly area, and (3) most of the anomalies are associated with intra-basement lithology, as there seems to be little correlation with lithology or configuration of the basement surface. The conclusions are essentially the same as those reached by Cook (1956) from his gravity study of northeastern Oklahoma and southeastern Kansas. The hypothesis that migration of mafic constituents has produced many of the mass inequalities observed, and that as a consequence there will be no direct correlation between anomalies and underlying rock type in some areas, is very attractive, but it cannot be said that the case has been proved by the present measurements. Figure 11 shows postulated basement and intra-basement lithology on the above basis of interpretation.
Figure 11--Map showing postulated basement and intra-basement lithology.
The present study has pointed up several items of interest. (1) Crustal structure in Kansas does not produce gravity changes in accordance with isostatic theory. The predicted crustal effect for the change in surface elevation under isostatic theory is about 30 mgal greater than that observed. (2) On the basis of seismic evidence in conjunction with the observed change in regional gravity values the crust seems to have both greater than normal mean density (2.92 gm/cc) and greater thickness (36 to 40 km) than would be predicated from a consideration of gravity data. (3) The effect of changes in basement configuration is effectively masked throughout the state because of burial by carbonate rocks, resulting in a lack of density contrast up to the level of greatest relief. (4) There is an east-west regional change in gravity of about 6 mgal related to a change from predominantly carbonate rocks in the east to a column composed of roughly equal parts of carbonate and clastic rocks in the west. (5) The residual gravity anomalies are elongate and to some extent arranged along axes paralleling structural axes, suggesting structural control of intrusions along former fracture lines. (6) Magnetic data in conjunction with the gravity data indicate that the areas of gravity maxima (5 to 55 mgal) probably represent assemblages of basic rocks. The areas of gravity minima (5 to 30 mgal) seem to be related to granitic or quartzitic material. (7) The fairly extensive information concerning the lithology of the basement rocks suggests that the gravity anomaly areas are related primarily to changes in intra-basement lithology. (8) The common arrangement of gravity minima peripheral and parallel to central areas of gravity maxima in most areas poses a problem that has not been resolved in that none of the hypotheses presented seems to be corroborated by well data concerning the nature of the rocks forming the basement rock complex.
Black, W. A. (1954) Unpublished thesis, Wisconsin Univ.
Bean, R. T. (1953) Relation of gravity anomalies to the geology of central Vermont and New Hampshire: Geol. Soc. America, Bull., v. 64, p. 509-538.
Cook, K. L. (1956) Regional gravity survey of northeastern Oklahoma and southeastern Kansas: Geophysics, v. 21, p. 88-106.
Duerksen, J. A. (1949) Pendulum gravity data in the United States: U. S. Coast and Geod. Survey, Spec. Pub. 244, 218 p.
Eskola, P. (1949) The problem of mantled gneiss domes: Geol. Soc. London, Quart. Jour., v. 104, p. 461-476.
Farquhar, O. C. (1957) The Precambrian rocks of Kansas: Kansas Geol. Survey, Bull. 127, pt. 3, p. 49-122. [available online]
Garland, G. P. (1950) Interpretation of gravimetric and magnetic anomalies or traverses in the Canadian Shield in northeastern Ontario: Canada Dom. Obs. Pub., v. 11, 57 p.
Hambleton, W. W., and Merriam, D. F. (1955) Magnetic anomalies in Wilson and Woodson Counties, Kansas: Kansas Geol. Survey, Bull. 114, pt. 3, p.113-128. [available online]
Hotchkiss, W. O. (1923) The Lake Superior geosyncline: Geol. Soc. America, Bull., v. 34, p. 669-678.
Howe, H. H., and Knapp, D. G. (1935) U. S. magnetic tables and magnetic charts, Ser. 602: U. S. Coast and Geod. Survey, 161 p.
Kellett, Betty (1932) Geologic cross section from western Missouri to western Kansas: Kansas Geol. Soc. Guidebook, 6th Ann. Field Conference.
Lyons, Paul (1950) A gravity map of the United States: Tulsa Geol. Soc. Digest, v. 18, p. 33-43.
Miller, A. H. (1946) Gravimetric surveys of 1944 in New Brunswick: Geol. Survey Bull. 6, Canada Dept. Mines, p. 1-28.
Press, Frank, and Ewing, W. M. (1957) The regional measurements of crustal thickness: Geol. Soc. America, Abs. Ann. Meet., Atlantic City, N. J.
Reynolds, D. L. (1947) The association of basic fronts with granitization: Sci. Prog., v. 35, p. 205-219.
Steenland, N. C., and Woollard, G. P. (1952) Gravity and magnetic investigation of the structure of the Cortlandt Complex, New York: Geol. Soc. America, Bull., v. 63, p. 1075-1104.
Steinhart, J. S., Meyer, R. P., and Woollard, G. P. (1958) Crustal thickness and associated gravity anomalies in selected areas: Soc. Expl. Geophys., 28th Ann. Meet.
Sumner, J. S. (1955) Unpublished thesis: Wisconsin Univ.
Thiel, E. C. (1956) Correlation of gravity anomalies with the Keweenawan geology of Wisconsin and Minnesota: Geol. Soc. America, Bull., v. 67, p. 1079-1100.
Thwaites, F. T. (1940) Buried Precambrian of Wisconsin: Wisconsin Acad. Sci., Arts, Letters, Trans., v, 32, p. 233-242.
Ver Wiebe, W. A. (1952) North American petroleum: Private pub., 459 p.
Widess, M. B., and Taylor, G. L. (1958) Seismic reflections from within the Precambrian basement complex, Oklahoma: abst., Soc. Expl. Geophys., 28th Ann. Meet.
Woollard, G. P. (1943) Transcontinental gravitational and magnetic profile of North America and its relation to geologic structure: Geol. Soc. America, Bull., v. 54, p. 747-790.
Woollard, G. P. (1948) Gravity and magnetic investigations in New England: Am. Geophys. Union, Trans., v. 29, p. 306-317.
Woollard, G. P. (1958) Results for a gravity control network at airports in the United States: Geophysics, v. 23, no. 3, p. 520-535.
Woollard, G. P., Harding, N. C., and Rose, J. C. (1955) The problem of calibrating high range geodetic type gravimeters: Am. Geophys. Union, Trans., v. 36, p. 12-24.
Worzel, J. L., and Shurbet, G. L. (1955) Gravity interpretations from standard oceanic and continental crustal sections: Geol. Soc. America, Spec. Paper 62, p. 87-100.
Kansas Geological Survey
Comments to webadmin@kgs.ku.edu
Web version Nov. 23, 2013. Original publication date 1959.
URL=http://www.kgs.ku.edu/Publications/Bulletins/137/Woollard/index.html