| Original published in W.W. Hambleton, ed., 1959, Symposium on Geophysics in Kansas: Kansas Geological Survey, Bulletin 137, pp. 335-349 | ||
Carter Oil Company
The complete article is available as an Acrobat PDF file.
The Law Southeast pool was discovered in January 1955, as a result of a program of seismic exploration. Prior to the seismic survey, three dry holes, which gave no indication of local structure, had been drilled in the area. This paper compares seismic interpretation before drilling with geologic interpretation after drilling, to show successful results of seismic exploration.
Throughout Kansas, increased seismic activity in recent years has drawn attention of the geologist to the value of geophysical exploration as another tool to aid in the discovery of small subsurface structures. The seismograph has proved its ability to find small local structures capable of producing oil that might otherwise remain undiscovered, owing to lack of subsurface control.
One such structure, found by seismic survey in Graham County, proved to be productive and is now known as the Law Southeast oil pool. This report compares structure indicated by seismic reflections with structure subsequently shown by subsurface geologic methods.
The Law Southeast oil pool is located in sec. 1 and 12, T. 10 S., R. 23 W., Graham County, Kansas (Fig. 1). Geologically, it is on the west flank of the Central Kansas Uplift. Nearby production is from the Law, Hoof, and Diebolt pools to the west and the Vesper, Red Line, and Fargo West pools to the north and northeast. There is no major production near the Law Southeast pool to the east or south.
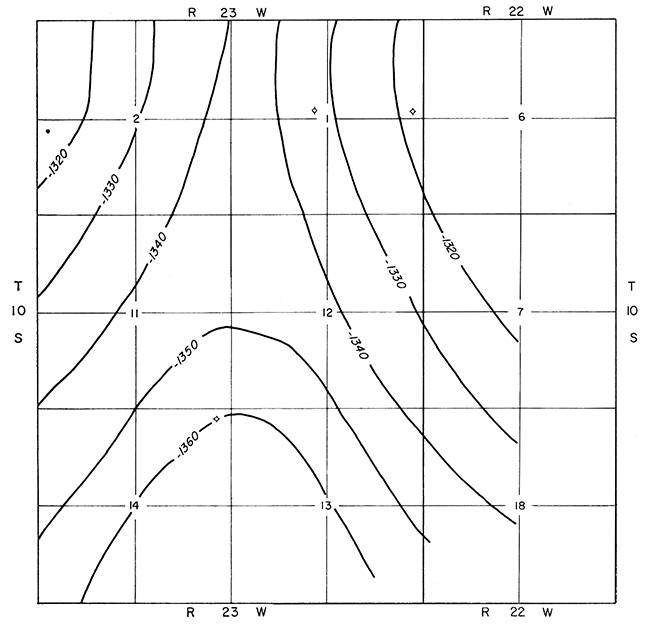
Only three wells had been drilled near this area prior to the seismic survey. These wells, Harry Gore No. 1 Stites (SE SE NE sec. 1, T. 10 S., R. 23 W.), Victor Drilling and Deep Rock No. 1 Ninemire (SE SE NW sec. 1, T. 10 S., R. 23 W.), and Harry Gore No. 1 Walker (NE cor. sec. 14, T. 10 S., R. 23 W.), were dry arid structurally low as compared to the Law pool. Lack of well control made it impossible to find any indication of closed structure in the area. Figure 2 shows a structural map on the Lansing Group that was constructed prior to the seismic survey.
Figure 1--Map showing location of Law Southeast field.
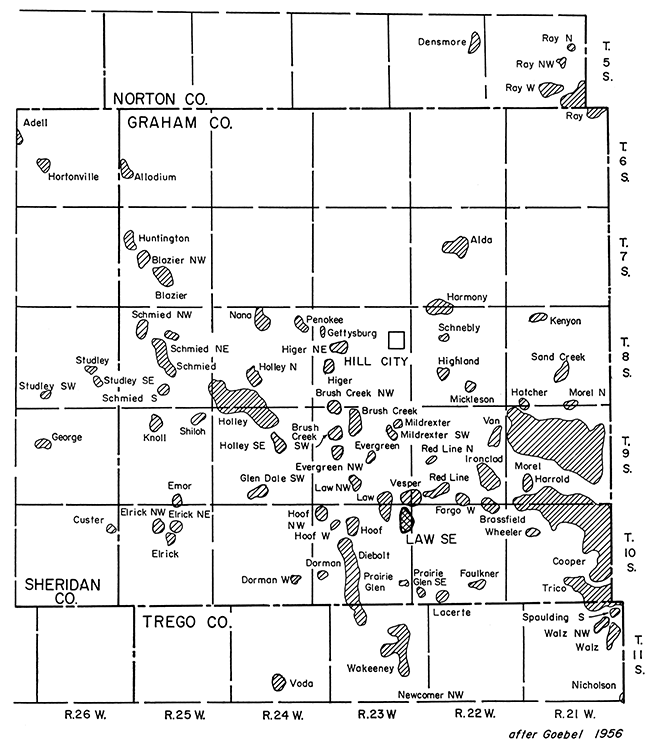
Figure 2--Structural map on Lansing Group constructed prior to seismic survey.
During December 1954 a seismic survey was made by SeisTech Exploration Company of Wichita, Kansas, in sec. 1, 12, 13, and 14, T. 10 S., R. 23 W., Graham County to evaluate possible structure. Owing to favorable results of this survey, the Heathman-Seeligson Drilling Company drilled a wildcat test during January 1955 in the SW SW NE sec. 12, T. 10 S., R. 23 W. This well, the No. 1 Irwin, revealed presence of oil in two zones in the Lansing-Kansas City Groups, and also in Pennsylvanian basal conglomerate. The well was completed in Pennsylvanian basal conglomerate and had an initial potential of 357 barrels of oil per day.
Since the Heathman-Seeligson No. 1 Irwin discovery, 16 other wells have been drilled in the area; 12 wells produce oil and had initial potentials ranging from 110 to 1,775 barrels per day.
The Lansing-Kansas City, which has been subdivided for convenience into the 20-, 40-, 60-, 90-, 120-, 140-, 160-, 180-, 200-, and 220-foot zones (Fig. 3), is the major oil producer in this field. Although not every zone was tested in each well, drill-stem tests have recovered oil from each zone of the Lansing-Kansas City with the exception of the 220-foot zone, which contains salt water.
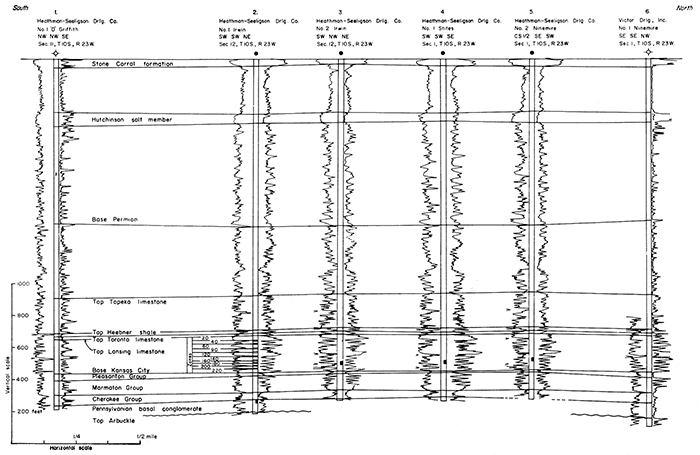
Figure 3--Cross section of Law Southeast field from electric and radioactivity logs. All logs are gamma-neutron except for gamma-laterologs at wells 1 and 6. Locations shown on Figure 9.
Eight of the development wells were completed in the 180-foot zone and two in the 160-foot zone of the Lansing-Kansas City, and two in the Pennsylvanian basal conglomerate. Other zones of the Lansing-Kansas City mayor may not contain oil in commercial quantities.
These wells made it possible to construct fairly accurate structural maps; comparison of these maps with seismic survey maps shows the degree of accuracy obtained by seismic methods.
Cumulative production to the end of 1957 from approximately 500 proved acres of the Law Southeast oil pool is 208,166 barrels of oil. Gravity of the oil averages 29.6° (Goebel and others, 1958, p. 173).
Topographically, the area covered by this seismic survey has a maximum relief of about 70 feet. Surface rocks are the Ogallala formation, of late Tertiary age. These rocks rest with angular unconformity on the Niobrara formation, of Late Cretaceous age. Thickness of the Cretaceous is approximately 1,400 feet in this area. An angular unconformity separates Cretaceous rocks from underlying Permian rocks; Jurassic and Triassic rocks are absent. The Permian is about 1,500 feet thick; the upper part consists of redbeds (alternating sandstone and shale), evaporites, and limestone. The first good seismic marker bed in the upper Permian is the Stone Corral formation. The Stone Corral and older rocks are shown in a geologic cross section (Fig. 3) constructed from electric and radioactivity well logs. The Stone Corral, here consisting of about 40 feet of anhydrite, is commonly called "Cimarron anhydrite" or "anhydrite" by subsurface geologists. Another bed in the upper Permian, the Hutchinson salt member of the Wellington formation, influences seismic reflections by introducing variability in velocity.
The Permian rocks disconformably overlie alternating marine and nonmarine beds of limestone and shale of the Pennsylvanian System. The Pennsylvanian, about 1,100 feet thick, is similar to lower Permian cyclic deposits. Two important markers in the Pennsylvanian section are the top of the Topeka limestone and the Heebner shale (Fig. 3). Stratigraphically below the marker beds is a sequence of limestone beds of the Lansing-Kansas City Groups, the Pleasanton, Marmaton, and Cherokee Groups, and the Pennsylvanian basal conglomerate.
A marked angular unconformity between Mississippian and Pennsylvanian rocks indicates a period of major tectonic movement. Uplift resulted in emergence; rocks of Mississippian and Ordovician age were stripped from the crest and flanks of the Central Kansas Uplift, hence beds of Pennsylvanian age rest on the truncated Cambro-Ordovician Arbuckle dolomite. Below the Arbuckle is the Reagan sandstone, which in turn lies unconformably on the Precambrian basement complex of igneous and metamorphic rocks. Structures in the area reflect the uneven basement surface; although they generally lose some of their relief at major unconformities, they are indicated by closure or nosing in rocks stratigraphically as high as the Stone Corral formation.
Thirty-five shot holes were used for this survey. Spacing was irregular and the depth of shot holes ranged from 80 to 140 feet. Type of shooting was spot correlation, utilizing a single-end 8- trace triple-recorded spread. Correction for weathering by the "rough topography method" utilized the modified up-hole time and the depth of shot to correct for surface errors.
Because near-surface velocity variables introduce errors, interpretation of conventional seismic maps may not be reliable. Although conventional maps were constructed, they were not used alone in evaluating the prospect.
The "anhydrite method," which utilizes the Stone Corral formation as a reference datum for computation of reflection time intervals, served to eliminate the effect of near-surface velocity variables. Isotime maps are constructed for the time interval between the Stone Corral and an identifiable reflecting bed below the Stone Corral, thus no weathered-layer correction is required. Isotime maps generally are reliable for structural evaluation inasmuch as the rock column thins over most structural highs in this area.
Beebe and Ballou (1956) list two sources of error in using the "anhydrite method", one of which is velocity variation below the reflecting reference plane; in most local surveys this is negligible, but the Hutchinson salt, below the Stone Corral, may be as much as 50 feet thick. As its thickness is irregular, some discrepancies are to be expected.
The second source of error has to do with the attitude of the Stone Corral reference plane. Beebe and Ballou write that it is necessary to assume that the Stone Corral is flat. Thus, if time· intervals between the Stone Corral and a deeper bed are constant along a seismic line, and if there are no intervening anomalous velocity variables, the deeper bed also is flat. If time intervals decrease, thinning of section is indicated and the deeper bed has positive structure. If time intervals increase, the section is thicker and the reflecting bed is structurally lower. Maps constructed from interval data would therefore show only the attitude of the beds below the Stone Corral at a time when the Stone Corral was horizontal, thus revealing structure in late Permian time and not present structure. The actual structure of deeper beds is reflected in the attitude of the Stone Corral, which is gently upwarped in many places (Merriam, 1955). In critical areas, therefore, structural conditions can be determined only if an accurate seismic map is constructed on the Stone Corral. The Stone Corral or "anhydrite" method may be very reliable, especially if results are checked by core drilling.
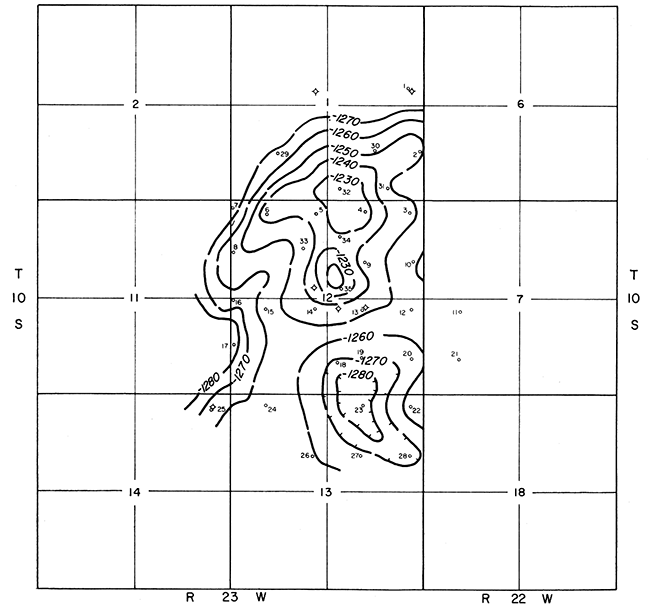
The structural map on the Stone Corral formation contoured from seismic data (Fig. 4) shows a symmetrical, northeast-trending anticline accentuated by two small closures on its crest. A structural saddle in the southwest corner of section 12 separates the Law Southeast structure from another structure farther southwest along the same trend. Paralleling the anticline on its southeastern flank is a syncline plunging southwest. Seismic information used to construct this structural map is judged to be reliable.
Figure 4--Structural map on Stone Corral from seismic data. Contour interval 10 feet, sea level datum.
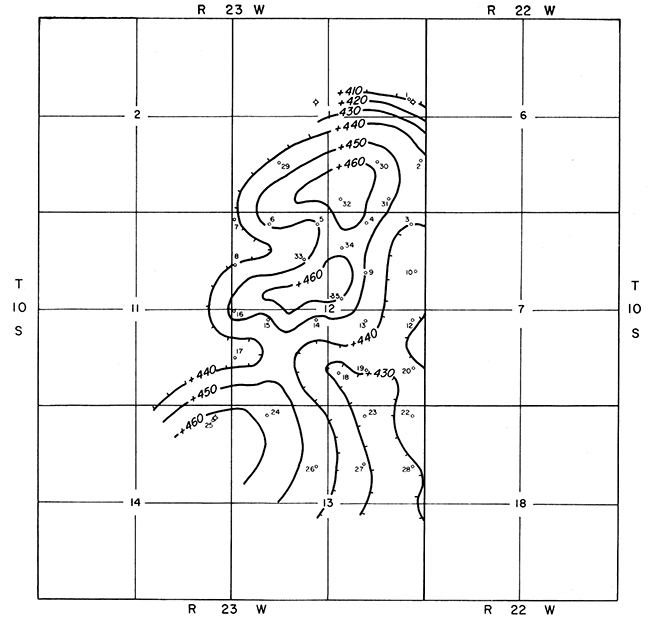
Figure 5--Conventional seismic map on top of Lansing. Contour interval 10 feet, sea level datum.
A seismic map contoured on top of the Lansing Group is shown in Figure 5. The Law Southeast structure is revealed as an asymmetrical, northeast-trending anticline, the northwest flank being the steeper. Two small closed highs are located on the crest of the structure. In the southwest corner of section 12 a structural saddle separates the Law Southeast structure from another structure farther southwest. A closed syncline is located in the southeast corner of section 12 and northeast corner of section 13. Seismic data are poor to fair.
The seismic maps on top of the Stone Corral and on top of the Lansing correspond closely as to the position and trend of the Law Southeast structure. There are, however, two notable differences: (1) the seismic map on the Stone Corral shows the anticline to be symmetrical, whereas the structure on the Lansing is slightly asymmetrical; (2) the structural relief on the Lansing is greater than that on the Stone Corral. The difference in relief is to be expected because structures in this area generally are more pronounced at depth.
An isotime map of the Stone Corral-Lansing interval (Fig. 6) was constructed according to the "anhydrite method" described by Beebe and Ballou (1956). The seismic information, for the most part, is believed to be only fair. The structure as revealed by the isotime map is a northeast-trending anticline, on which a single closure is located near the center of section 12. A minor syncline plunging southwestward is located on the southeastern flank of the structure. An isotime map also was prepared for the interval between the Stone Corral and the pre-Pennsylvanian surface (Fig. 7). A single large closed irregular high is shown in the center of section 12. Inasmuch as the pre-Pennsylvanian surface is irregular, owing to pre-Pennsylvanian erosion, it is to be expected that this map should show irregularities. Information used for construction of this map is regarded as poor to fair.
Figure 6--Isotime map of Stone Corral-Lansing interval. Contour interval .002 seconds.
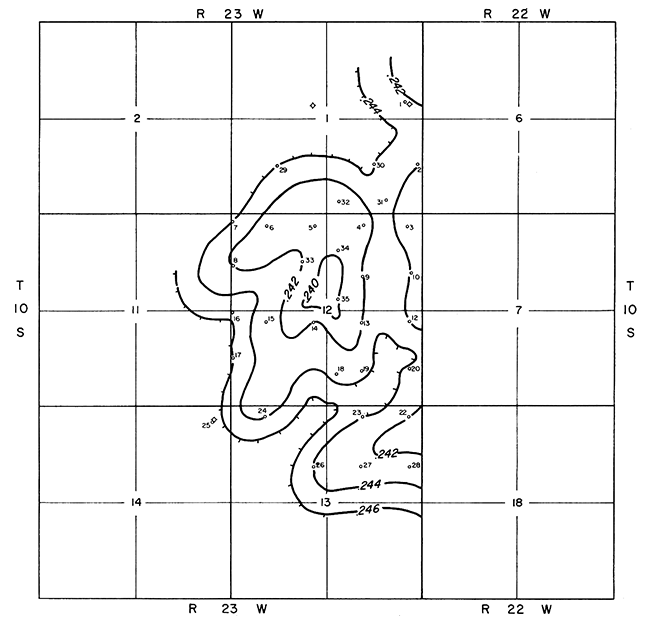
Figure 7--Isotime map for interval between Stone Corral and pre-Pennsylvanian surface. Contour interval .002 seconds.
Several differences may be noted between the Stone CorralLansing isotime map and the conventional seismic maps showing structure on the Stone Corral and the Lansing. Although near-surface velocity variables have been eliminated by use of the "anhydrite method," it should be remembered that the isotime map shows structure on the Lansing in Stone Corral time. The isotime map is similar to the conventional seismic map contoured on the Stone Corral formation except that it shows only one closure on the crest of the structure. On both maps closure is indicated near the center of section 12, and the structural relief on both maps is about the same.
Subsequent development in the field permitted preparation of detailed geologic maps. Electric and radioactivity logs were used to pick formation tops, and structural maps were contoured from these data. A radioactivity log of the discovery well (Heathman-Seeligson No. 1 Irwin) and a typical seismic record are compared in Figure 8. Figure 9 is a structural map contoured on the Stone Corral formation from well-log data. The structure is essentially a symmetrical northeast-trending anticline. Seemingly a structural saddle occurs in the southwestern part of section 12, where information is sparse.
Figure 8--Comparison of radioactivity log of discovery well (No. 1 Irwin, SW SW NE sec. 12, T. 10 S., R. 23 W.) and seismic record from adjacent shot point.
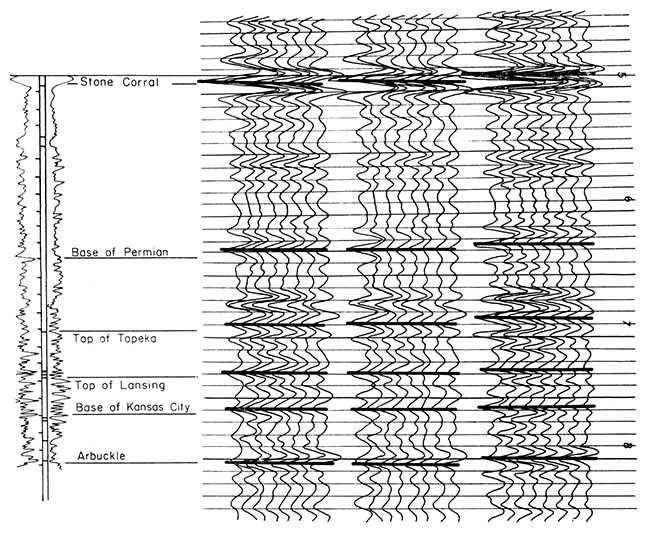
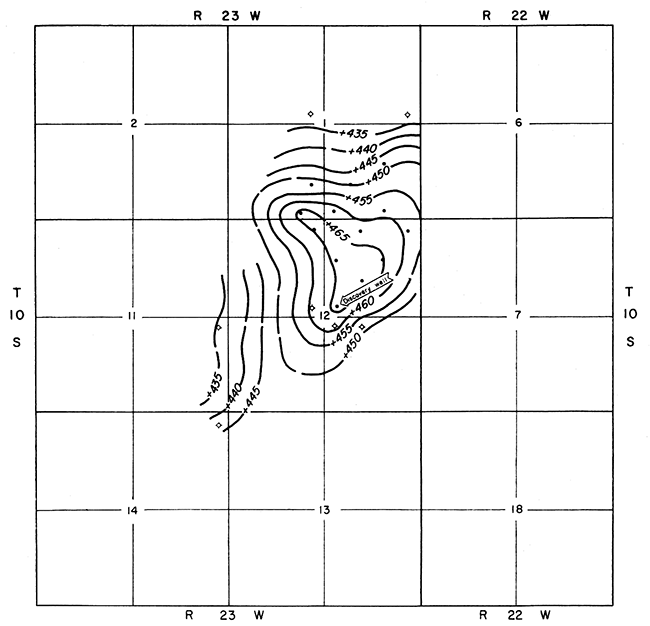
Figure 9--Structural map of Stone Corral from well data. Contour interval 5 feet, sea level datum.
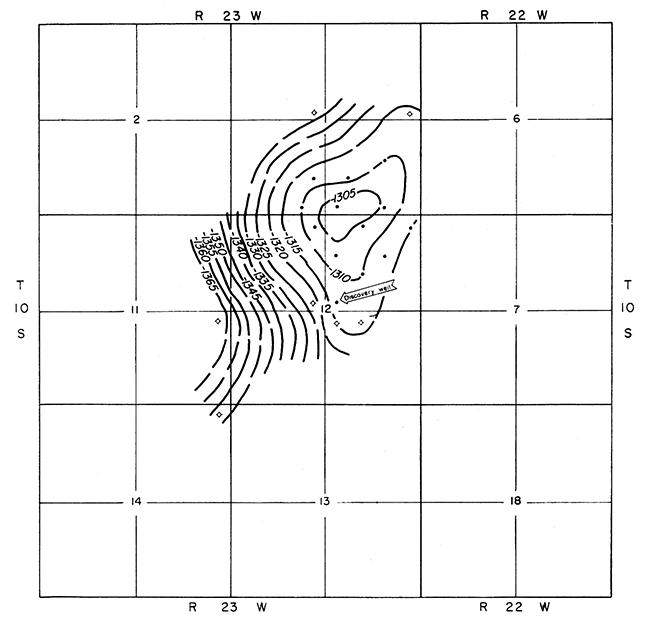
A structural map contoured on the Heebner shale of the Oread formation (Fig. 10) reveals almost the same structure as one contoured on a limestone of the Lansing Group (Fig. 11). The Lansing structure is a northeast-trending anticline on which is a single closed high in the northeast corner of section 12 and the southeast corner of section 1. The northeast flank of the structure is steeper than the southeast flank. Although information is not available, a structural saddle may be located in the southern part of section 12.
Figure 10--Structural map on Heebner shale. Contour interval 5 feet, sea level datum. Shows location of wells and cross section, Figure 3.
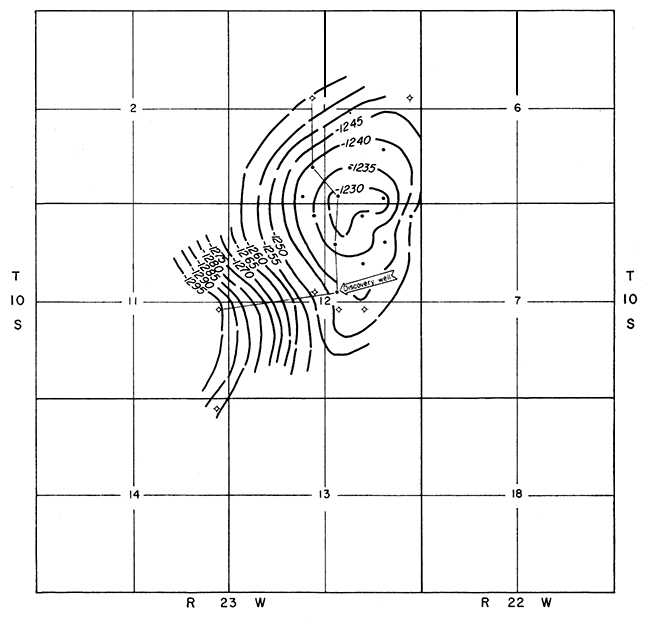
Figure 11--Structural map on Lansing. Contour interval 5 feet, sea level datum.
Three notable differences can be seen by comparing the maps of structure on the Stone Corral formation and the structure on the Lansing Group: (1) the location of the closed high on the Stone Corral is located in the W2 NE sec. 12, whereas the top of the structure as indicated by the Lansing map has shifted somewhat to the north; (2) the structure on the Stone Corral formation is roughly symmetrical, whereas the Lansing structure is slightly asymmetrical; (3) the structural relief on the Lansing is greater than that on the Stone Corral. These differences also have been noted by Merriam (1955); they probably are due partly to slight differences in degree of structural deformation and partly to location in relation to major tectonic features.
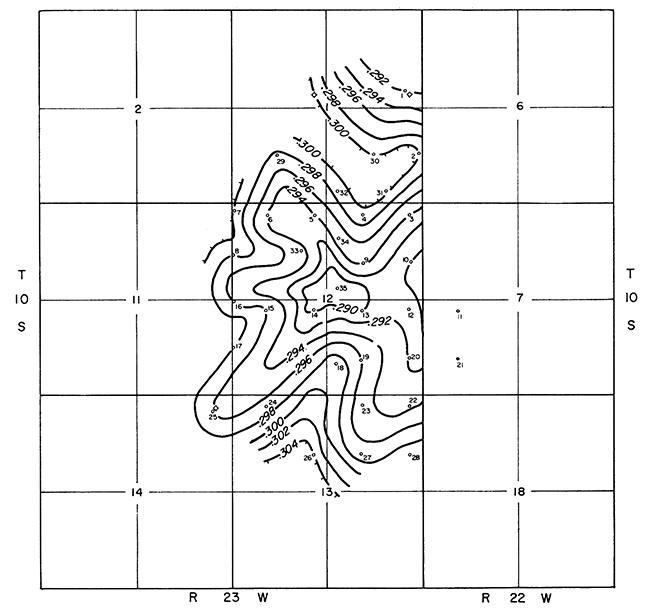
An isopachous map of the sequence from the Stone Corral to the Lansing (Fig. 12) was prepared from well data. This map shows structure on the Lansing when the Stone Corral was horizontal. The structure revealed is an irregularly north- to northeast-trending anticline plunging southward to a position in the east half of section 12 where the plunge reverses to the north. Flattening along the crest of the structure in the southeast corner of section 1 suggests that a smaller contour interval probably would reveal closure.
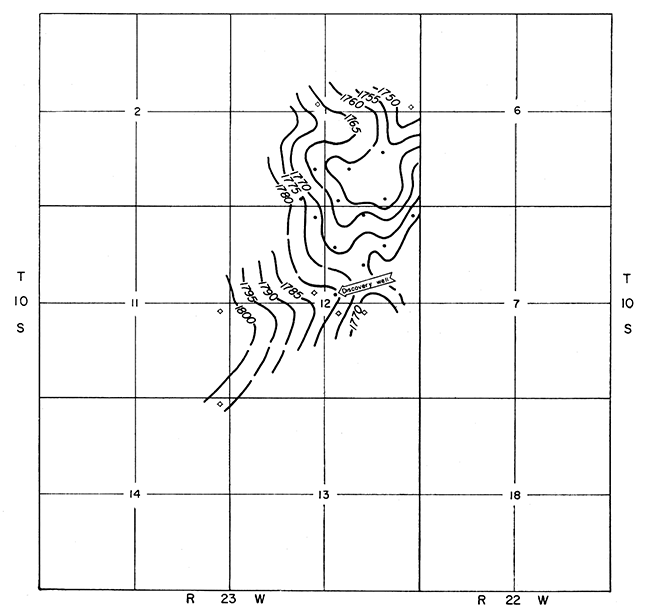
Figure 12--Isopachous map of Stone Corral-Lansing interval. Contour interval 5 feet.
Comparison of seismic and geologic maps.-The seismic structural map on the Stone Corral (Fig. 4) does not tie to pre-development dry holes as closely as desirable for development purposes. For example, the seismic elevation of the Stone Corral for the well in the SE SE NE sec. 1 is 409 feet, whereas the actual elevation in the well is 433 feet. Another difference between seismic and geologic elevations is found at shot point 9, which eventually became the drill site for the No. 4 Irwin (NE SW NE sec. 12). The seismic map shows the Stone Corral to be 17 feet lower than its actual elevation. It is noted, however, that the high point shown at shot point 35 (SW SW NE sec. 12), which is 7 feet lower than the actual elevation, also is the high point on the Stone Corral geologic structural map. These discrepancies in elevation probably are due to near-surface variation in velocity. Similar comparisons could be made between seismic and geologic maps on the Lansing.
Comparison of the isotime map of the Stone Corral-Lansing interval (Fig. 6) with the Stone Corral-Lansing isopachous map (Fig. 12) shows few similarities. For example, the isotime map shows an increase of four milliseconds between shot points 1 and 25. Inasmuch as each millisecond is equivalent to 5 feet, 20 feet of thickening is indicated. The Stone Corral-Lansing isopachous map shows thickening of 51 feet between the same two points. Also, it may be noted that the smallest time interval as interpreted from seismic records is in the SW NE sec. 12; however, well data indicate that this is one of the thickest areas. The thinnest section on the geologic isopachous map is the southeast part of sec. 1, whereas this is one of the thickest areas on the seismic map. A possible explanation for discrepancies between the two maps is that the Hutchinson salt thins and thickens in short lateral distances. Other differences between these two maps are that the closure shown on the seismic map is larger than that on the geologic map, and the position of the structure on the geologic map seemingly is north of the position indicated by the seismic map (the high point of the structure is about one-half mile north of the center of sec. 12).
The pre-discovery seismic survey provided the information indicating a favorable structure in the area; except for the seismic survey, the Law Southeast pool might have remained undiscovered. Based on seismic information, the discovery well of the Law Southeast pool was drilled in January 1955, and subsequent drilling led to complete development of the area.
The "anhydrite method" seemingly is the best method of seismic mapping in this area, and geophysicists recommend it as preferable to conventional seismic structural mapping, which has doubtful reliability because of near-surface velocity variables in the weathered layer.
The resulting seismic maps of the area compared favorably with geologic maps of the developed field. The structure indicated by seismic surveying is larger than that shown on the geologic map and the high point shown on the seismic structure map is south of its actual location, nevertheless, the seismograph did its job successfully.
Presentation of this paper was made possible through the cooperation of Mr. Jack H. Heathman of Heathman Oil Company, who contributed the seismic information, and Mr. William R. Thurston of the Kimbark Company, present owner of the Law Southeast production, who gave permission for release of this information. Daniel F. Merriam kindly reviewed the manuscript.
Beebe, B. W., and Ballou, A. L., Jr. (1956) Case history of the Smallwood Pool, Stafford County, Kansas: Geophysical Case Histories, v. 2, Soc. Expl. Geophysicists, p. 310-327.
Goebel, E. D., Hilpman, P. L., Hornbaker, A. L., and Beene, D. L. (1958) Oil and gas developments in Kansas during 1957: Kansas Geol. Survey Bull. 133, p. 1-264.
Merriam, D. F. (1955) Stone Corral structure as an indicator of Pennsylvanian structure in central and western Kansas: Kansas Geol. Survey Bull. 114, pt. 4, p. 129-152. [available online]
Kansas Geological Survey
Comments to webadmin@kgs.ku.edu
Web version Jan. 17, 2014. Original publication date 1959.
URL=http://www.kgs.ku.edu/Publications/Bulletins/137/Winchell/index.html