 |
|
Kansas Geological Survey Open-file Report 2003-82 |
3.3 Gas Content
Evaluation of coalbed gas potential for the Cherokee Group involves estimates of the gas content of coal samples. Gas content is based on desorption measurements of coal samples. Following catchment of cuttings or retrieval of core at the wellsite, desorption is continued under near stable conditions in the laboratory (see Chapter 1 for methodology). In the case of cuttings, lost gas is significantly greater than that of cores because the cuttings sample is pulverized before reaching the surface. However, cuttings reach the surface in a matter of seconds in air-drilled wells, whereas cores can take several minutes to reach the surface. The measured volume of desorbed gas for cuttings is commonly on the order of 25-30% lower than desorbed gas from cores (Nelson, 1999). In this study, a correction of +25% was used when calculating and comparing desorbed gas contents for cuttings samples.
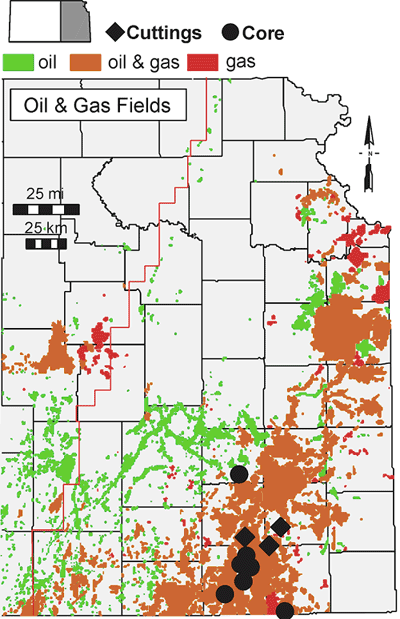
Desorption analysis was conducted on core and cuttings samples from ten wells in the Cherokee basin (Figure 3.02). Desorption measurements for cores were calculated on an as-received basis (gas content calculated on whole dry weight of sample) and averaged for each coal and shale sampled and reported as standard cubic feet per ton (scf/ton; Figure 3.03). In the case of cuttings, the gas content of the coal was calculated assuming that admixed dark shales desorbed 3 scf/ton. This latter measure is consistent with the lower range of gas contents measured in dark shales from the Cherokee Group. Gas contents have a wide range from 3 scf/ton to over 300 scf/ton for coal. Black shale gas contents range from 3 scf/ton to 35 scf/ton. The highest quality coals, based on their gas content, are the Riverton, Weir-Pittsburg and Mulky (Figure 3.03). Putting all desorption values from Cherokee Group coals versus sample depth shows a slight trend of increasing gas content with depth (Figure 3.04).
Figures 3.05 - 3.08 depict the typical desorption characteristics versus
time for coals from individual wells in Montgomery, Labette, Wilson and Neosho
counties. In general, coals have higher gas contents in Montgomery County.
This may be due to the coal deposits in Labette and Neosho counties, being
up dip (i.e., shallower), the use of cuttings in Neosho and Wilson counties
resulting in lower measured gas contents, or the limited sampling in Neosho,
Labette and Wilson counties.
 |
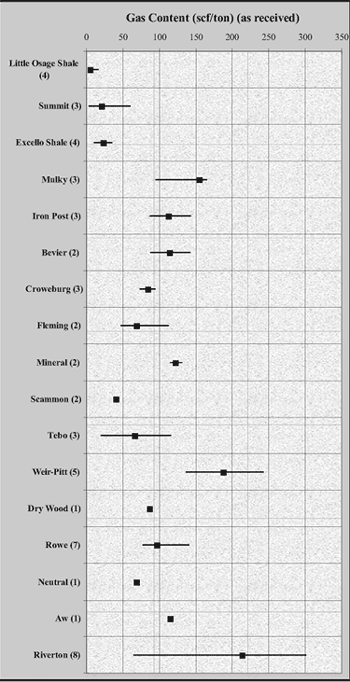 |
| Figure 3.02 - Locations of cores and cuttings of Cherokee Group coal collected for desorption analysis. | Figure 3.03 - Range and average gas content from the Cherokee basin on as received basis (see Figure 5.02 for sample locations and type). Number of samples in parentheses. |
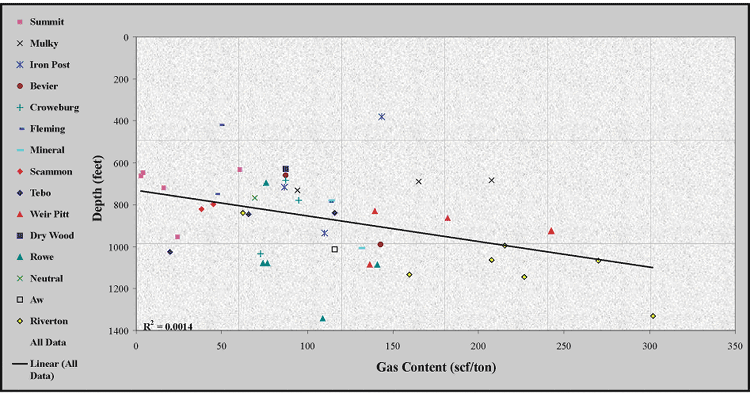 |
| Figure 3.04 - Gas content conducted on an as received basis, plotted as a function of depth for coal samples from the Cherokee basin (see Figure 3.02 for sample location and type). Plot shows a relationship of increasing gas content with depth. |
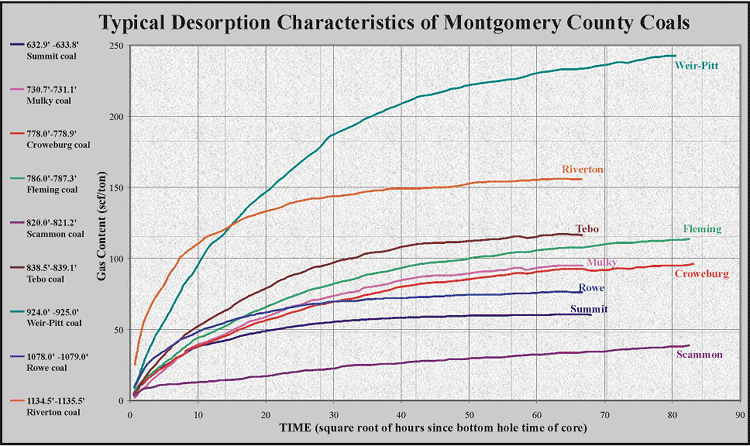 |
| Figure 3.05 - Typical desorption characteristics for coals sampled from a single well in Montgomery County, Kansas |
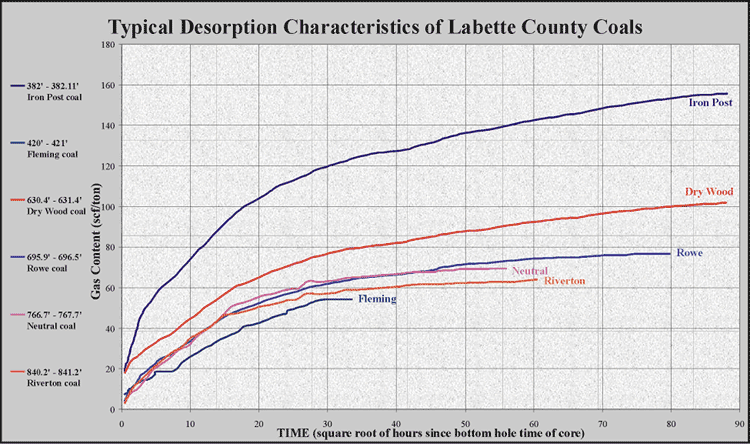 |
| Figure 3.06 - Typical desorption characteristics for coals sampled in the Cooper CW#1 well, 11-T35S-R18E, Labette County, Kansas |
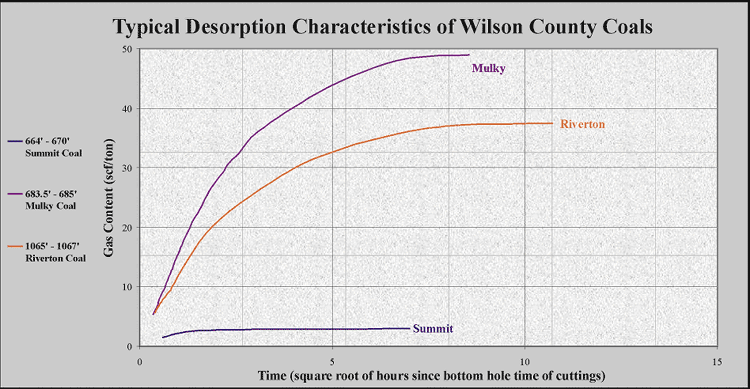 |
| Figure 3.07 - Typical desorption characteristics for coal cuttings from a single well sampled in Wilson County, Kansas. A correction of +25% was used when calculating desorbed gas contents of cutting samples. |
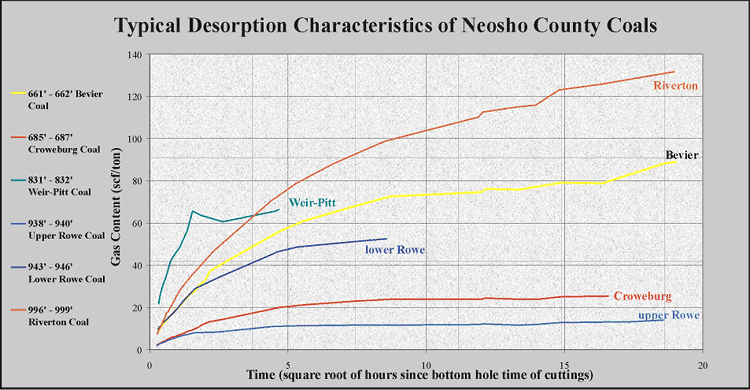 |
| Figure 3.08 - Typical desorption characteristics for coal cuttings from a single well sampled in Neosho County, Kansas. A correction of +25% was used when calculating desorbed gas contents of cutting samples. |
e-mail : webadmin@kgs.ku.edu
Last updated December 2003
http://www.kgs.ku.edu/PRS/publication/2003/ofr2003-82/chapter3_3.html