 |
|
Kansas Geological Survey Open-file Report 2003-82 |
1.6 Methodology
Data from the Kansas Geological Survey, including well logs, cores, and driller’s logs were used to generate structure and isopach maps, and cross sections to study the geographic variability and stratigraphic geometries of coals and related facies in the Cherokee Group. A subsurface geographic information system (GIS) program was used to digitally map the structure and thickness of the main lithologies and to build a series of regional sequence stratigraphic and structural cross sections. Cores were described and tied to well log response for a well-by-well analysis. Cores of coals were sampled and desorbed to determine total gas content. After termination of the desorption process, samples were selected for proximate and sulfur analyses.
1.6.1 Well Log Analysis
The bulk of the subsurface data available for this project are geophysical well logs. Logs from a total of 930 wells, with an average spacing of eight wells per township, were interpreted and correlated (Figure 1.07). Since neutron-density is the preferred logging tools for identification and evaluation of coal, all available neutron/density porosity logs were used. Due to the paucity of neutron/density logs, gamma ray/neutron logs (the dominant geophysical well logs within the study area), were used to broaden the aerial coverage. Gamma ray/neutron logs were found to have a distinct and correlatable response that could be used to identify lithologies and sequence stratigraphic packages and surfaces.
Cherokee Basin - Southeastern Kansas |
 |
 |
A combination of gamma ray and gamma ray/neutron porosity logs were used to identify coals and provide a qualitative evaluation. Low-ash coals, lacking naturally occurring radioactive elements, exhibit a low gamma-ray count, while high ash coals contain clay minerals that register a moderate gamma-ray count. The gamma ray/neutron tool is sensitive to both high-energy captive gamma rays and thermal neutrons. The response of the tool is primarily to the amount of hydrogen in the formation that is interpreted as porosity. The high hydrogen content of coals is reflected as a high apparent porosity on the neutron log since hydrogen is regarded as an indication of porosity (Table 1.1; Scholes and Johnston, 1993). Interpretations of coal seams were made using the coincidence of low gamma-ray deflections with higher neutron porosity deflections (Figure 1.08). In addition, stratigraphic position was helpful in recognizing coals. Many Kansas coals are located just below black phosphatic “core” shales with very high gamma radiation counts (Figure 1.08). Radioactive black “core” shales were used as marker beds to focus the evaluation of possible coal development.
Density and neutron/density porosity logs are the most dependable for coal identification, and were used to provide a guide to interpretation of the much more abundant gamma/ray neutron logs. Coals generally have a low matrix density (1.33 gm/cc) and density logs will read relatively low density, which translates to very high apparent porosity (Figure 1.09). With increasing ash content (eg., clay minerals), density will increase and apparent porosity will decrease (see Table 1.1; Scholes and Johnston, 1993).
 |
Figure 1.08 - Lithologic responses on a typical gamma-ray - neutron log from the Hinthorn CW#1 well 14=T32S-R16E. Coals are typically located beneath black phosphatic "core" shales with high gamma-ray counts (180-300 API units). Coals have relatively low gamma-ray counts (<100 API) and high apparent porosity resulting from the high hydrogen content measured by the gamma-ray/neutron log.
|
| Gamma Ray | Neutron | Density | Density Porosity | |
| Low Ash Coal | Low API |
High Porosity ~ 35 - 45 % |
Low Density < 1.75 g/cc |
High DPHI > 40 % |
| High Ash Coal | Moderate API ~ 75 - 105 API |
High Porosity <35 % |
Low Density < 2.0 g/cc |
High DPHI ~ 30 - 40 % |
| Table 1.1 Log responses for low and high ash coals from southeastern Kansas | ||||
During the 1910’s and 1920’s coal exploration and extraction companies drilled numerous shallow core holes primarily in Cherokee and Crawford counties to evaluate potential for mineable coal. To supplement the sparse coverage of oil and gas wells in the eastern part of the study area, approximately 150 driller’s logs from shallow borings were examined (Figure 1.07). Drillers logs from shallow borings were tied to outcrop maps and wells logs in order to better interpret the lithologies and stratigraphic position. The shallow borings provided a link between the stratigraphy from the deeper oil and gas wells and the surface stratigraphy in extreme eastern Cherokee and Crawford counties.
1.6.2 Lithologic Analysis
To supplement sparse natural outcrops and coal mines in the study area, two surface-to-total-depth cores were drilled and logged by the Kansas Geological Survey (KGS). The KGS core holes provide sedimentological, stratigraphic, and coal quality information. A total of two cores (KGS), representing the entire Fort Scott Formation and Cherokee Group, were described. Detailed descriptions of cores are in Appendix One. Another previously described core, the P&M core #20 (SE NE NE, sec.8-T23S-R22E) was reviewed and compared against the other two cores (description in Harris, 1984). Cores were examined for lithology, color, texture, cement(s), bedding, sedimentary structures, and fossil content.
Selected intervals of the core were slabbed and polished due to their brittle nature in order to better study and identify sedimentary features and fossil content. Underclays were slabbed by placing them in cardboard mailing tubes cut to length and filled with casting resin. Once the resin set up, the underclay sample was slabbed and described.
During the drilling process, cores of coals were measured and photographed before quickly placing the coals in pressurized canisters to determine gas content. Following termination of gas release, the coals were decanistered, examined for mineral and cleating development, and crushed for proximal analysis.
 |
| Figure 1.09 - Lithological responses on a typical gamma-ray - neutron density porosity log from southeastern Kansas. Coals have relatively low gamma-ray counts in combination with very high apparent porosity (low density). Apparent porosity in many typical coals exceeds 30 percent. |
1.6.3 Computer Applications
A subsurface geographical information system (PETRA) was used to map the structure and thickness of the main stratigraphic units along with constructing regional sequence stratigraphic and structural cross sections. A digital dataset project, consisting of a series of spreadsheets (Microsoft Excel), was built through custom queries to the KGS relational database management system using Microsoft Access 2000 to generate special query language (SQL). Data selected includes general well data (eg., well name, location, elevation), producing formation, formation tops, and production for coalbed methane wells. In order to map the main lithologies and build cross sections over the study area, paper logs were selected and scanned (Neurolog scanner). Raster images of the logs were calibrated and imported into a GIS workstation for lithologic analysis. Spreadsheets were used to record and analyze all coal desorption data such as the volume, time, temperature, and barometric pressure of each measurement. Desorbed gas was summed over the time period for which the coal samples evolved all of their gas. All data generated or modified as part of this study, including horizon tops, raster wells images and identification of coalbed methane wells was uploaded into the Kansas Geological Survey’s online databases.
1.6.4 Desorption Method
In cooperation with local independent oil and gas companies, cuttings and core samples of coals were obtained from wells within the major areas of coalbed methane exploration and production. Additional coal core samples were obtained by the Kansas Geological Survey’s core drilling operations (Figure 1.10). Dave Newell and I collected and placed coal samples in desorption canisters immediately following extraction from the well bore (Figure 1.11). Cutting samples were caught with a kitchen strainer at the end of the buoy line. Core samples were obtained and quickly moved from the boring to the surface by use of a wire-line core barrel.
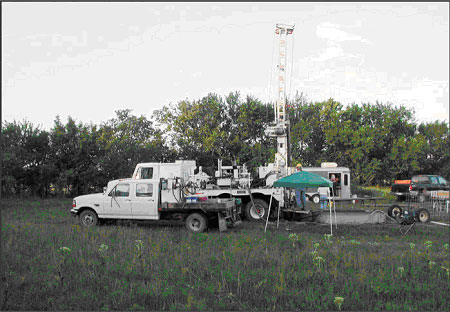 |
| Figure 1.10 - Kansas Geological Survey's core drilling operations |
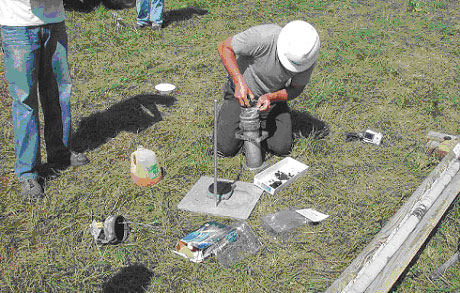 |
| Figure 1.11 Collection and canistering of coal core samples |
Desorption canisters were made at the KGS, using PVC pipe and plumbing materials available at hardware stores, or purchased commercially (SSD, Inc. in Grand Junction, CO). On average, the canisters were approximately 12.5 inches long (32 cm), 3 1/2 inches (9 cm) in diameter, and enclosed a volume of approximately 150 cubic inches (2450 cm3; Figure 1.12).
Standard methods and equipment were used for measuring desorbed gas (McLennan et al., 1995). I measured evolved gas with a volumetric displacement apparatus, consisting of a set of connected dispensing burettes, one of which measures the gas evolved from the desorption canister. The other burette compensates for the compression effects that occur when the desorbed gas displaces the water in the measuring burette (Figure 1.12). The amount of gas evolved is determined by first adjusting the water levels in the two cylinders to the same level, then after releasing the gas from the desorption canister, reading the difference in water level using the volumetric scale on the side of the burette.
Desorbed gas collected in the desorption canisters was periodically released into the volumetric displacement apparatus and measured as a function of time, temperature and atmospheric pressure. Ideally, original temperature at the formation depth should be maintained for the period of desorption. To control temperature, desorption samples were placed in isothermal baths immediately after being canistered. Isothermal baths were constructed using plastic and Styrofoam coolers filled with water. For measurements in the field, original formation temperature was maintained using ice, or water heated either by an aquarium heater and/or boiling pot.
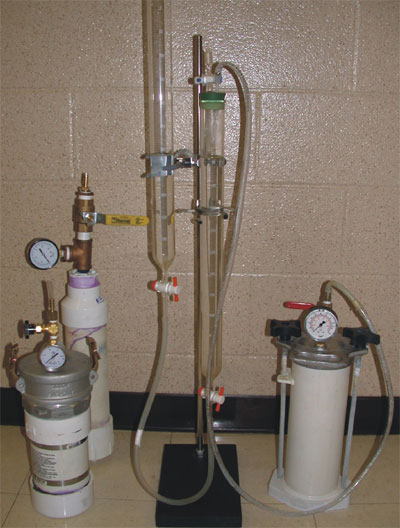 |
| Figure 1.12 - Desorption apparatus and canisters |
For measurements in the lab, water was heated with aquarium heaters and circulated
with aquarium pumps for formation temperatures greater than 70 °F. For
temperatures less than 70 °F, the samples were kept in a room with an
ambient temperature varying from 65 to 68 °F.
I measured time and atmospheric pressure in the field and laboratory using
a portable weather station (Oregon Scientific, model BA928). The atmospheric
pressure was measured in millibars. However, this measurement was not the
actual barometric pressure, but rather an altitude-compensated barometric
pressure, automatically converted to a sea-level-equivalent pressure within
the instrument. In order to translate this measurement to actual atmospheric
pressure, a regression correlation was determined by recording and comparing
barometric readings displayed from a pressure transducer in the Petrophysics
Laboratory in the Kansas Geological Survey in Lawrence, Kansas. The regression
equation, corrected the millibar reading to barometric pressure.
Barometric pressure for the desorption measurements was used in a spreadsheet (written by K.D. Newell, Kansas Geological Survey) to determine gas volumes at standard temperature and pressure. Conversion of gas volumes to standard temperature and pressure was applied by the ideal-gas equation (Equation 1).
n = PV/RT (1)
where n is moles of gas, T is degrees Kelvin (i.e., absolute temperature), V is in liters, and R is the universal gas constant, which has a numerical value depending on the units in which it is measured (for example, in the metric system R = 0.0820 liter atmosphere per degree mole). The number of moles of gas (i.e., the value n) is constant in a volumetric conversion. Therefore the conversion equation is derived from the ideal gas equation (Equation 2).
(PstpVstp)/(RTstp) = (PobsVobs)/(Robs) (2)
Customarily, standard temperature and pressure for gas volumetric measurements in the oil industry are 60° F and 14.7 psi (Dake, 1978). Pstp, Vstp, and Tstp, respectively, are pressure, volume and temperature at standard temperature and pressure, where standard temperature is degrees Rankine (° R = 460 + ° F). Pobs, Vobs, and Tobs, respectively, are ambient pressure, volume and temperature measurements observed on well site or in the desorption laboratory.
Universal gas constant R drops out as this equation is simplified and the determination of Vstp becomes (Equation 3):
Vstp = (Tstp/Tobs) (Pobs/Pstp) Vobs (3)
Conversion calculations in the spreadsheet were carried out in the english-metric system, as this is the standard measure system used in U.S. coal and oil industry. V is therefore converted to cubic feet; P is psia; T is ° R.
Desorbed gas was summed over the time period for which the coal samples continued to evolve gas. In the case of cores, this time could be six or more months. Cuttings desorbed faster, typically in a matter of days or weeks. Lost gas (i.e., the gas lost from the sample from the time it was drilled, brought to the surface, to time of canistering) was determined using the direct method (Kissel et al., 1975; McLennan et al., 1995). Cumulative gas evolved is plotted against the square root of elapsed time. I carefully recorded time zero during drilling operations and assumed it be the instant the core sample is lifted from the bottom of the hole, or in the case of cuttings, when the drilled rock is cut and circulated off bottom. Characteristically, the cumulative gas evolved from the sample, when plotted against the square root of time, is linear for a short time period after the sample reaches ambient pressure conditions. As a result, lost gas can be estimated by a line projected back to time zero. The period of linearity generally is 4 to 6 hours for a core sample, and less than an hour for cuttings samples.
The termination of evolved gas was defined as two consecutive weeks of zero volume of desorbed gas. After termination of gas evolution, the canisters were opened and coal samples were removed. Samples were weighed for their wet weight and allowed to dry for one to two weeks. At the end of the drying period, samples were weighed again to obtain dry weight. A portion of the dry coal sample was crushed and sent to a commercial laboratory to determine moisture, ash, sulfur, calorific value (BTU), fixed carbon, and volatile matter (Luman’s Laboratories).
e-mail : webadmin@kgs.ku.edu
Last updated January 2004
http://www.kgs.ku.edu/PRS/publication/2003/ofr2003-82/chapter1-6.html