 |
2001 Kansas Oil & Gas
|
Kansas Geological Survey Open-file Report 2002-38 |
Impact on Tax Revenue
Oil and gas production comprises a very significant part of state and local tax revenues. It is difficult to estimate tax revenue from personnel and corporate income taxes, sales tax on equipment and materials, property taxes on pipelines and other equipment, and income taxes and royalty income. Based on wellhead value, royalty income can be estimated to be more than $300 million. It is possible to provide figures on mineral severance tax and mineral leasehold property tax revenues (Table 4 and Figure 6. In calendar 2001, these two documented components provided over $200 million to state and local tax revenues. Again this grossly understates the contribution to Kansas government revenues. However, it is evident that state and local tax revenues on oil and gas operations can fluctuate by more than 30% on an annual basis. Based on comparison of severance tax revenue from fiscal years 2001 and 2002, it is estimated that while historical healthy tax revenues from oil and gas operations have decreased significantly (Figure 6).
Year |
Severance Tax $Thousand |
Mineral Leasehold Assessed Value (at 25-30%) $Thousand |
Mineral Leasehold Property Tax $Thousand |
Annual Change in Tax Revenues Property
& Severance |
| 1998 | $51,686 |
$1,454,822 |
$103,552 |
|
| 1999 | $43,985 |
$986,269 |
$76,320 |
-22.5% |
| 2000 | $70,433 |
$936,816 |
$83,015 |
+27.5% |
| 2001 | $90,377 |
$1,361,579 |
$115,393 |
+34.1% |
Table 4 – Assessed value of mineral leasehold and ad valorum tax revenues from Kansas Department of Revenue, Division of Property Valuation (http://www.ksrevenue.org/pvd/pvdcountystateinfo.html). Severance tax revenue from Kansas Department of Administration, Division of Accounts and Reports restated in calendar years (http://da.state.ks.us/ar/finrept/mfp.htm).
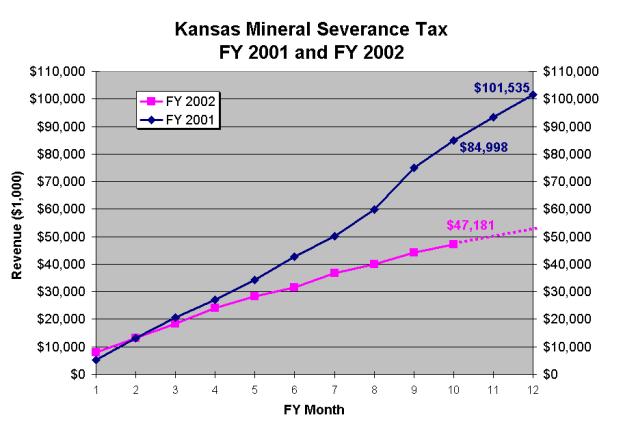
Figure 6 - Cumulative severance tax revenue for fiscal years FY2001 and FY2002. Severance tax revenue for FY2002 is available through April. Estimated total revenue for FY2002 is $52.5 million. The year-to-year decrease in revenue of approximately $50 million is a result of decrease from the abnormal spike in gas prices during the winter of 2000-2001 (See Figure 4).
|
|
e-mail : webadmin@kgs.ku.edu
Last updated August 2002
http://www.kgs.ku.edu/PRS/publication/ofr2002-38/P3-07.html