Kansas Geological Survey, Open File Report 96-50
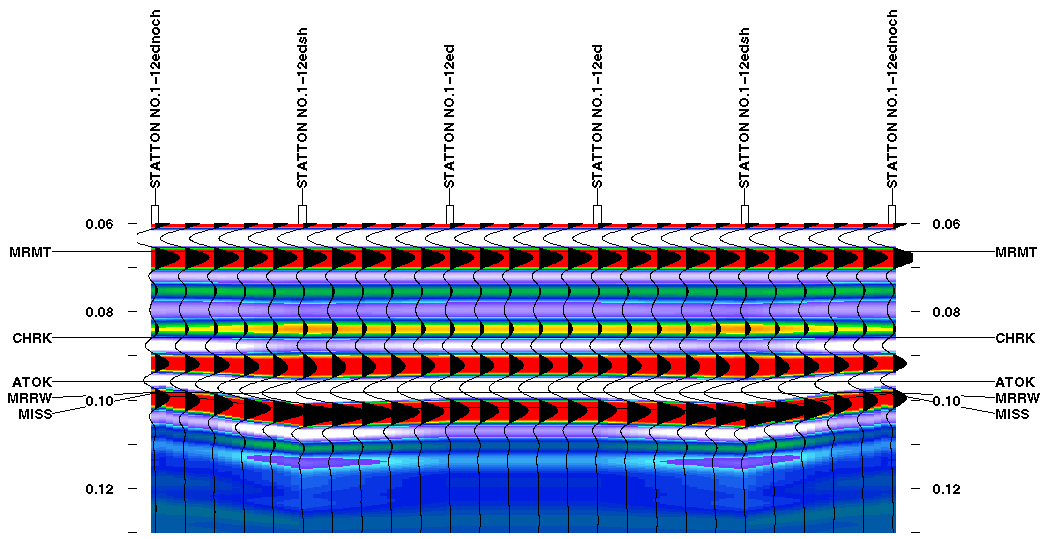
Figure 6a--Single well, higher resolution seismic model. Colors represent seismic amplitude. Vertical scale in seconds of two-way travel time from the top of the model. Abbreviations same as Figure 4a. A black and white verion of this plot is available.

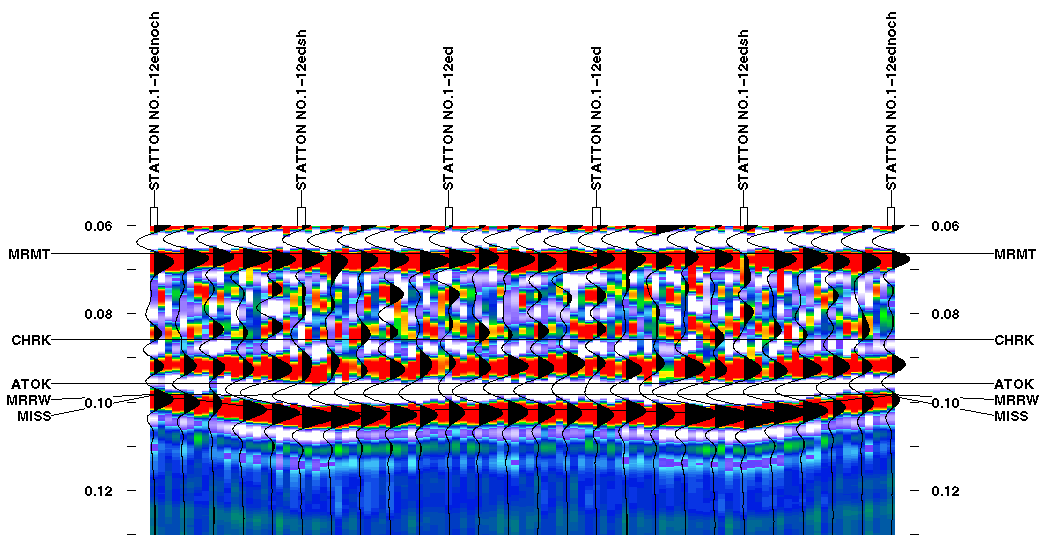
Figure 6b--Same as Figure 6a with random noise added. A black and white verion of this plot is available.

The isochron anomaly associated with the channel (anomaly 1) is still pronounced. However, this anomaly is probably best measured between a peak that develops in the middle of the Cherokee section and the peak associated with the top of the Mississippian. Because of the broader bandwidth of the higher resolution model, changes in this isochron interval more accurately indicate changes in channel thickness.
Development of an extra peak between the Marmaton and Mississippian reflections over the channel (anomaly 2) does not occur in the higher resolution model like it does in the lower resolution model. This is because several other reflections already occur between Marmaton and Mississippian reflections due to the broader bandwidth wavelet, and destructive interference due to thinning of the Morrow interval from 21 ft. (6.4 m.) to 2 ft. (0.6 m.) is not enough to eliminate any of them. Although the lack of the extra peak over the channel might make identification of a channel more difficult, once the channel is identified, it would make the interval easier to isochron because the reflections corresponding to the isochron interval would extend across the entire area (channel or not) and would not be affected as much by thickness and lithology changes outside the area of interest.
Amplitude variations associated with the channel (anomaly 3) also occur on the higher resolution model. However, the change in reflection strength is not quite as pronounced as it is in the lower-resolution model. This is probably due to less destructive interference between reflections as the channel fill thickness decreases in the higher resolution model. Although the amplitude variation is less, it is probably less affected by changes outside the area of interest than the lower resolution model is.
Differences in the seismic signature between the shale-filled Morrow-Mississippian interval and the part of the channel that contains the sandstone are similar on both the higher and lower resolution models. In the higher resolution model, the Mississippian peak and trough above it increase in amplitude as the sandstone is replaced by shale. It is also interesting to note that the amplitude of the Mississippian reflection and trough above are only slightly greater in the part of the channel that contains the sandstone than they are where there is no channel, even though the isochron interval between the peaks on either side of the trough increases over the channel. This indicates that for a given isochron thickening indicative of a channel on higher resolution seismic data, a dramatic increase in the amplitude of the Mississippian reflection and trough above would be more indicative of a shale filled section, whereas a slight increase in amplitude would be more indicative of a moderately thick, higher velocity sandstone in the channel interval.
As with the lower resolution model, addition of 10% random noise to the higher resolution model (Fig. 6b) makes interpretation of the channel anomalies more difficult. However, due to the broader bandwidth of the higher resolution model, the central peak amplitude of the higher resolution wavelet is greater than that of the lower resolution wavelet. This results in a higher resolution section that appears to be affected less by random noise than the lower resolution section. Overall, the higher resolution model with noise added (Fig. 6b) looks very similar to the model without noise (Fig. 6a). Both the isochron and amplitude anomalies associated with the channel are still present, as well as the sandstone versus shale anomalies. In actual data though, attenuation of the higher frequencies may result in higher noise levels in the high frequency end as the higher frequency amplitudes are increased to balance out the section. With acquisition parameters designed to enhance the amplitude of the higher frequencies in the signal, this effect may be minimized.