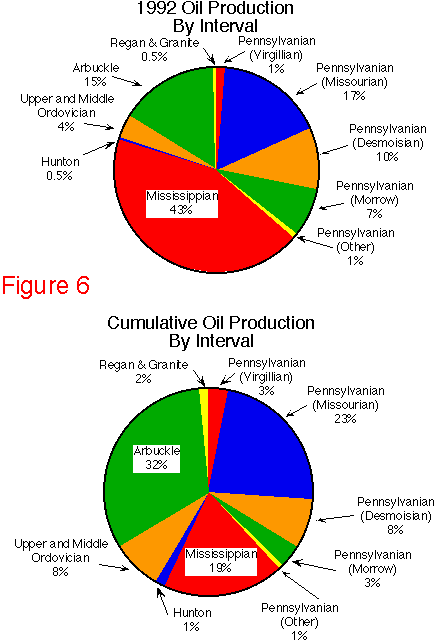
Figure 6--Kansas Production of Oil and Gas.

A look at the stratigraphic distribution of oil production in 1992 shows a decrease in the dominance of oil production from the Arbuckle interval. The percentage of both Mississippian and Morrow oil production has doubled, while the contribution of Arbuckle production has halved. Together the Mississippian and the Morrow intervals accounted for approximately 50 percent of the oil produced in the state during 1992. This change in the stratigraphic distribution of oil production is the result of a number of new Morrow and Mississippian fields and extensions in the Hugoton embayment of southwestern Kansas. This trend has continued, oil production from the 13 counties of southwestern Kansas now accounts for over 20% of the states production (XXX).
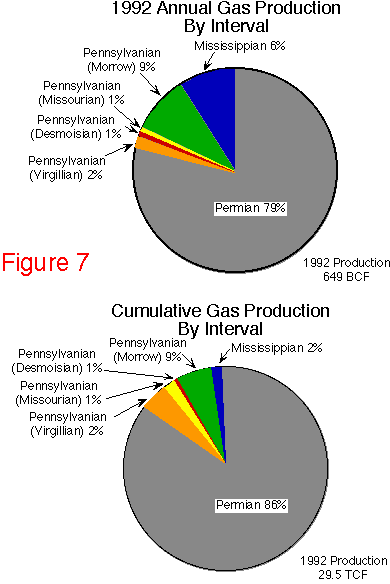
Gas production on both a cumulative and an annual basis is dominated by the Permian interval. Over 86% of the cumulative 30 TCF and 80% of the annual gas production comes from the Permian (primarily Chase and Council Grove groups; (Figure 7). Two fields located in southwestern Kansas, the Hugoton (Chase Group) and the Panoma (Council Grove Group), account for 60% and 16% of the state's 1993 annual production. However, gas production as percentage of annual production from both the Morrow and Mississippian intervals has increased significantly as compared to the percentage of cumulative production. As with oil this increase in the percentage of Mississippian and Morrow gas production reflects exploration beneath and around the margins of the Hugoton embayment.
Figure 7--Gas production by stratigraphic interval.
