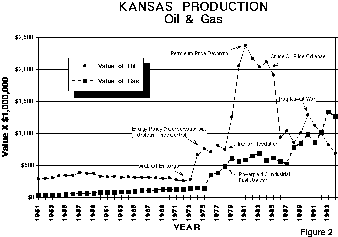
Figure 2--Value of Kansas Oil and Gas. A larger version of this figure is available (full version 12k).
Figure 3--Kansas Production of Oil and Gas. A larger version of this figure is available (full version 12k).
In 1993 and 1994, Kansas oil production continued to decrease while gas continued to increase (Figure 3). Wellhead prices for both oil and gas decreased. This combination had an obvious effect of increasing the difference in value between oil and gas to over 500 million dollars. In 1994 the value of gas production in Kansas is approximately double the value of the oil produced.
An examination of the historical record shows the effects of changes in government policy and perturbations in global supply on oil and gas production in Kansas (Figure 2 and Figure 3). Kansas oil production peaked in 1956 at over 124 million barrels per year, and has declined at an average annual rate of 2.5% to the present production of just under 47 million barrels per year. The oil boom of the early 80's and a modest increase in 1991 appear as anomalies to this long term trend. These anomalies are related to supply disruptions (e.g., the Arab oil embargo, the Iranian revolution and the Iraq-Kuwait war), and are evident in both the value and quantity of oil production. The decline rate resumed in the 90's and appears to be very similar to that of the 60's.
As discussed in earlier report's, government policies have also affected Kansas oil and gas production (e.g., the Energy Petroleum Allocation Act of 1973, the Energy Policy and Conservation Act of 1975, the Power plant and Industrial Fuel Use Act of 1978 and the Price and Allocation Decontrol in 1981). The dramatic decrease in gas production during the 70's from 900 BCF per year to less than 450 BCF per year appears to be directly related to market distortions resulting from federal government policies. Subsequent decontrol in 1981 of prices, allocations, and uses of fuels permitted fuel switching based on economic criteria, and appear to have contributed to the recovery of Kansas gas production to its present rate of more than 700 BCF per year (Figure 3).
State policy also can have an effect on oil and gas production as illustrated by gas production from the Hugoton Field and oil production from the same area (Figure 4 and Figure 5). In 1988, the Kansas Corporation Commission's (KCC) modified spacing rules in the Hugoton field. The effect of the rule change allowing infill is evident in an increase in both the numbers of wells and gas production from the Hugoton Field (Figure 4).
Figure 4--Gas production and number of wells in the Hugoton Gas Area. A larger version of this figure is available (full version 24k).
The decrease in severance tax on gas production enacted by the state began in 1994 and should have a positive impact on continued gas production. The drilling of infill gas well opened up the possibility of relatively low-cost exploration tails to explore for oil production beneath the Hugoton Gas field. This coupled with the "Deep Horizons Bill" that opened the "deep Hugoton" to exploration has lead to the doubling of oil production from southwest Kansas (Figure 5). The 13 southwest counties now produce over 10 million barrels of the states 47 million barrels of oil. This increased oil production in the Hugoton area is in stark contrast to the overall statewide decrease in oil production and runs against the negative affect of the decrease of oil prices.
Figure 5--Kansas vs. Hugoton oil production. A larger version of this figure is available (full version 12k).