http://www.kgs.ku.edu/PRS/publication/2006/OFR06_06.html/p2-03.html
Last Modified April 2006
|
Carbonate Lithofacies Prediction Using Neural Network and Geostatistical 3D Modeling of Oolite Shoals, St. Louis Limestone, Southwest Kansas |
Kansas Geological Survey KGS Open-file 2006-04 |
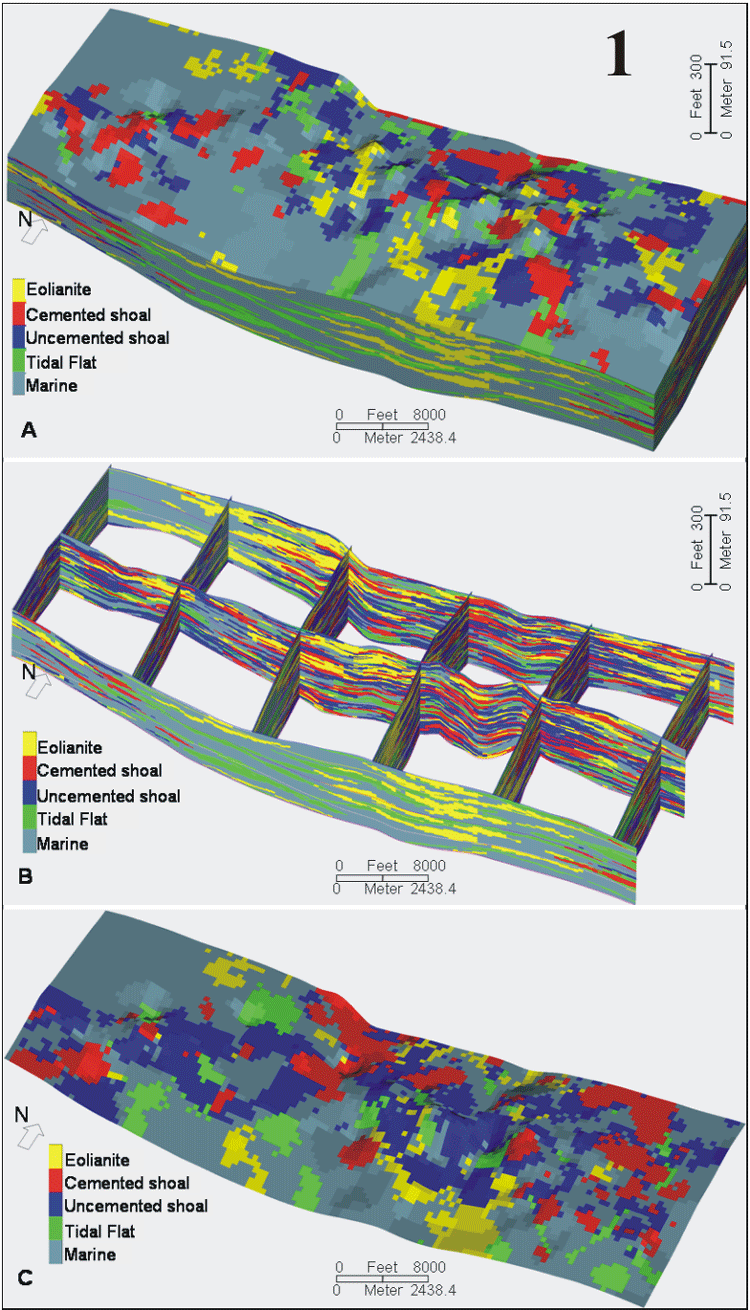
1 - A) Stochastic facies model using object-based simulation, St. Louis Limestone. B) Three-dimensional cut slices at X axis (1, 26, 51, 76, 101, 126) and Y axis (1, 22, 43); C) Top view of St. Louis B zone, layer = 38. Vertical exaggeration is 40.
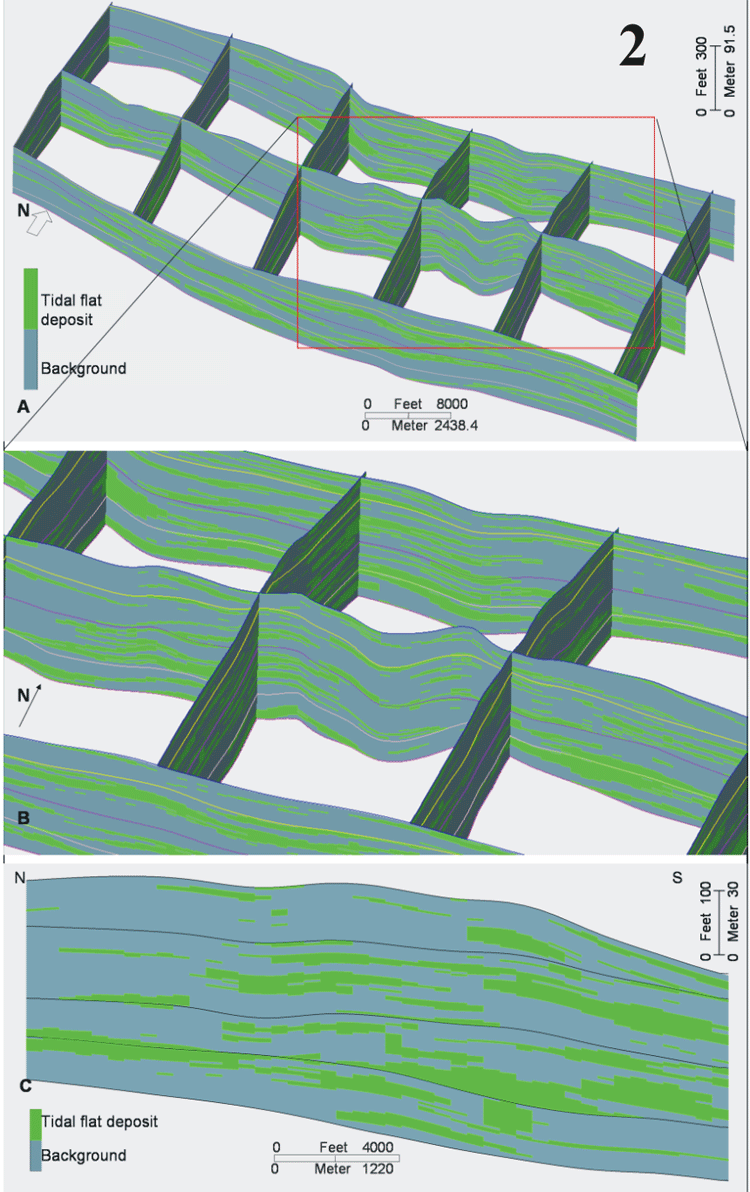
2 - A) Stochastic simulation of distribution of tidal flat facies in the St. Louis Limestone; B) Zoom-in view showing detailed distribution of tidal flat facies; C) The cross section at X=122. The modeled tidal flat deposit occurs as relatively thin layers that are more laterally persistent than other two facies. The content of tidal flat deposit decreases from the bottom to the top within each zone, which may indicate of transgression and then agradation of shallow marine facies. Tidal flats preferentially accumulate in the structure lows. Three-dimensional fence diagram at X axis (1, 26, 51, 76, 101, 126) and Y axis (1, 22, 43). Vertical exaggeration is 40.
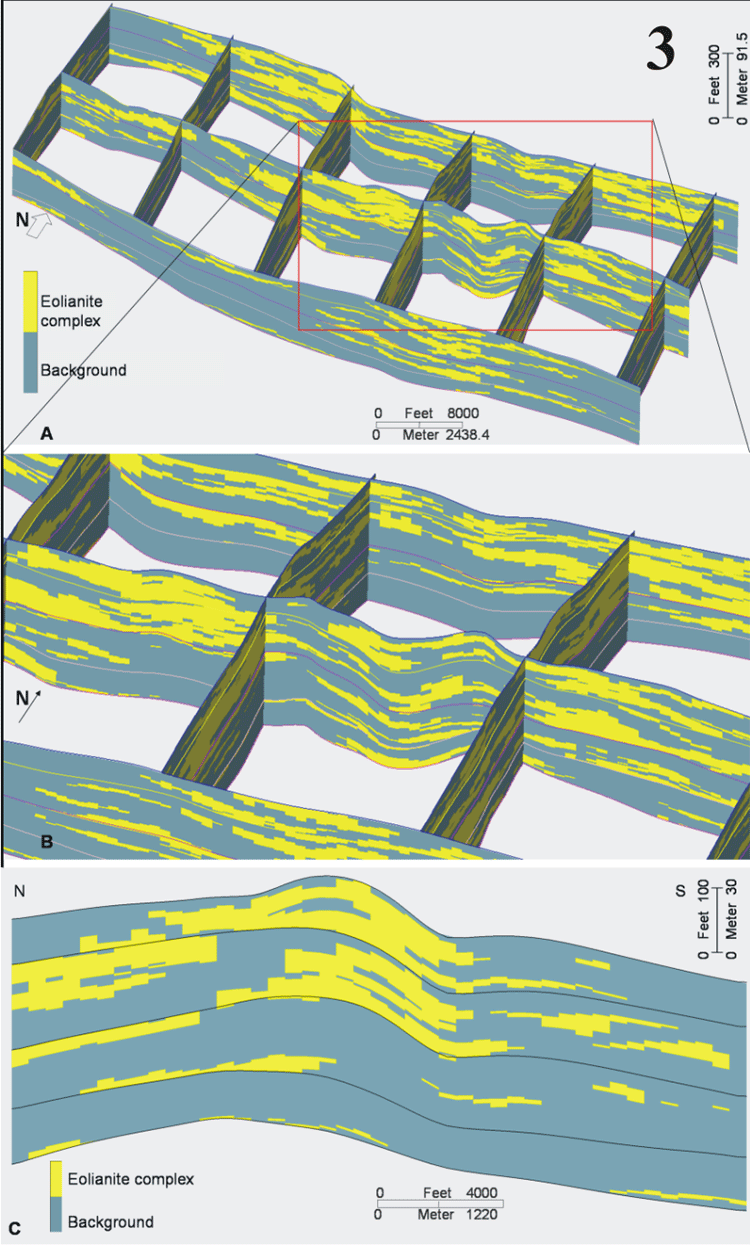
3 - A) Stochastic simulation of distribution of eolianite deposits of St. Louis Limestone; B) Zoom-in view showing the detailed distribution pattern of eolianite deposits; C) The cross section at X=63. The content of eolianite complexes increases from the zone D through zone A. Eolianite deposits show a back-stepping pattern. Three-dimensional fence diagram at X axis (1, 26, 51, 76, 101, 126) and Y axis (1, 22, 43). Vertical exaggeration is 40.
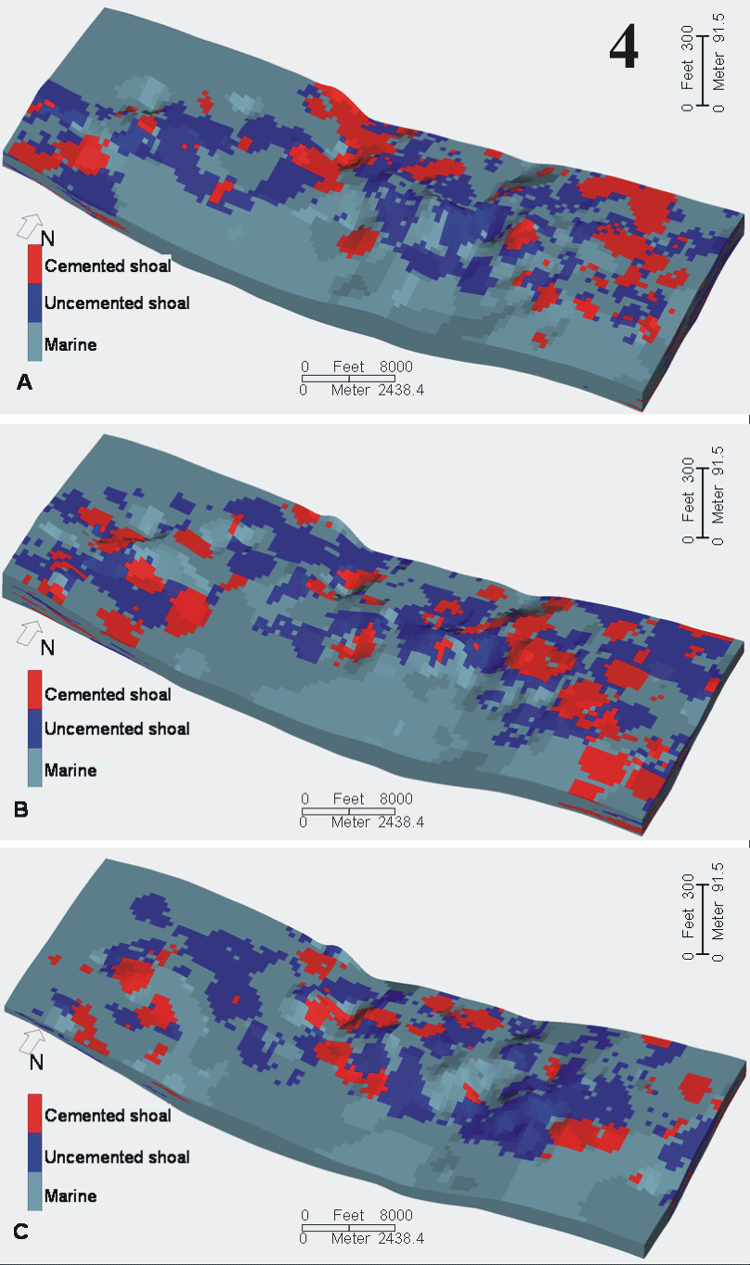
4 - A) Stochastic facies model of oolitic deposit complex and cemented oolitic deposits of zone B, St. Louis Limestone; B) Stochastic facies model of oolitic deposit complex and cemented oolitic deposits of zone C, St. Louis Limestone; C) Stochastic facies model of oolitic deposit complex and cemented oolitic deposits of zone D, St. Louis Limestone. Oolitic deposits accumulate on the local highs surrounding the embayment. Vertical exaggeration is 40.
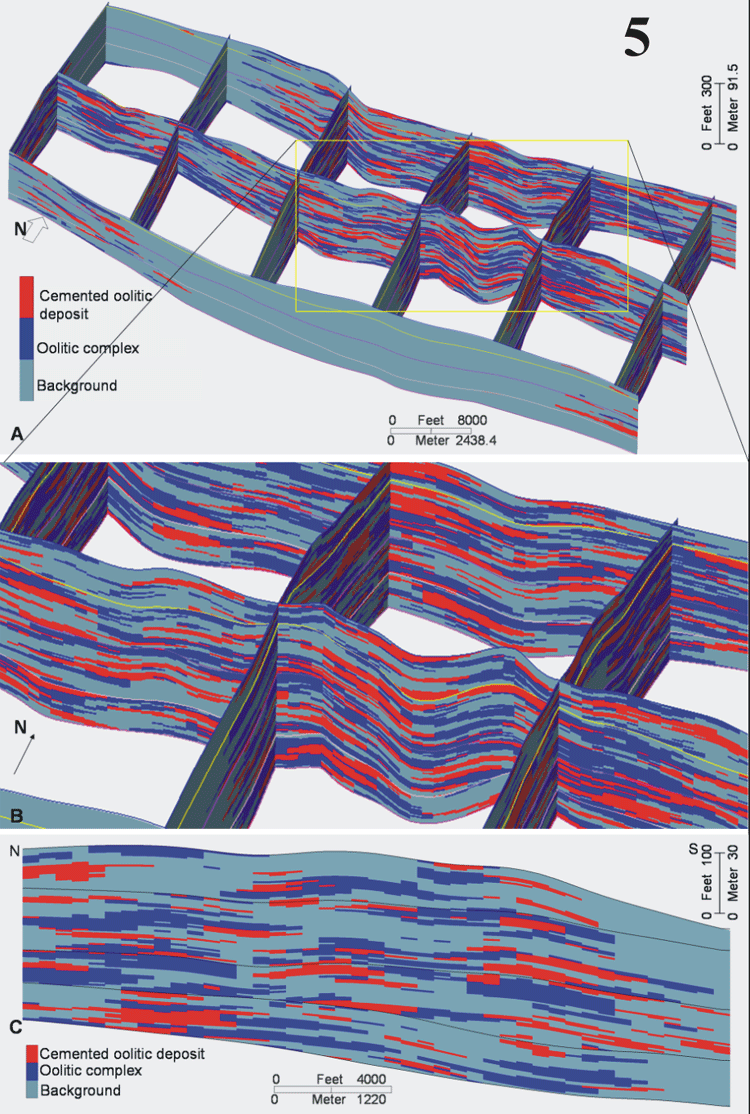
5 - A) Stochastic simulation of distribution of ooid deposit complexes (lithofacies 5 and 6) and cemented oolitic deposits (lithofacies 6) of St. Louis Limestone. Oolitic complexes show an agradational pattern accumulating along the edge of the deeper embayment in south; B) Zoom-in views showing detailed distribution pattern of cemented oolitic deposits (red) within the oolitic complexes (blue); C) The cross section at X=122, showing that cementation of oolitic deposits tends to occur at the edges of shoal complexes. Shoal complexes are largely absent on the high in the northwest corner of the study area and in the deeper parts of the study area to the south. Oolitic complexes display a progradational pattern within each zone. Three-dimensional fence diagram at X axis (1, 26, 51, 76, 101, 126) and Y axis (1, 22, 43). Vertical exaggeration is 40.
http://www.kgs.ku.edu/PRS/publication/2006/OFR06_06.html/p2-03.html
Last Modified April 2006