http://www.kgs.ku.edu/PRS/publication/2006/OFR06_06.html/p2-02.html
Last Modified April 2006
|
Carbonate Lithofacies Prediction Using Neural Network and Geostatistical 3D Modeling of Oolite Shoals, St. Louis Limestone, Southwest Kansas |
Kansas Geological Survey KGS Open-file 2006-04 |
 |
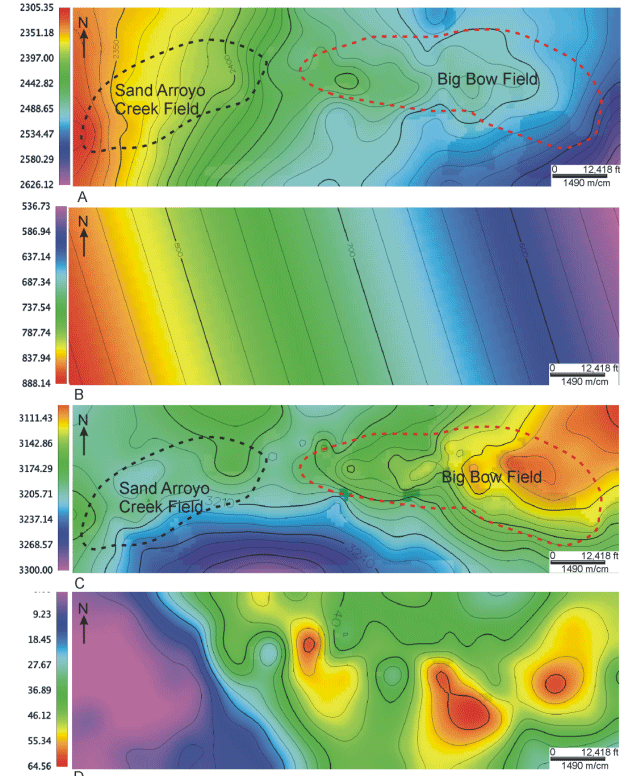 |
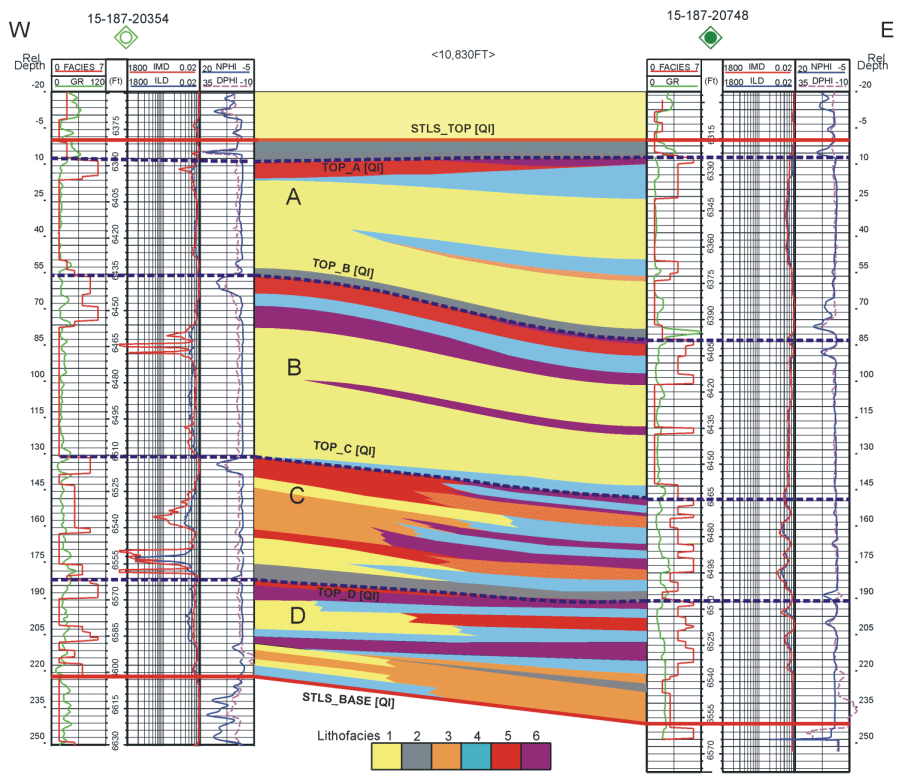
| Color-filled cross section of interpolated lithofacies between well L. E. Nordling 1 and Federal Land Bank 5-21 with predicted lithofacies curves. Quartz-rich carbonate grainstone (lithofacies 1) dominates in the St. Louis A and B zones. Ooid grainstone (lithofacies 5) defines informal reservoir intervals “A” through “D”. Predicted lithofacies curves were integrated with log marker and patterns to correlate St. Louis Limestone zone tops. Interpreted flooding surfaces shown as dashed lines. Facies distribution between wells based on simple 2D interpolation. | A) Structural map of St. Louis Limestone, constructed from wells surrounding Big Bow and Sand Arroyo Creek fields. Outlines of Big Bow and Sand Arroyo Creek are shown. B) Structural map of Fort Riley Limestone, showing the regional tilting effect of the Laramide Orogeny. C) Restored structural map of St. Louis Limestone constructed after removing the tilting effect of the Laramide Orogeny. Outlines of Big Bow and Sand Arroyo Creek are shown. D) Isopach map of St. Louis Limestone calculated from original structural top and base surfaces of St. Louis Limestone. |
Click on above images to show more detail
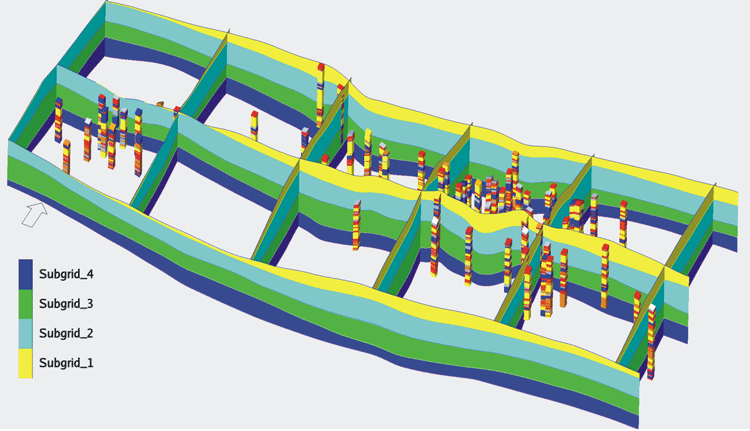
Three-dimensional fence diagram through the modeling grid at X axis (1, 26, 51, 76, 101, 126) and Y axis (1, 22, 43), showing four subgrids with the blocked wells. Facies curves are displayed on the wells. Vertical exaggeration is 40.
http://www.kgs.ku.edu/PRS/publication/2006/OFR06_06.html/p2-02.html
Last Modified April 2006