Acoustic Impedance Interpretation
- Average acoustic impedance has been extracted from the model-based inversion volume for the interval between the top and base of the Spergen. (The positions of the top and base of the Spergen in the seismic data volume have been approximated using the BMS/KYS horizon and isochron maps calculated from isopach maps and interval velocities from wells with sonic logs.)
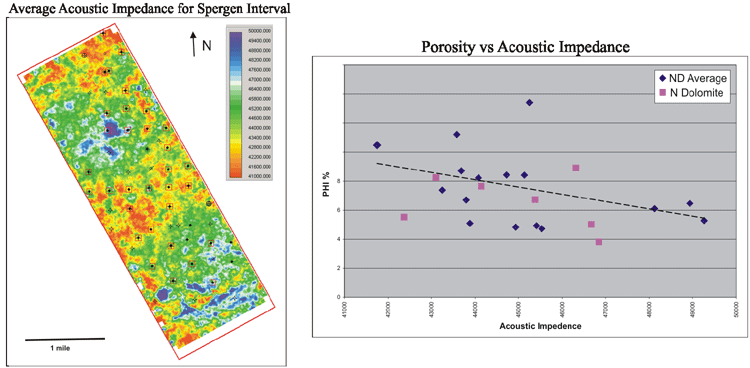
- The Spergen acoustic impedance map shows spatial variation with broad NE trending bands of high and low impedance.
- Acoustic impedance may be an indicator of porosity variations.
- The crossplot of acoustic impedance and average Spergen porosity shows considerable scatter, but in general, higher acoustic impedance corresponds to lower porosity.
http://www.kgs.ku.edu/PRS/publication/2006/2006-14/p3-04.html
Last Modified May 2006