Log Petrophysical Analysis
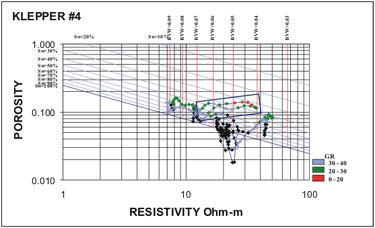
A modified Pickett crossplot (PfEFFER) was used to analyze patterns in porosity, resistivity, and saturation in the reservoir. Each data point on these plots represents a half-foot interval and points are linked together in sequence by depth to reveal trends through the reservoir. From the Archie relations, saturation contours and bulk volume water contours are superimposed. Details of the methodology in using the modified Pickett plots are described in Doveton et al. (1996).
Inputs - wireline log resistivity and porosity, water salinity, Archie parameters (m and n). Porosity, BVW, and permeability cut-offs were used to identify the net pay at each well.
Archie Parameters and cut-offs:

Pickett plot analysis results are consistent with the three intervals of Spergen (A, B, and C) observed in logs. PfEFFER also locates potential bypassed pay within the wells for which the analysis has been completed.
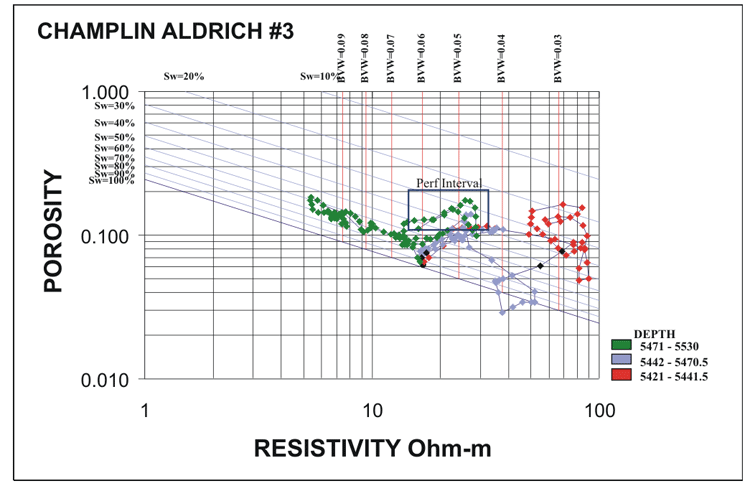
Pickett Plot for Spergen Interval A (red), B (blue) and C (green).
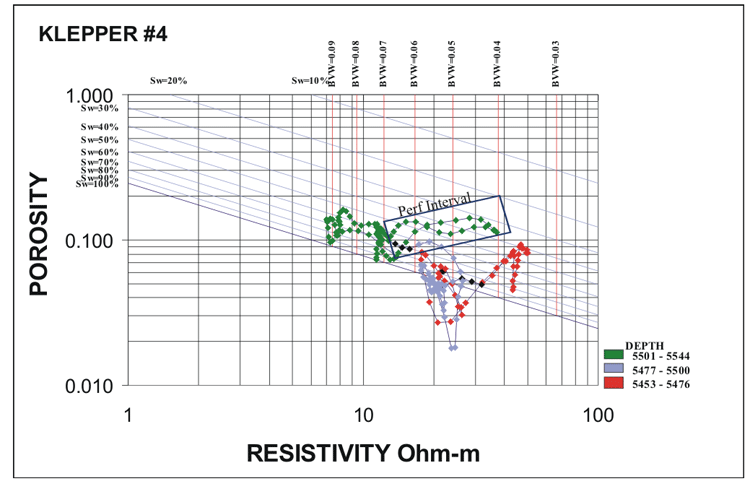
Pickett Plot for Spergen Interval A (red), B(blue) and C (green).
 |
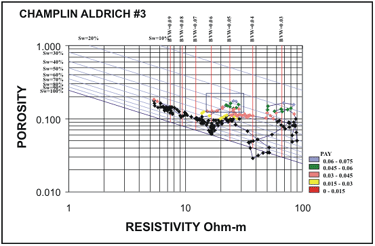 |
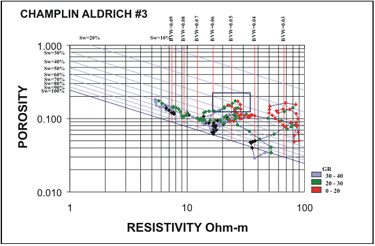
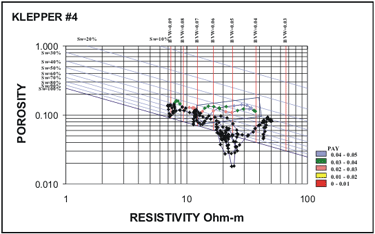
| Pickett Plot illustrating ranges of Gamma Ray values: 0-20 (red), 20-30 (green), 30-40 (blue), >40 (black). | Pickett Plot illustrating ranges of Net Pay Feet based on the formula: Thickness (0.5 ft.)*Phi*(1-Sw). |
 |
 |
| Pickett Plot illustrating ranges of Gamma Ray values: 0-20 (red), 20-30 (green), 30-40 (blue), >40 (black). | Pickett Plot illustrating ranges of Net Pay Feet based on the formula: Thickness (0.5 ft.)*Phi*(1-Sw). |
http://www.kgs.ku.edu/PRS/publication/2006/2006-14/p3-02.html
Last Modified May 2006