Core to Log Comparison
Composition Graph
We use an Excel spreadsheet to set up the matrix
algebra solution for compositional analysis. The
MINVERSE function within Excel is used to
perform the operation through inversion of the
matrix of the log properties of the components.
The logs used in the composition analysis are:
Gamma Ray, Neutron Porosity (percent), Bulk
Density, and Photoelectric Volumetric Cross
Section. By premultiplying the logs by this inverse
matrix, we can determine the percentage of
calcite, dolomite, quartz, shale, and porosity.
- Mineral compositions estimated from the logs show good concordance with lithologies described from core.
- The composition graph is a useful quantitiative representation of lithofacies, porosity, and amount of dolomitization observed within each core.
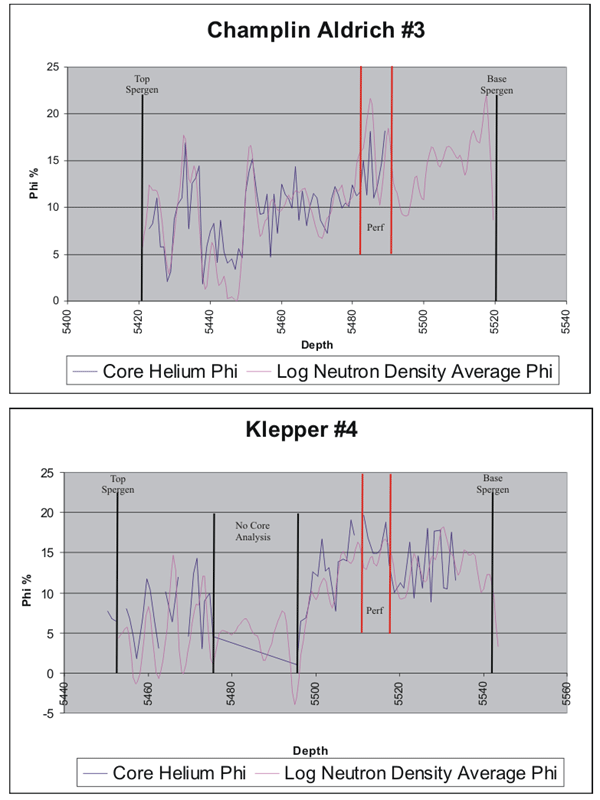
- Porosity computed from average neutron-density porosity logs shows a fair correlation with porosity measured in core.
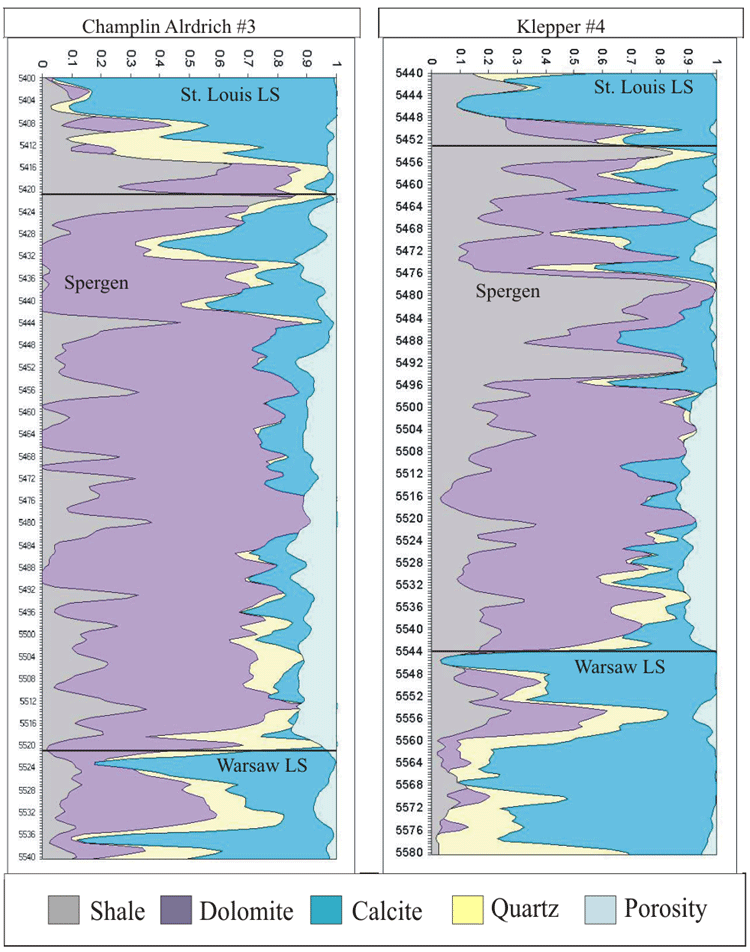
Composition graphs using GR, Neutron porosity (percent), Photoelectric, Grain Density, and Bulk Density.
Porosity Comparison
Porosity from core analysis is plotted against Neutron Density Average porosity from logs. There is a fairly good match between the two data sets for the Spergen section.
http://www.kgs.ku.edu/PRS/publication/2006/2006-14/p3-01.html
Last Modified May 2006