Production
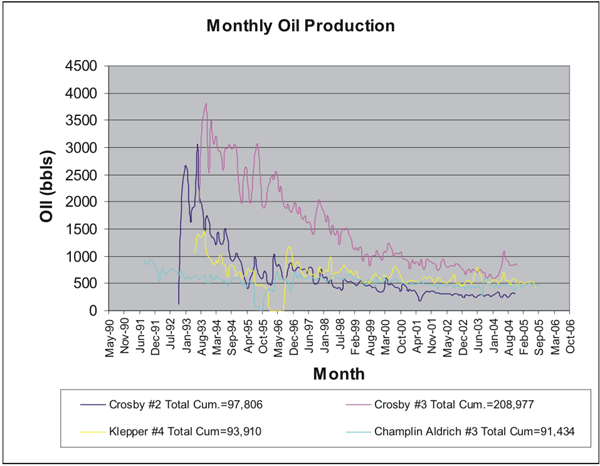
Well performance in the Cheyenne Wells and Smoky Creek fields is extremely variable. Completion dates range from the 1970’s to 1990’s. In order to compare the production from these wells we have calculated the production from the first 60 months of a well’s history for wells completed in the 1970’s compared with the wells completed 1990’s. The two figures below show us a wide range in oil cumulatives. Based on calculations from matrix porosities alone, some wells have performed better than expected, while others have underperformed. For example, comparing the Neutron Density Average (ND Average) porosity in the perforated interval of the Crosby #2 and #3, the Klepper #4, and the Champlin Aldrich #3 (Table and Graphs below) we can see that variability appears to have little relationship to porosity. Fractures are believed to contribute to this variability.
The amount of Spergen production is not directly related to structure or the thickness of the Spergen, indicating that local variations in rock properties and/or fracturing play a significant role in production.
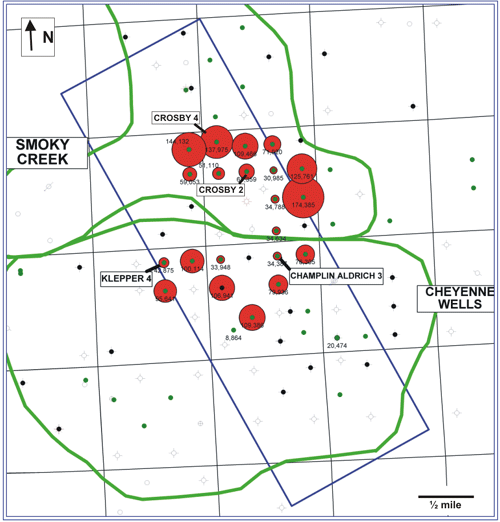
First 60 months oil production cumulatives (Bbls) for wells with monthly Spergen production values.
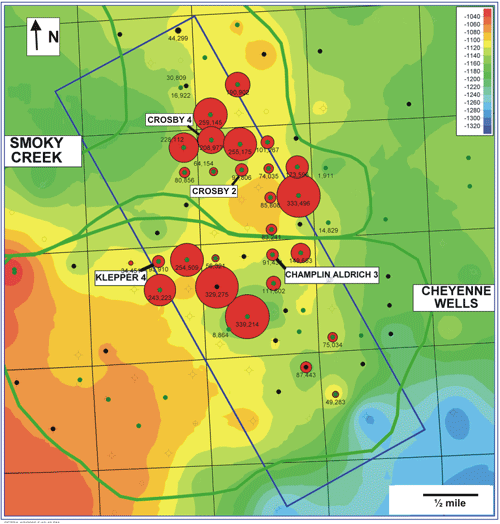
Total oil production cumulatives (Bbls) for wells with Spergen production; shown with top of Spergen structure map.
| Well Name | Completion Date | Perf Interval NDAverage | # of Feet Perforated | 60 Month Oil Cum. (Bbls) | Oil Production Cum. (Bbls) |
|---|---|---|---|---|---|
| Crosby #2 | 12-20-1992 |
8.77% |
5 |
65,359 |
97,806 |
| Crosby #3 | 8-15-1993 |
12.0% |
10 |
137,975 |
208,977 |
| Klepper#4 | 6-28-1993 |
14.1% |
8 |
42,875 |
93,910 |
| Champlin Alddrich #3 | 8-6-1991 |
16.4 |
8 |
34,387 |
91,434 |
http://www.kgs.ku.edu/PRS/publication/2006/2006-14/p1-03.html
Last Modified May 2006