History Matching
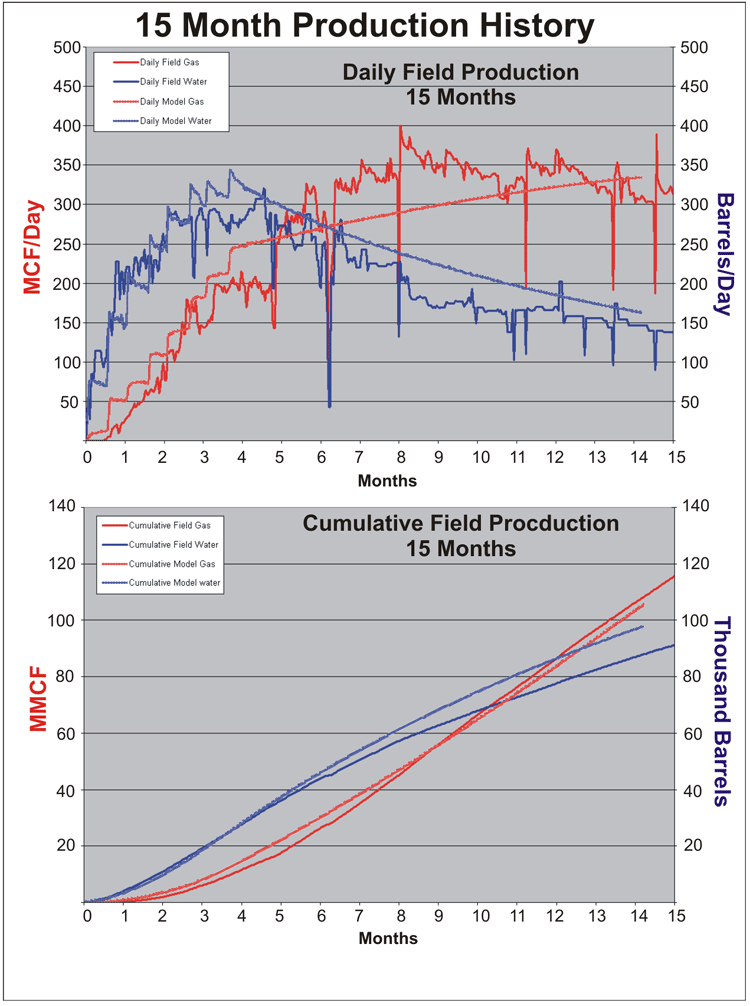
History Matching was performed on a field-wide scale. The field is comprised of four producing CBNG wells that had 15 months of gas and water production data reported on a daily basis. Fifteen months provided a sufficient amount of time for the wells to come on-line and begin to show production trends.
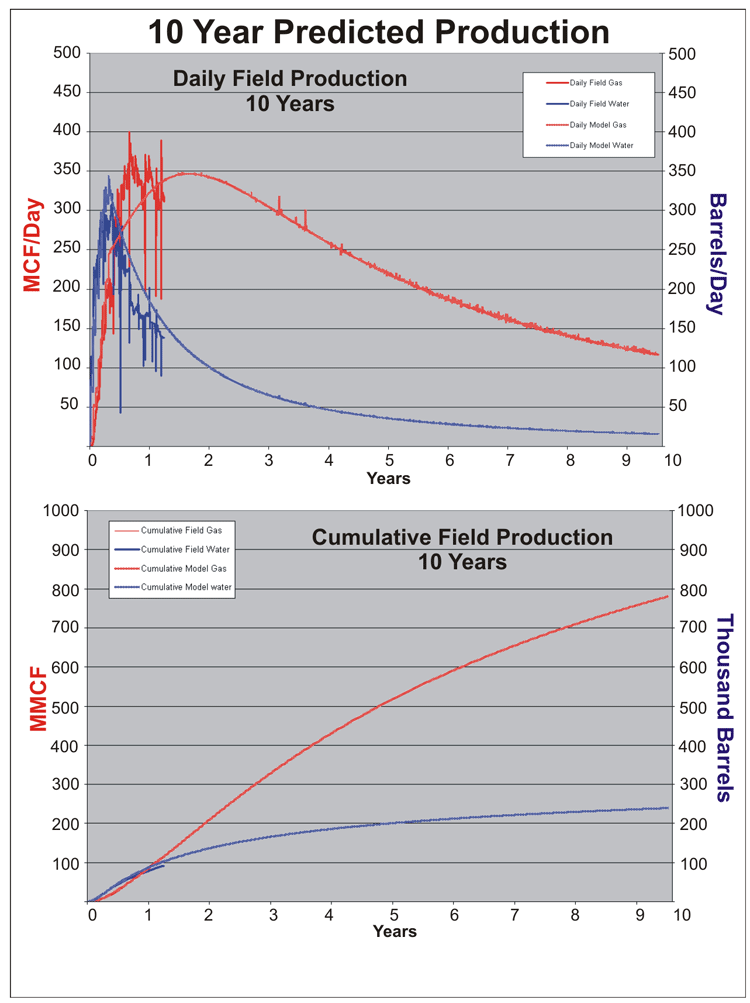
The model was modified by slightly changing variables until its behavior closely matched the performance of the actual reservoir. The simulation time was then lengthened to 10 years to analyze the predicted results. These results were compared to actual production trends from other wells in the region with at least 10 years of production history. It is important when history matching to not just match cumulative production values, but also the shape and trends of the production curves as well.
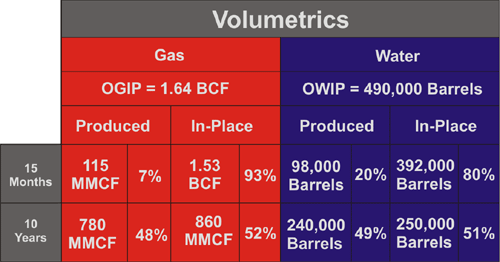
Calculating the volumetrics of the reservoir is another method for checking the accuracy of the model. The volumetric for the model are outlined below:
Preliminary ECBNG Simulation Results
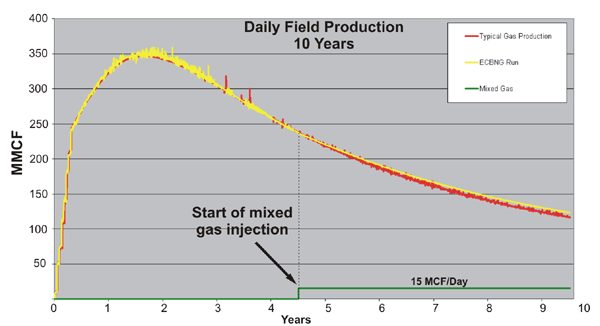
Simulation work with respect to the injection of kiln gas for this study is still in the very preliminary stages. The initial ECBNG simulation work was performed under the assumption that adsorption of CO2 over methane production in coal is 2-to-1. Further simulation work will be performed when isotherms for each component of the mixed gas (CH4, CO2, N2) are determined.
Preliminary results from the simulation work indicate that enhanced production of significant quantities of methane is not likely with the injection of kiln gas. These results are highly dependent upon several factors including sorption capacities for each component of the mixed gas, placement of injection wells, timing of injection, and rate of injection. Further simulation work is needed to investigate the effects of these factors upon the sequestration potential for CO2 and enhanced recovery of methane.
Typical Production Curves
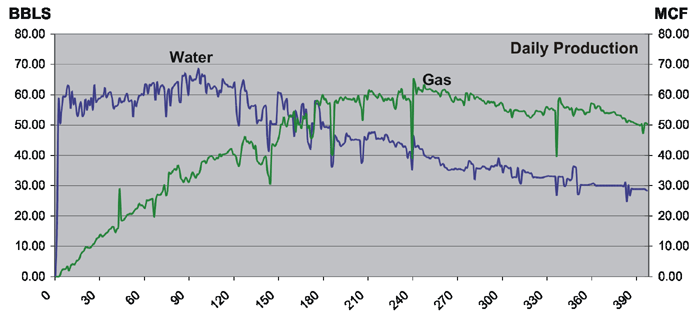
A typical production curve of a CBNG well in Wilson County, Kansas, showing the daily rates of gas and water production. After the well is completed water is produced to reduce the reservoir pressure. The reduction of reservoir pressure leads to the desorption of gas. Unlike a typical gas well, gas rates in a CBNG well increase for a period before they begin to slowly decline.
http://www.kgs.ku.edu/PRS/publication/2006/2006-13/p3-04.html
Last Modified May 2006