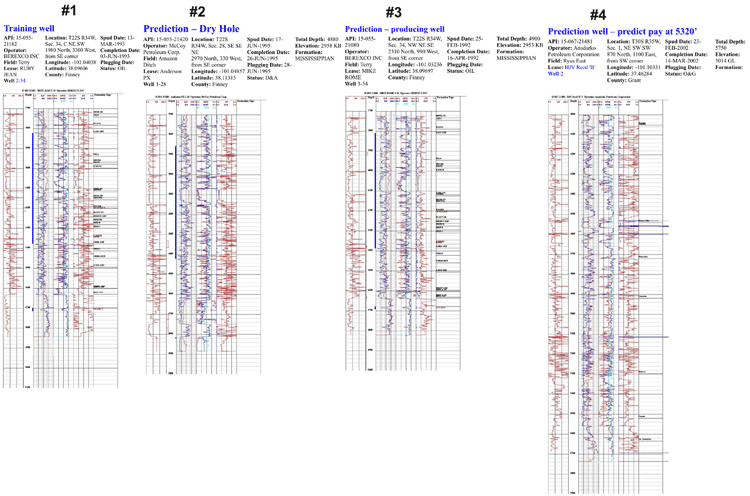
Examples of Logging Intervals Used to Train and Predict Pay
Click on above image to show more detail
Views of LAS (log ASCII) Files Using GEMINI Well-Profile Module
– showing DST intervals (vertical thin lines and cross bars) * dots for well perforations in depth track, formation tops found in database are annotated along margin..
Pay (incremental hydrocarbon*Phi*h) (blue curve) and Sw (red curve) are shown in Track 4 using a single set of cutoffs:
Phi = 0.1
Sw = 0.5
Vsh = 0.3
BVW = 0.08
KHAN is used to predict pay in these wells, illustrated on next page.
http://www.kgs.ku.edu/PRS/publication/2004/AAPG/Brine/p3-01.html
Last Modified December 2004
