Kansas Geological Survey, Open-file Report 2000-84
Interpretive Aspects of Seismic Coherence and Related Multi-trace Attributes
Previous Page--Complex Faulting Example ||
Next page--Coupled Stratigraphy and Structure Example
Incised Valley Example--Red Fork Formation--Anadarko Basin, Oklahoma(after Peyton et al., 1998)Red Fork Location Map
Location map outlining the 3-D seismic study area (white). Incised valleys of Upper Red Fork age occur within the study area. The Upper Red Fork incised valley system has traditionally been interpreted as having four stages of valley fill, with Stage III being the most abundant producer. The locations of wells that produce from Stage III valley-fill sands are shown in red and the interpreted outline of the Stage III valley prior to acquisition of 3-D seismic is shown in yellow. The segment of the interpreted Stage III valley which shows a gap in producing wells was initially identified as a prospect area. Seismic Cross Section--Flattened on Novi Horizon
Seismic cross section A (see previous slide for location) illustrates the difficulty of interpreting the Upper Red Fork incised valley system (stratigraphically positioned between the Lower Skinner and Novi Horizons) using conventional seismic interpretation techniques, such as autopicking, amplitude mapping, isochron mapping, etc. On this image, it is nearly impossible to identify individual stages of valley fill. Red Fork Coherence Slice--32 ms below Lower Skinner Horizon
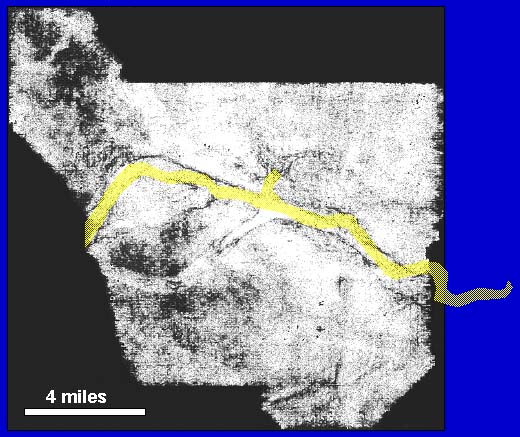
A coherence slice 32 ms below the Lower Skinner horizon clearly shows the outline of the Upper Red Fork incised valley. For comparison, the previously interpreted outline of the Stage III valley is shown in yellow. Spectral Decomposition
Spectral decomposition is a seismic attribute which has been successfully used in conjunction with coherence to enhance seismic interpretations. While coherence is an excellent method for detecting the edges of features such as incised valleys, spectral decomposition can highlight subtle variations in the valley fill itself. Spectral decomposition uses the Fourier transform to calculate for each trace the amplitude spectrum of a short time window covering the zone of interest. The amplitude spectrum is tuned by the geologic units within the analysis window, so that units with different rock properties and/or thickness will have different amplitude responses. When spectral decomposition is calculated for all traces in the 3-D seismic volume and presented in map form (usually as a series of frequency slices), the resulting images show lateral variability within the zone of interest. See Partyka et al. (1999) for a further discussion of spectral decomposition. Red Fork Spectral Decomposition--36 Hz Slice
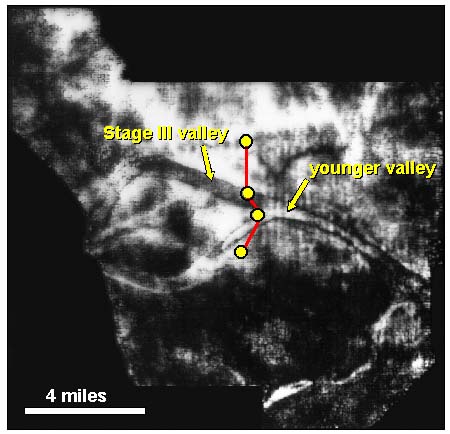
A 36 Hz spectral decomposition slice calculated using a 50-ms window below the Lower Skinner horizon. Note that spectral decomposition images not only the incised valley edges, but also internal features, which are interpreted as different stages of valley fill. From this spectral decomposition slice, it can be seen that the eastern portion what was formerly interpreted as Stage III valley has apparently been cut out by a younger valley. Stratigraphic well log cross section
Identification of the younger valley on the spectral decomposition led to reinterpretation of well logs in the area, which resulted in the recognition of a new younger stage of valley fill, Stage V. The Stage V valley is shale-filled, with no potential for hydrocarbon production. Interpreted Distribution of Upper Red Fork Valley Fill Stages
Final interpretation of Upper Red Fork valley fill stages in the study area. Note that the previously identified prospect area is in a location where Stage III has been cut out by Stage V. The new interpretation prevented the drilling of dry holes. Red Fork Coherence Slice--32 ms below Lower Skinner Horizon
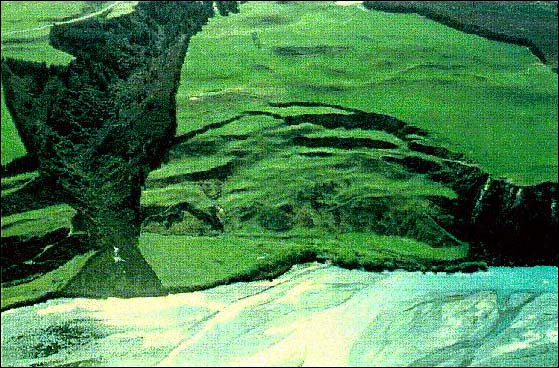
Several faults have been identified on well logs in the Red Fork and Inola intervals which can not be identified on vertical seismic sections. When these faults are plotted on a coherence map, however, they can be seen to coincide with areas of low coherence at the edge of the Red Fork incised valleys. This led to the interpretation that these are bounding faults of valley-edge slump blocks. These slump blocks appear to be of similar scale to present day examples from New Zealand. Slump feature on edge of modern-day incised valley from New Zealand
|
|
|
Kansas Geological Survey, Petroleum Research Section
Updated January 2001
Comments to webadmin@kgs.ku.edu
The URL for this page is HTTP://www.kgs.ku.edu/PRS/publication/2000/ofr84/slide6.html