
The Oz Machine uses a Markov chain simulation to generate the synthetic sequence of lithologies. The first (lowermost) lithology in the sequence is selected at random from the set of possible lithologies. Then the lithology for the next half-foot interval up is selected according to a set of "transition probabilities" describing the likelihood that any given lithology will occur immediately above the first lithology generated. This process is repeated for each half-foot interval until the entire column is filled with assigned lithologies.
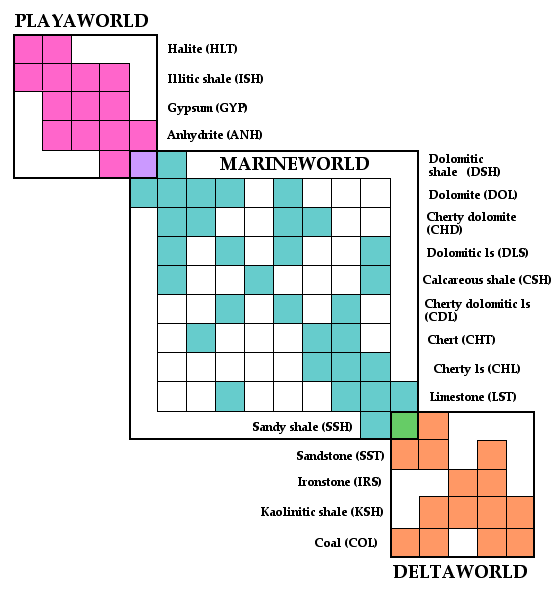
The transition probabilities are stored in a transition probability matrix, where the entry in row i, column j represents the probability that facies j will occur above facies i. The structure of the transition probability matrix is shown below, with the filled cells representing non-zero probabilities:

The Oz Machine transition probability matrix is subdivided into three major regions:
The transition probabilities of the "portal states" of dolomitic shale which links Playaworld with Marineworld, and sandy shale which links Marineworld with Deltaworld controls the typical duration of a succession within each facies domain.
The main diagonal values (transitions of a state to itself) control the thickness distribution of lithologies. Inevitably, the thickness variability will be artificial, because the probability model dictates a geometric distribution, while the observed distributions are more closely matched by a lognormal distribution. However, this aberration is not noticeable on the relatively short sequences generated by the machine.
The transition probability values are arbitrary but judiciously chosen to generate sequences that conform reasonably with natural stratigraphic successions. The sequences are perhaps a little more accelerated than their real equivalents, by presenting more lithological variability over relatively short intervals rather than the common real-world experience of monotonous lithological repetition. However, the purpose of the simulator is to provide training in log interpretation and this aim is aided by accentuating the challenge.
Each lithology consists of a specified mix of component minerals and the log responses for each half-foot interval are computed as a combination of the log values associated with the component minerals (with a little random deviation from the ideal "recipe" thrown in at each step). The logs are also smoothed with a simple five-point filter to emulate the vertical averaging provided by actual logging tools.
Back to the Oz Machine page ...