|
Reservoir Characterization to Inexpensively Evaluate
the Exploitation Potential of a Small Morrow Incised Valley-fill
Field
|

Kansas Geological Survey
Open-file Report 2002-9 |
Core Petrophysical Properties
Relative Permeability
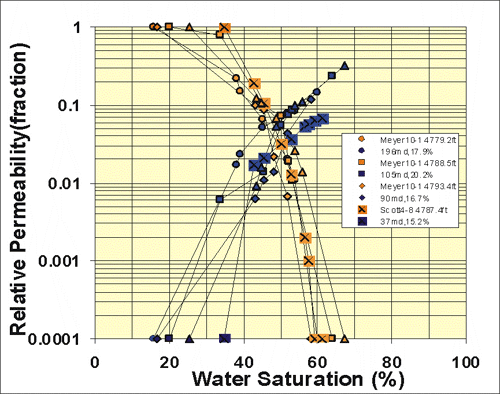
Previous study of Morrow cores from the Stewart field provided
oil-water imbibition relative permeability curves. These cores
exhibit a generally similar trend in Swi versus ki to the Morrow
in the Minneola Unit. Effective water permeabilities at residual
oil saturation kew,Sorw range from 0.06 to 0.325, with an average
of 0.19.

Modeled Relative Permeability
For the Stewart field Morrow, relative permeability exponents
appear to exhibit trends with change in absolute permeability
but cannot be defined with confidence. Based on the distribution
of these values median values were adopted. The Corey-type equations
were used to develop oil-water and gas-oil relative permeability
curves for rocks of differing permeability. For each rock the
Swi input into the relative permeability equation was predicted
using the synthetic capillary pressure curve equations described.
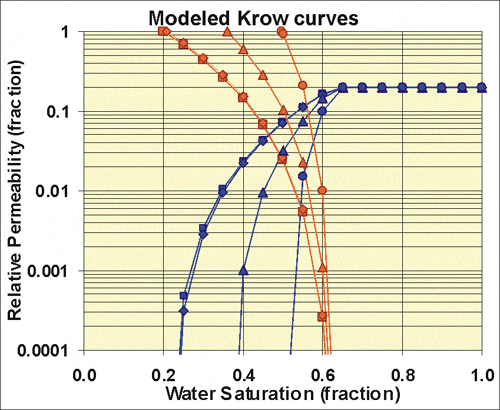
Initial values for m, n, and Sorw were 2.8, 3.1, and 37% respectively.
Available data indicates that Morrow Sorw averages 37% and is
not correlated with permeability. Based on this analysis, Sorw
was assumed to be a constant 37% for all permeabilities. Calculated
relative permeability and capillary pressure curves for rocks
with 3 md, 10 md, 30 md, 100 md, and 300 md. Permeabilities of
each gridcell were initially assigned to five basic classes to
conform to the five general relative permeability curve types.
Greater subdivision was not considered necessary since the five
relative permeability curve sets covered the range in Swi and
differed in saturation by less than 15% (saturation percent).
During history matching the Corey exponent m and n were adjusted
for some well locations to provide gas, oil, and water flow rates
consistent with observed production.

Modeling Relative Permeability
Since relative permeability end point saturations change with
permeability (e.g., “irreducible” water saturation changes
with permeability), the relative permeability curves also change
with absolute permeability. Relative permeability curves for each
layer were predicted using the Corey-type equations below where
Swi was obtained from Pc-k relations and the average absolute
permeability values for each layer. Exponent m and n values were
initially obtained from the measured data above and were modified
during simulation to reproduce lease production data.

In reservoir simulation either unique kr curves must be defined
for each unique water saturation region or pseudo-kr curves and
corresponding pseudo-Sw values used. Since kr was defined by layer
and region, it represents a pseudo-relative permeability. Initial
pseudo-Swi values were assigned to each layer using Pc-k relations
discussed.
e-mail : webadmin@kgs.ku.edu
Last updated March 2002
http://www.kgs.ku.edu/PRS/Poster/2002/2002-9/P2-06.html


