Characterization of Mississippian Osage Chat in South-Central
Kansas
Kansas Geological Survey
Open-file Report 2002-50

|
|
Kansas Geological Survey Open-file Report 2002-50 |
Porosity and Grain Density
Both log and core porosities for the Chat range from 0-50%. Within highly cherty intervals, generally near the top of the Chat, measured grain densities are that of quartz, 2.65 g/cc. Within the middle and lower portions of the Chat, interbedded thin bioclastic lime wacke-grainstone beds and incomplete silicification of dolomite mudstones results in variable grain densities from 2.65-2.78 g/cc with values generally between 2.68-2.72 g/cc. Rhomaa-Umaa (cross plot of calculated grain density vs. calculated volumetric photoelectric absorption coefficient of the rock matrix) and other log cross-plot analysis methods can generally identify mineralogy and allow accurate log interpretation of porosity. Measurement of pore volume compressibility indicates that in situ porosity (fi) values average 97+3% (1 s.d.) of unconfined or routine helium porosity values (fa). This corresponds to a decrease of about 0.9 porosity percent for a 30% porosity sample.
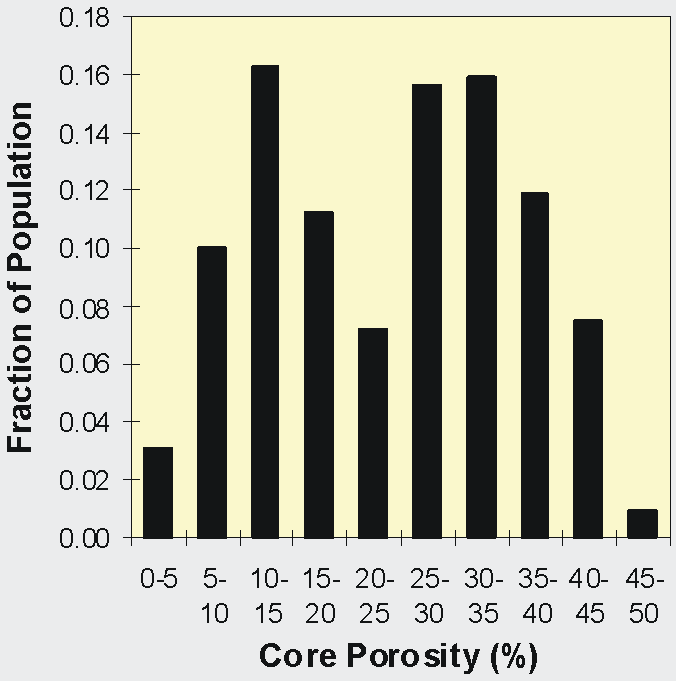
For wells and core that include the complete chat depositional cycle and all lithofacies described above, log and core data indicate that porosity is approximately bimodally distributed (Figure). This bimodal distribution is a function of the range of porosity exhibited by lithofacies within the chat. All carbonate-containing lithofacies, including cherty dolomite mudstones, exhibit porosities less than 20%. In contrast, chert facies exhibit porosities generally greater than 25%. Chert conglomerates, which represent a bimodal lithofacies population of high porosity chert and low porosity clay infill, exhibit both low and high porosities, reflecting both the relative proportion of chert and clay and the proportion of dense chert nodules with very low porosity. The bimodal chat porosity distribution would indicate that the porosity cut-off of 15-20% proposed by Duren (1967), is consistent with definition of reservoir occurrence in chert facies and not in cherty dolomite mudstone facies.

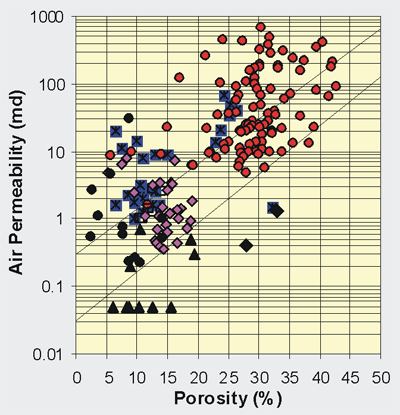
Noteworthy is the difference between the plug and whole core permeability-porosity trends. Whole core permeabilities are on average 5 to 10 times greater than plug permeabilities at any given porosity (Figure). Based on examination of core, three mechanisms are believed to cause this difference: 1) stress-release microcracking, that would not exist in the subsurface; 2) natural microfractures, particularly around chert breccia clasts and within inter-clast clay infill; and 3) enhanced preserved permeability channels along clast boundaries.
Stress release microfracturing along breccia clast boundaries and at clast-clay infill boundaries is observed in plugs and whole core in the chert conglomerate, and autoclastic chert facies. Microcracks are observed in whole core, it is probable that a portion of the permeability difference is due to stress-release microcracking. While stress release may have induced some microfracturing, it is also possible that natural microfractures exist in the subsurface and that whole core permeabilities are to some degree representative of subsurface permeabilities. Reservoir numerical simulation of a region in Spivey-Grabs Field indicates that the gas, oil, and water production history can best be matched utilizing absolute permeabilities that are approximately a factor of 2 to 4 times greater than maximum core plug matrix permeabilities. This interwell-scale permeability, and the presence of microfractures in core lends support for the presence of microfractures and fracture flow contribution to matrix permeability. In both thin section and in core, significant enhancement of porosity in some core can be observed along both open microfractures and healed fractures.
Fracture and matrix flow can be considered parallel and therefore total permeability can be considered as approximately: ktotal = (kmatrix*height + kfractureWidthfracture)/height. Given that matrix permeabilities are a factor of 2 to 10 times less than total flow (as measured in whole core), it is evident that fracture flow can represent a significant contribution to the total system.


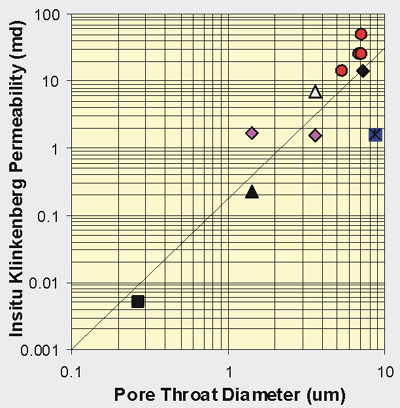
Crossplot of insitu Klinkenberg permeability versus principal pore throat diameter (PPTD) as determined form mercury capillary pressure. Samples lie off central trend as a function of mixed lithologies in plugs and other variables like degree of vugginess. ki=10(2.25*PPTD-0.75)
|
|