
|
|
A Borehole Plot |
| Description | Java Source Download | Website Download | Copyright & Disclaimer | |
This program was designed to view compress the well log caliper data down to 2 dimensional plot. The program is designed to examine the borehole for weakness in the formation over the range of the log. In an induced seismic environment due to brine injections, it may be useful in identifying where and in which direction the formation may be sensitive to over pressure.
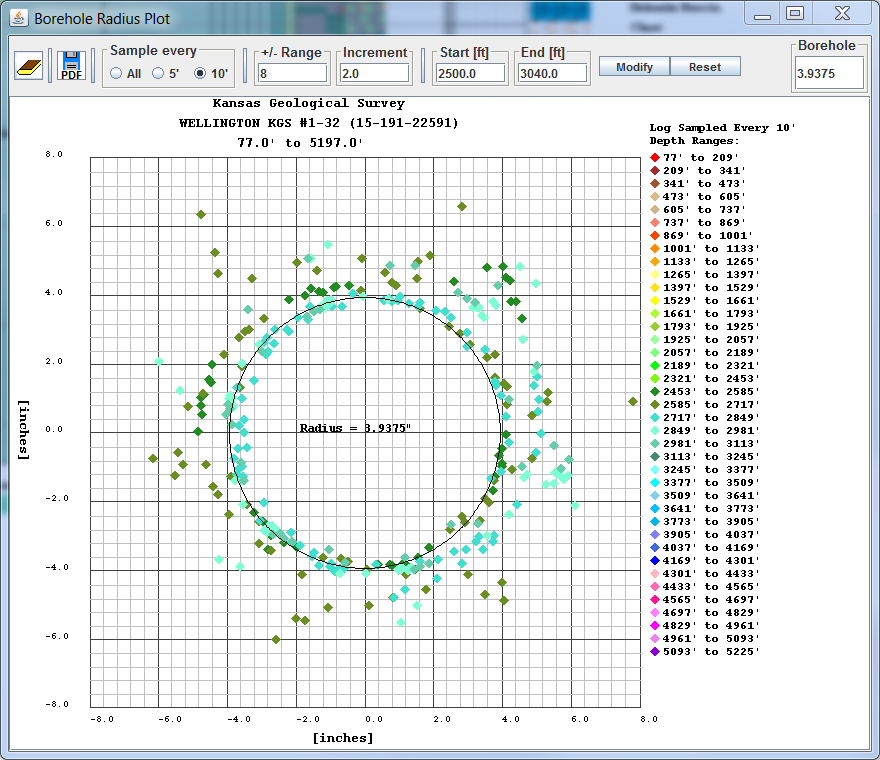
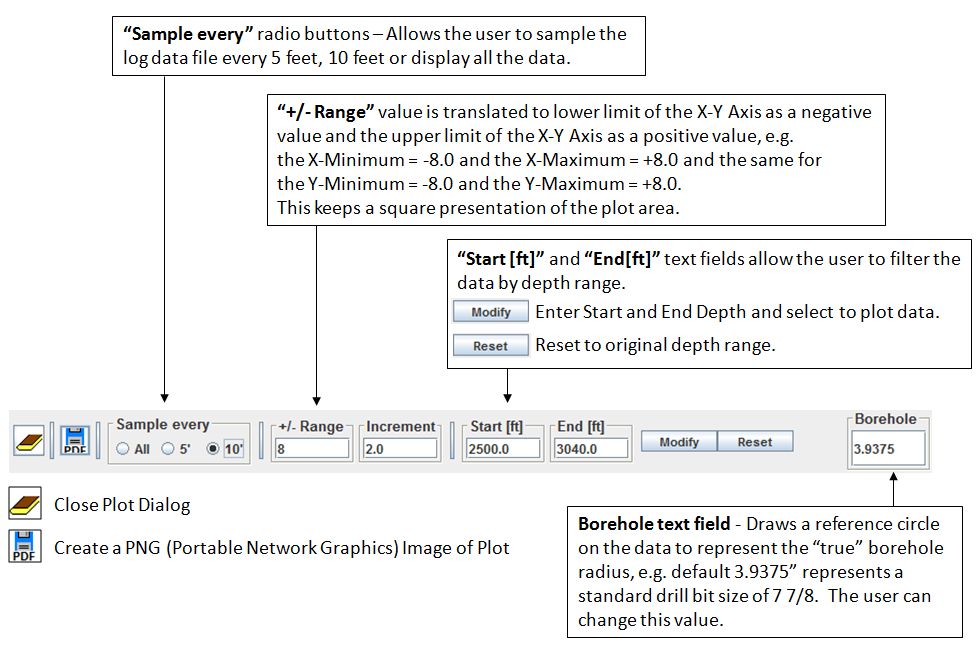
The web app allows you to filter the log data every 5’, 10’ and all data the default is every 10 feet. The user can change the x-y axis by changing the "+/- Range" and the "Increment" text fields to change the plot grid scale, just enter the value you wish and tab out of the field. The grid pattern assumes that the borehole should be "circular" so the scale is set to visually reflect symmetry. The user can change the data that is being displayed by changing the "Start" and "End" text fields and selecting the Modify button, see image below. You can reset to the original depth range by selecting the Reset button. The black circle is the borehole reference, which is initially set to a standard bit size of 7 7/8" diameter (3.9375" radius). You can change the reference circle by inserting a different value in the "Borehole" text field and then tabbing out of the text field.
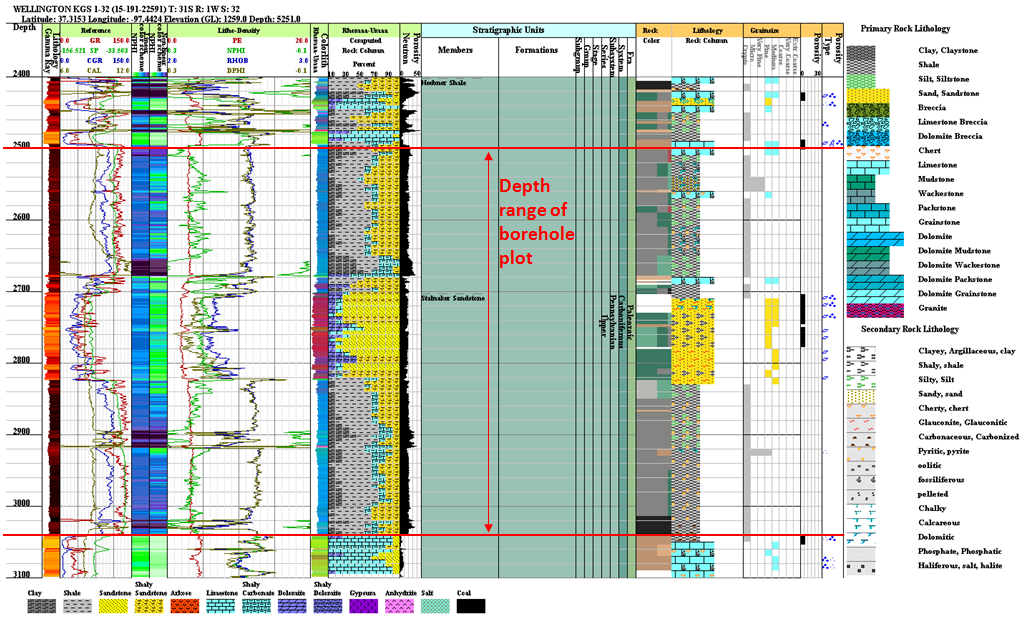
The LAS File Viewer ( http://www.kgs.ku.edu/stratigraphic/LAS/ ) can plot the lithology depending on the log curves available. The image below is the profile plot for the Wellington KGS 1-32 over the depth range the borehole plot (2500’ to 3040’).
| Author: John R. Victorine jvictor@kgs.ku.edu
The URL for this page is http://www.kgs.ku.edu/PRS/Ozark/JAVA_SRC/BOREHOLE/index.html |
 |
 |