
Prev Page--Figure 10.1 ||
Next Page--Figure 10.3
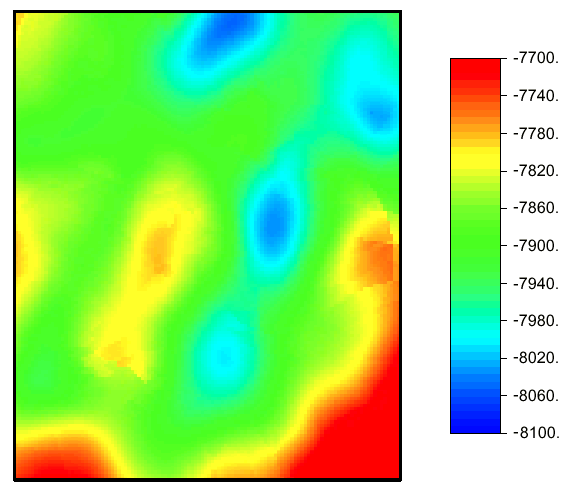
Figure 10.2 The 90th percentile for elevation (feet below sea level) to UNCF
based on the normality of ordinary kriging errors.

Kansas Geological Survey, Mathematical Geology Section
Updated Oct. 2001
URL="http://www.kgs.ku.edu/Mathgeo/Books/Geostat/fig10_2.html"
