Kansas Geological Survey, Open-file Report 2002-55
by
Margaret A. Townsend
KGS Open-file Report 2002-55
December 2002
The city of Hays, Kansas is working with the Kansas Geological Survey (KGS) to use the natural abundance nitrogen-15 isotope method to try to identify sources of nitrate-nitrogen in city wells. The wells in question have a history of nitrate-nitrogen (nitrate-N) concentration above the U.S. EPA drinking water limit of 10 mg/L (U.S.EPA, 2002). This method has been used successfully in Kansas for the past 10 years (Townsend et al., 1996; 2001).
Background on the nitrogen-15 natural abundance method will be presented. An overview of the soils and geology of the area will be presented as well as the overall water chemistry. The area and land use around each well will be discussed in relation to the nitrate-N and nitrogen-15 isotope values that were obtained.
The sampling for the study was done in November 2001 and May 2002. One city well was sampled in December 2001. Five city wells and an irrigation well, used at the Kansas State University Hays Agricultural Farm, were sampled in May with assistance of City of Hays personnel. The wells pumped until the specific conductance stabilized for three consecutive readings. For most of the wells this occurred within 10 minutes. Two of the wells, C-27 (high nitrate-N) and C-24 (lowest nitrate-N) are not currently used by the city. These two wells were pumped for approximately 15-20 minutes until the water ran clear, and then the water was tested for specific conductance until the readings stabilized.
Complete inorganic water analyzes were performed by the Analytical Services Section of the KGS. Dr. Steve Macko, Dept. of Environmental Services, University of Virginia, did nitrogen-15 isotope analyses. Samples of the dried nitrate-containing salts were combusted at high temperature to nitrogen gas for analysis of their isotopic compositions.
Soil cores were collected to approximately 15 feet near four of the city wells and at the KSU irrigated field. Cores were taken using a Giddings press probe. Jim McDowell, and Bob Tricks, Soil Scientists with the Hays NRCS field office, described the cores in the field. The Kansas State University (KSU) testing laboratory performed chemical analyses on soil samples for nitrate-N, ammonium-N, total nitrogen, carbonate, and total organic carbon.
Natural abundance nitrogen isotope analysis is a frequently used method to assist in determining sources of nitrogen to ground water. The isotope analysis involves establishing the ratio of nitrogen-15 (15N) to nitrogen-14 (14N) on the nitrogen in nitrate compared to the ratio observed in the standard, atmospheric nitrogen (air). Comparisons of these values indicate if there is more (positive) or less (negative) 15N in the sample. The values thus indicate whether the sample is enriched (+) or depleted (-) in relation to the standard.
Isotopic values are reported as (15N in per mil (‰) (Hoefs, 2001):
Figure 1 illustrates the range of (δ15N values for various sources of nitrogen and associated processes affecting the 15N abundance (Heaton, 1986). Generally, biological activities use 14N preferentially, resulting in an increased (δ15N value in the remaining nitrogen. Previous work has shown that nitrate from commercial fertilizer sources has (δ15N values of -2 to +8‰, from soil nitrogen a range of +5 to +7‰, and from animal waste generally greater than +10‰ (Heaton, 1986, Herbel and Spalding 1993). Other information such as dissolved oxygen, salinity, iron, and manganese concentrations, and proximity to potential sources, aid in source determination.
Figure 1. Range of δ15N values for various sources of nitrogen and the enrichment effects of denitrification and volatilization processes. Ranges of δ15N values from Heaton (1986) and site studies in Kansas (Townsend et al., 1996).
Figure 1 also illustrates the effects of processes in the nitrogen cycle on the resulting (δ15N values. Sources such as fertilizer and legumes have very light (δ15N signatures (-2 to +2 ‰). Ground water impacted by fertilizer frequently has measurable nitrate as well (generally greater than 2 mg/L in Kansas). Because of possible volatilization of anhydrous ammonia by bacteria, the (δ15N values frequently are in the +2 to +8 ‰. Legume sources generally have low nitrate concentrations because the nitrogen is often tied up in an organic form and the plant nodules need to degrade before the nitrogen is released.
Other sources such as human-septic waste or animal waste (pig in figure 1) have starting (δ15N values around +5 ‰. Because animal waste has a high ammonia component, the release of the ammonia when the waste is produced causes an immediate enrichment of the (δ15N because the (δ14N in the waste is released by volatilization. As a result, the (δ15N of the remaining nitrogen is much higher, in the range of +10 ‰ or more. Generally with animal-waste sources, nitrate-N values are high (commonly more than 10 mg/L) as well.
Volatilization also can occur in soils and rocks with carbonate zones. Carbonates can increase the pH of water towards 8.5, which means the water is more basic. In this range nitrate can be converted to ammonia gas. The lighter 14N isotope is released with the gas. The remaining nitrogen becomes enriched with (δ15N of a higher value.
Another process that can result in an enriched (δ15N value is denitrification. In this process, bacteria degrade nitrate to nitrogen gases that are released to the atmosphere. The 14N of the nitrate is utilized first resulting in an enriched (δ15N in the remaining nitrate. Signs of possible denitrification are low nitrate values, enriched (δ15N values, and high levels of bicarbonate, which is a byproduct of the denitrification process.
The city of Hays is located in Ellis County in central Kansas. The surrounding area is generally a mix of irrigated and dry land farming with rangeland and feedlots also present. Average rainfall is approximately 24 inches/yr. Potential evapotranspiration is approximately 29.5 inches/yr (Thornthwaite, 1957).
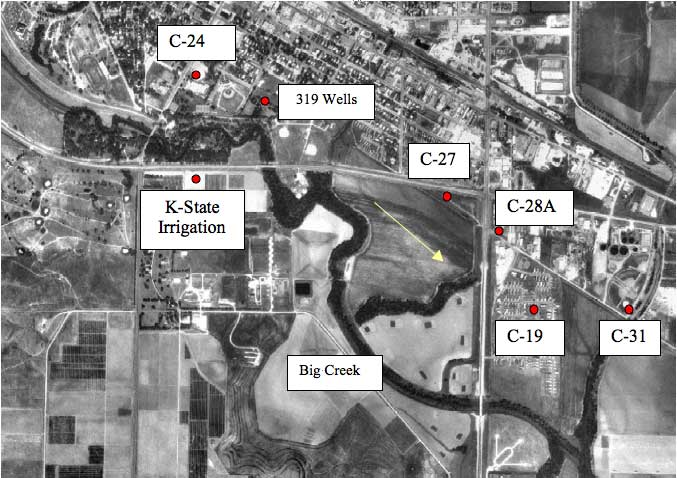
Figure 2 shows an orthophoto view of the southern part of the city and surrounding area with sampling points marked. The well field is located in the southern part of the city of Hays in the alluvium of Big Creek (Figure 2). Approximate ground-water flow direction (SE) is shown by the arrow. The wells that were sampled range in depth from 40 to 60 feet. Depth to water ranges from 20 to 27 feet. Most of the wells were installed in 1955 and the Kansas State University irrigation well was installed in 1967.
Figure 2. Location of sampling points (red points) in the city of Hays. Samples were collected in November 2001 and May 2002. Arrow indicates approximate ground-water flow direction. Photo from Data Access and Support Center (DASC, 2002) at KGS.
The geology of the area consists of Quaternary alluvial and terrace deposits overlying Cretaceous Blue Hill Shale (Figure 3). The city wells are sited in the terrace deposits and alluvium of Big Creek on the southern edge of the city. Wells ranged in depth from 40 to 60 ft deep.
Figure 3. Geologic map of study area shows alluvial and terrace deposits that overlie Cretaceous Blue Hill Shale member. Study area outlined in black. Automated Cartography Unit, Kansas Geological Survey; Updated February 2002 URL=http://www.kgs.ku.edu/General/Geology/County/def/el/el_10_8.html.
Soils in the study area consist of the Roxbury silt loam, McCook silt loam, and Detroit silt loam. All of these soils have permeability ranges of 0.6 - 2 inches/hr (USDA, 1975). The soil cores were collected to a depth of approximately 15 ft. Depth to water ranged from 20 to 27 ft as reported from the Water Information Management Access System (WIMAS) database (DASC, 2002). The cores were described in the field and sub-sampled for chemical analysis. The soils are generally silt loam to silty clay loam with caliche nodules throughout the profile. Chemical profiles and (δ15N values for selected horizons will be discussed with the water chemistry of each well.
Figure 4 shows the distribution of soils in the study area. The dominant soils are the Roxbury and Detroit silt loams. Figures 5 and 6 show the particle size distribution for these soils, which is dominantly silt with some calcium carbonate in the lower zones. Field soil descriptions for cores taken in these soils agree well with the data from the NRCS soils database (http://websoilsurvey.nrcs.usda.gov/app/). The amount of silt and clay in these soils suggests a low permeability and possible lengthy travel time. The particle size analysis data for the Detroit soil is from a site in Osborne County, Kansas. No data was available for description from Ellis County.
Figure 4. Soils map for study area near Big Creek, Ellis County, Kansas. Data from SURGO database (http://www.kansasgis.org/).
Figure 5. Soil profile of Roxbury Silt Loam for Ellis County, Kansas. Soil is dominantly silt with calcium carbonate present throughout the profile. Data from USDA NRCS database (2002).
Figure 6. Soil profile for Detroit Silt Loam (data from Osborne County, KS). Silt dominates with calcium carbonate present in the lower portion of the profile. Data from USDA NRCS database (2002).
Water chemistry in the Hays area is predominantly calcium bicarbonate-sulfate-chloride type water. The anions of bicarbonate, sulfate, and chloride are the main contributors to the specific conductance (Appendix A). Nitrate-N concentration near or above the drinking water limit of 10 mg/L (U.S. EPA, 2002) occurred in many of the city wells. The purpose of this study was to try to identify the sources of nitrate contributing to the problem in the water supply of Hays, Kansas.
Figure 7 shows the range of nitrate-N values from 1995 to 2002. Overall there is an increasing trend in the nitrate-N concentration, particularly in well C-27. Figure 8 shows the range of chloride concentration for the same wells. Chloride concentration for well C-24 is much higher and nitrate-N is generally lower than in the other wells. This well is not routinely used and appears to have a reducing water quality. The δ15N value for this well (discussed in next section) indicates that denitrification has occurred in this well.
Figure 7. Historic trends in nitrate-N concentration from 1995 to 2002 for wells in Big Creek (data from city of Hays). Well C-27 shows the greatest increase in concentration. Well C-24 has the lowest nitrate concentration. This well has indications of reducing water chemistry as indicated by elevated sulfate and very low nitrate-N values (Appendix A).
Figure 8. Chloride concentration of wells from Big Creek well field. Well C-24 has the highest chloride concentration. All other wells occur within range of 100-175 mg/L chloride.
Figure 9 shows the correlation of anions contributing to specific conductance. This trend in water chemistry is often observed in semi-arid environments with high evapotranspiration. Nitrate-N does not follow the trend suggesting that evapoconcentration of applied irrigation water and fertilizer is not a primary source of contamination. The δ15N values for most of the wells supports this theory.
Figure 9. Figure illustrates contribution of bicarbonate, sulfate, and chloride anions to specific conductance value. Increasing values suggests impacts of evapoconcentration on ground water in the area. Nitrate-N shows no relationship suggesting another source other than evapoconcentration of water or fertilizer.
Most of the wells, except for C-24 near the municipal swimming pool and C-28A near the car dealership (Figure 1), have nitrate-N values well above the drinking water limit of 10 mg/L. The δ15N values are all greater than +10 ‰ and fall in the animal waste and probable denitrification enrichment zone on Figure 10. The potential sources for nitrate in the Big Creek well field include the Kansas State University agricultural complex to the west (Figure 1), which has feed lots, lagoons, and probable manure storage areas. An abandoned sewage treatment plant is present to the west of well C-27. In addition, there are several trailer parks upgradient of the various wells. These sites may have abandoned septic systems that could provide a point source for the observed nitrate concentration.
Figure 10. Range of nitrate-N and δ15N values observed in this study. The δ15N values are all greater than +10 ‰, which is the animal waste and probable denitrification enrichment zone on the graph.
The denitrification enrichment zone also coincides with the range of observed δ15N values. However, the high nitrate-N is more usually observed from an animal waste source. Denitrification processes in the soil zone may have caused further enrichment of the δ15N values but it is unlikely that the nitrogen in the unsaturated zone is the primary source.
The soil cores collected at wells C-27, C-19, C-31 the 319 wells site, and at the K-State irrigation site all have δ15N values that are increasing with depth. Figures 11-14 show the cores from each site.
The nitrate-N concentration for this well is 13.1 mg/L and the δ15N value is +19.2 ‰. Figure 11 shows the chemical profile for the soil core taken at this site. The extractable nitrate-N and ammonium-N concentrations are less than 5 ppm. The total organic carbon ranges from approximately 0.6% to 1.2% at the surface. Calcium carbonate is present throughout the profile. The δ15N values for the profile show increasing values with depth. The presence of carbonate, organic carbon and decreasing nitrogen values with depth suggests that volatilization and/or denitrification processes occur throughout the profile.
Figure 11. Soil chemical profile near K-State irrigation well. Note nitrate-N and ammonium-N concentrations less that 5 ppm, calcium-carbonate present at depth of core, organic carbon range from 0.6% to 1.2%, and increasing δ15N values with depth.
Although the leachate from this soil probably contributes to the nitrogen values observed in the groundwater, the volume of the nitrate and ammonium in the soil is not sufficient to result in the observed 13 mg/L.
The nitrate-N concentration for this well increased from 22 to 26 mg/l from December 2001 to May 2002. The δ15N values for the samples ranged form 17 to 23 ‰. This site is located near a dryland field and is down gradient from the abandoned sewage treatment plant and several trailer parks (Figure 1). The high nitrate and δ15N values suggest an animal waste source with some denitrification enrichment (Figure 10). The soil chemical profile near well C-27 shows nitrate-N and ammonium-N concentrations of less than 6 ppm. Calcium carbonate is present in the profile as is organic carbon. δ15N values are in the +10 ‰ range. As is the case with the other soil samples from this study, the lower concentration of leachable nitrate and ammonium in water from the soil and the lower range of δ15N values suggests that alternate sources of contamination are responsible for the nitrate in the ground water.
Figure 12. Soil chemical profile near well C-27. The δ15N values suggest the possibility of denitrification or volatilization enrichment of nitrogen in the soil. The presence of organic carbon and carbonate would provide the food source for denitrifying bacteria and the possible carbonate for volatilization reactions to occur in the profile.
Well C-28A is down gradient from well C-27 and is adjacent to a car dealership. The nitrate-N value for this well in May 2002 was 8.7 mg/L and the δ15N value was +28.7 ‰. These values suggest the possibility that denitrification or dilution has affected the nitrate-N concentration. The possibility of denitrification would result in a somewhat lower nitrate-N concentration but with an enriched δ15N value. The bicarbonate value for this well is high which would be expected if denitrification occurred.
No soil core was collected at this site because of the location near the car dealership.
The nitrate-N value for this well was 10.8 mg/L with a δ15N value of +24.3‰. This site is located in a trailer park with a dry land field to the east of the well. The well is also situated downgradient of wells C-27 and C-28A (Figure 1). The enriched δ15N value is most likely related to denitrification of an animal waste source.
Figure 13. Soil chemical profile near well C-19. Low extractable nitrate and ammonium values plus δ15N values much lower than that observed in ground water suggests another source is responsible for the observed higher nitrate values in the ground water.
The soil chemical profile for this site shows a nitrate-N and ammonium-N concentration below 3 mg/L. Calcium carbonate is present throughout the profile. The δ15N values are in the range of +10 to +13‰ suggesting the influence of denitrification processes throughout the profile. The low extractable nitrogen and the presence of lower δ15N values than was observed in the ground water suggests that the leachate from the soil may contribute a small amount to the observed ground water value but can not be responsible for the quantity measured in the ground water.
The observed nitrate-N value of 10.1 mg/L and a δ15N value of +22.3 ‰ at this well are similar to other samples observed upgradient from this site. This well is located near the current sewage treatment plant and near the softball field on the southeast side of the city. The well is near dryland fields and downgradient from the city proper. Multiple sources of nitrate could be responsible for the observed nitrate-N and enriched δ15N value.
The soil chemical profile for this site is similar to the others. Extractable nitrate-N is very low (less than 2 mg/L). Ammonium-N has a maximum value of 4.6 mg/L. Calcium carbonate occurs in the profile but organic carbon is lower than the other sites. The presence of calcium carbonate may indicate the possibility of volatilization of nitrogen as it moves through the profile. The δ15N values are lower than at the other sites suggesting that not as much denitrification has occurred in this profile.
The combined nitrate, ammonium, and δ15N values for this profile are very low in comparison to the observed values in the ground water, again suggesting that the source is primarily from another source than the soils and the land use immediately surrounding the wells.
Figure 14. Soil chemical profile near well C-31. Low nitrate-N, ammonium-N, and lower δ15N values than other profiles support the theory that the source of nitrate in ground water is probably minimally impacted by land use immediately surrounding the measured wells.
Personnel at the city of Hays requested a soil profile be collected near the Montgomery ditch near the municipal park area. No water samples were available from this site. The soil chemical profile showed somewhat higher ammonium-N values than the other soil profiles. The calcium carbonate values were higher as were the organic carbon percentages. The enriched δ15N values in the 40 to 60-inch interval (Figure 15) coincide with the higher calcium carbonate levels. The higher values may indicate that volatilization enrichment occurred at this interval.
Figure 15. Soil chemical profile collected at the 319 well site near Montgomery Ditch in Hays, KS. Profile is similar to the other sites. Enriched δ15N values at the 40 to 60 inch interval suggests that volatilization enrichment might have occurred because of the higher calcium carbonate level observed.
Although no ground water chemistry values are present for the wells at this site, the δ15N values in the profile are within the range of values observed in the other soil profiles again ruling out the likelihood of surface contamination being the prime contributor to the problem.
The chemistry of the Hays well C-24 near the municipal swimming pool suggests that a reducing water chemistry is present. The well is not used very often and so may have developed a reducing zone around the annulus of the well. This well has the highest chloride, sulfate, bicarbonate and lowest nitrate-N value for all of the wells. The δ15N value is +16.8 ‰, which is a similar value to those observed in other parts of Kansas where denitrification has been documented (Townsend and Sleezer, 1995). This well is located north of the K-state farm and abandoned sewage treatment plant. It is likely that the δ15N value at this well is due solely to denitrification enrichment and is not related to the source(s) of contamination that has impacted the other wells.
The use of the nitrogen-15 natural abundance method to determine sources of nitrate contamination in the Hays, Kansas Big Creek well field indicates the strong possibility that animal waste is a source of contamination to the ground water. Well C-27 is closest to the K-state farm complex and the abandoned sewage treatment plant. This well has the highest nitrate-N and δ15N values. The wells C-28A, C-19, and C-31 have lower nitrate-N values but the δ15N values are similar to the enriched that the values measured at C-27. The lower nitrate-N values may indicate possible denitrification reduction of the nitrate concentration and/or dilution by mixing with other lower nitrate water.
The soil chemical profiles indicate that denitrification and volatilization enrichment may be occurring both in the unsaturated and saturated zones. The presence of abundant calcium carbonate in the soils could permit the changes in the pH of the water necessary for volatilization to occur. The δ15N values generally increase with depth. The soils contain sufficient nitrogen and carbon to permit denitrification to occur in the profile with the resulting enriched δ15N values.
Because the nitrogen-15 natural abundance method was unable to clearly pinpoint a particular source or groups of sources for the nitrate in the ground water it is recommended that some additional sampling and analysis be done to clearly determine the sources affecting the water supply.
| ID | Sample Location |
Sample Date |
Lab SP C |
Lab pH |
SiO2 ppm |
Ca ppm |
Mg ppm |
Na ppm |
K ppm |
Sr ppm |
HCO3 ppm |
SO4 ppm |
Cl ppm |
F ppm |
B ppm |
NO3-N ppm |
δ15N ‰ |
δ13C ‰ |
|---|---|---|---|---|---|---|---|---|---|---|---|---|---|---|---|---|---|---|
| C-27 | 14-18W-04DAD | 11/15/01 | 1760 | 7.40 | 44.8 | 246 | 24.1 | 110 | 8.5 | 1.22 | 442 | 223 | 179 | 0.54 | 199 | 22.7 | 17.4 | -20.7 |
| C-19 | 14-18W-03DCC | 5/14/02 | 1290 | 7.35 | 47.4 | 182 | 22.1 | 64.6 | 10.1 | 1.14 | 401 | 155 | 112 | 0.33 | 124 | 10.8 | 24.3 | -22.2 |
| C-24 | 14-18W-04BCB | 5/14/02 | 2080 | 7.15 | 54.7 | 287 | 36.1 | 128 | 12.6 | 2.05 | 498 | 302 | 279 | 0.26 | 163 | 0.9 | 16.8 | -21.8 |
| C-27 | 14-18W-04DAD | 5/14/02 | 1750 | 7.15 | 43.6 | 233 | 24.0 | 102 | 9.0 | 1.2 | 458 | 220 | 175 | 0.37 | 256 | 26.3 | 22.9 | -21.6 |
| C-28A | 14-18W-03BCC | 5/14/02 | 1340 | 7.45 | 45.4 | 172 | 21.7 | 86.5 | 9.6 | 1.03 | 477 | 117 | 122 | 0.35 | 213 | 8.7 | 28.8 | -21.8 |
| C-31 | 14-18W-03CDC | 5/14/02 | 1100 | 7.40 | 48.1 | 133 | 16.6 | 84.2 | 8.0 | 0.80 | 365 | 100 | 100 | 0.33 | 201 | 10.1 | 22.3 | -19.9 |
| KSU Irr. Well | 14-18W-04DBA | 5/14/02 | 1245 | 7.20 | 47.4 | 138 | 20.0 | 85.7 | 9.6 | 1.06 | 395 | 99.6 | 121 | 179 | 13.1 | 19.2 | -20.1 |
DASC, 2002, http://www.kansasgis.org/, MrSID Compressed Digital Orthophoto Counties.
Heaton, T. H. E., 1986, Isotopic studies of nitrogen pollution in the hydrosphere and atmosphere--a review: Chemical Geology, v. 59, p. 87-102.
Herbel, M. J., and Spalding, R. F., 1993, Vadose zone fertilizer-derived nitrate and δ15N extracts: Ground Water, v. 31, no. 3, pp. 376-382.
Hoefs, J., 2001, Stable Isotope Geochemistry, 4th ed.: Springer, 201 p.
Thornthwaite, C. W., Mather, J. R., and Carter, D. B., 1957, Instructions and tables for computing potential evapotranspiration and the water balance: Climatology, v. 10, p. 181-311.
Townsend, M.A. and Sleezer, R.O., 1995, Drainage basin scale variation of nitrate-N concentrations in ground water, Harvey County, Kansas: Geological Society of America, 1995 Abstracts with Programs of North-Central Section and South-Central Section, University of Nebraska-Lincoln. Lincoln, NB, p. A-90.
Townsend, M.A., Sleezer, R.O., and Macko, S.A., 1996, Effects of agricultural practices and vadose zone stratigraphy on nitrate concentration in groundwater in Kansas, USA: Water Science and Technology, v. 33, no. 4-5, p. 219-226.
Townsend, M. A., Macko, S. A., and Young, D. P., 2001, Distribution and sources of nitrate-nitrogen in Kansas groundwater; in, Optimizing Nitrogen Management in Food and Energy Production and Environmental Protection: Proceedings of the 2nd International Nitrogen Conference on Science and Policy, The ScientificWorld 1 (S2), p. 216-222.
U.S. Department of Agriculture (USDA) Soil Conservation Service, 1975, Soil survey of Ellis County, Kansas, 86 p.
U. S. Department of Agriculture Natural Resources Conservation Service soils database, http://websoilsurvey.nrcs.usda.gov/app/, (verified Sep. 2007).
U. S. Environmental Protection Agency, 2001, National Primary Drinking Water Standards: http://www.epa.gov/safewater/contaminants/index.html (verified Sep. 2007).
Kansas Geological Survey, Geohydrology
Placed online Sept. 5, 2007, original report dated Dec. 2002
Comments to webadmin@kgs.ku.edu
The URL for this page is http://www.kgs.ku.edu/Hydro/Publications/2002/OFR02_55/index.html