Research
Methods – Remote sensing (Prepared by Stephen L. Egbert, University of Kansas Dept of Geography
and Applied Remote Sensing Center)
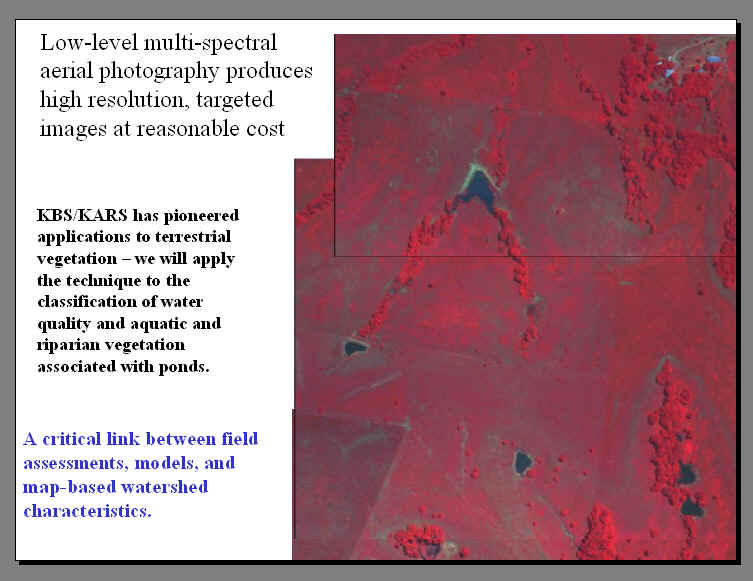
We are exploring the use of digital imagery from three
satellite and airborne multispectral sensors – Landsat Enhanced Thematic
Mapper, Terra ASTER, and the DuncanTech MS3100 multispectral camera – to map
and categorize water impoundments in the study areas. The spatial resolution of the instruments ranges from 28.5 m to
less than 1 m, providing the ability to map at a variety of scales. The spectral signature information provides
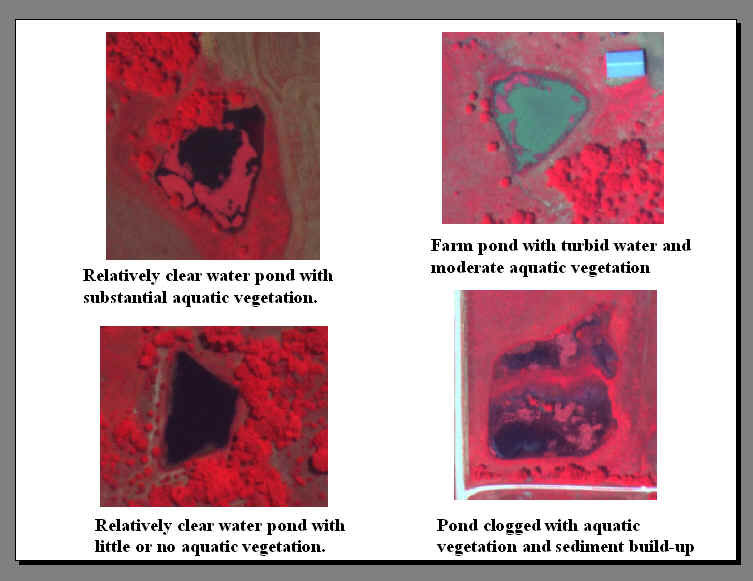
data with which to classify pond and landscape biotic conditions and functions.
Sensors and Data
Landsat
Enhanced Thematic Mapper. The
Enhanced Thematic Mapper (ETM+) instrument is carried on board the Landsat 7
satellite and is a successor to the highly successful Thematic Mapper
instrument. ETM+ has a spatial
resolution of 28.5 m and has 7 spectral bands (Table 1). Swath width is 185 km.
ASTER. The Advanced Spaceborne Thermal Emission and
Reflection Radiometer (ASTER) on board NASA’s Terra satellite uses three
separate instruments to collect data in14 spectral bands and has a swath width
of 60 kilometers. For this project we
will employ data from the VNIR (visible and near-infrared) instrument that has
15-m spatial resolution in three spectral bands – green, red, and near infrared
.
DuncanTech
MS3100 Imaging Camera. The MS3100
is a high-resolution airborne digital multispectral imaging system capable of
resolutions down to approximately 0.5 m (at a flying height of 1700 m). It has three spectral bands (Table 3) that
were specifically selected to be useful for both mapping and analyzing water
bodies.
|
Table 1: Remote sensing
tools |
Landsat ETM+ |
ASTER VNIR |
MS3100 |
|||
|
Resolution: 28.5 m |
Resolution: 15 m |
Resolution: ~1 m |
||||
|
Spectral
Region |
Band |
Wavelength
|
Band |
Wavelength |
Band |
Wavelength |
|
Blue-green |
1 |
.45
- .52 |
|
|
1 |
.45
- .52 |
|
Green |
2 |
.52
- .60 |
1 |
.52
- .60 |
|
|
|
Red |
3 |
.63
- .69 |
2 |
.63
- .69 |
2 |
.63
- .69 |
|
Near
infrared |
4 |
.76
- .90 |
3 |
.76
- .86 |
3 |
.76
- .90 |
|
Middle
infrared |
5 |
1.55
- 1.75 |
|
|
|
|
|
Thermal
infrared |
6 |
10.4
- 12.5 |
|
|
|
|
|
Middle
infrared |
7 |
2.08
- 2.35 |
|
|
|
|
Mapping Water
Impoundments
Mapping water bodies using multispectral imagery is
relatively straightforward because of the spectral reflectance and absorption
properties of water. Light in the
near and middle infrared parts of the spectrum is almost entirely absorbed
by water, making water distinctly different in spectral response from surrounding
areas of vegetation, soil, and rock. The
general mapping method will be the same, regardless of image source. We will use ISODATA clustering to create 100
clusters of statistically similar pixels throughout the image. Next, we will assign each cluster to a water
or non-water class, creating a raw base map of surface water for the image.
After creation of the raw base map of surface water, we will “prune”
it using heads-up digitizing to eliminate any unwanted features.
This primarily will be a visually-based editing process, relying on
traditional air photo interpretation procedures and feature characteristics
such as shape, site, and situation. Accuracy
assessment will employ both Digital Orthoquads (DOQs) and ground verification
visits.
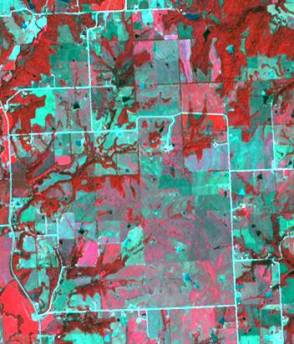
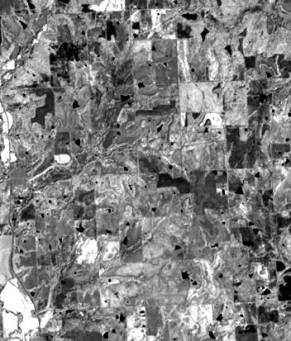
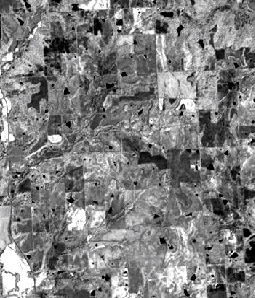
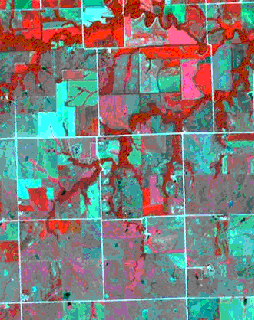
Examples of two ASTER scenes in eastern Kansas are
shown below.
|
|
|
|
ASTER
Imagery for an area in Jefferson County in northeast Kansas. Left: false color composite. Right: near-infrared band. Click Left
or Right for full-size images. |
|
|
|
|
|
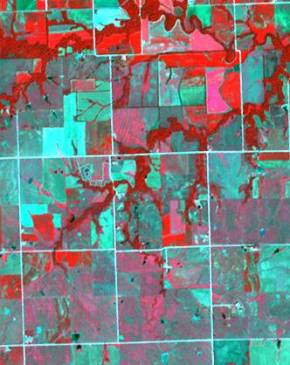
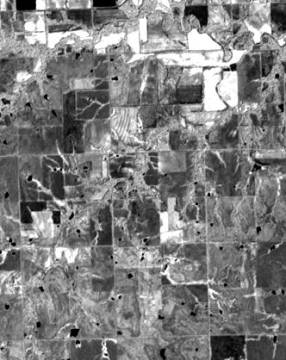
ASTER
Imagery for an area in southern Lyon County in the Flint Hills. Left: false color composite. Right: near-infrared band. |
|