|
|
|
|
KGS, Open-file Report 96-39 |
by Exploration Services Section
Kansas Geological Survey
KGS Open File Report 96-39
September 1996
The Kansas Division of Water Resources (DWR) and the Kansas Geological Survey (KGS) are the primary sponsors of the Statewide annual water level measurement program (Woods and Schloss, 1996). The annual measurements are taken in about 1,500 wells located predominantly in central and western Kansas. Each year's data, in conjunction with the over 50 years of historical records, represents a critical part of resource management of the High Plains Aquifer as well as several other aquifer systems in Kansas. The acquisition of the water level data is jointly undertaken by the DWR and USGS (funded through a cooperative agreement with the KGS) with the DWR responsible for about two-thirds of the yearly data set while the USGS records the remaining one-third (Figure 1). These annual measurements are nominally taken during the months of January and February in stock wells, irrigation wells, abandoned wells, and monitor wells. The data acquired during these yearly measurements are tabulated by the KGS to establish trends and allow evaluation and judgments for effective water resource management.
Figure 1--Spatial distribution and responsible agency of annually measured wells.
Annual water level measurements taken by the USGS through their Garden City, Kansas, office are sponsored by the KGS through a yearly cooperative agreement. The USGS measured 496 water levels that were included in the 1995 annual data base. These 496 measurements were distributed across 17 counties predominantly in the southwestern portion of the state (Figure 2). The wells measured are selected based on several criteria:
Figure 2--Counties currently measured annually by USGS through KGS cooperative.
Well selection decisions are, in most cases, a collaborative effort between the agencies and groups involved. Since the annual measurements are taken between December and February, seasonal variations in water levels as well as short-term fluctuation from sporadic heavy use should be minimized in the data set. Quality assurance and quality control (QA/QC) is a process that relies on experience, judgments about downhole conditions, interpretations of measurement criteria, and in-field calculated water levels compared to years previous and other current local readings. Acquisition QA/QC relies heavily on judgments based on visual comparison of in-field tabulations and physical characteristics/conditions.
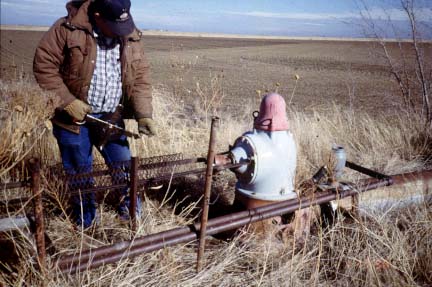
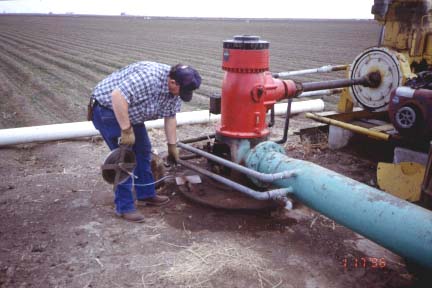
The current acquisition methodology is well established and has been in use for the last 50 years. To some degree the measurement technique has been unchanged for several decades, as dictated by physical limitations both at the surface and within the borehole in the wells that make up the data base. Most measurements are taken in irrigation wells where access is limited by both surface and downhole pumping equipment (Figure 3). Abandoned wells and some livestock wells also provide a challenge to measure since, when properly maintained, they will have a semi-permanent seal on top the casing (welded plate, locked cap, etc.) (Figures 4, 5, and 6). Access to the piezometric surface in most measured wells is through access tubes, threaded plug holes, or open slits in the wellhead base with no possibility for direct vertical access through any kind of removable well head or cap (Figures 7 and 8). These small openings (generally <1") are in the side of the well head or in access tubes or slant pipes through the well curb/pad (Figures 9 and 10). In most cases the measuring device must make a 90-degree bend to get parallel to the well bore at or near the ground surface. In many cases several access points are available, but for consistency reasons measurements can only be made through a particular opening.
Figure 3--Wellhead and engine configuration for standard irrigation unit.
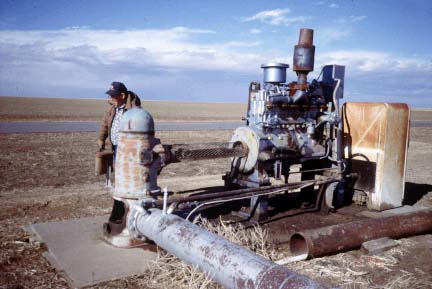
Figure 4--Abandoned stock well with plate welded on surface casing.
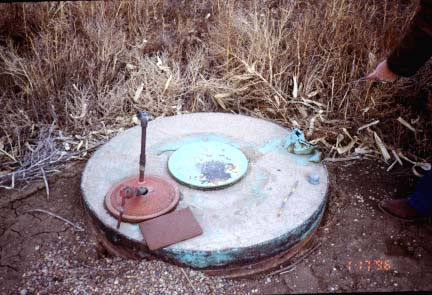
Figure 5--Abandoned irrigation well located in brush and weed area.
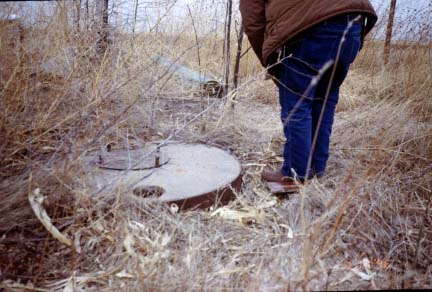
Figure 6--Unused stock well with windmill style power system.
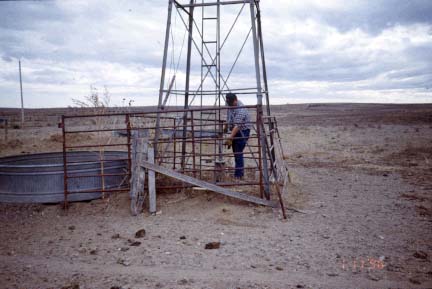
Figure 7--Slant pipe access to well casing.
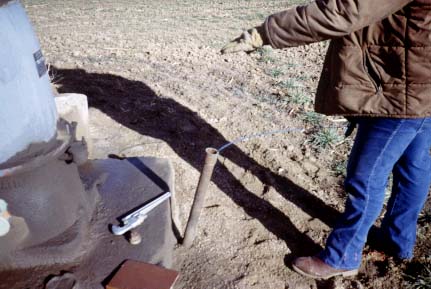
Figure 8--Casing access through plug hole at the base of the wellhead.
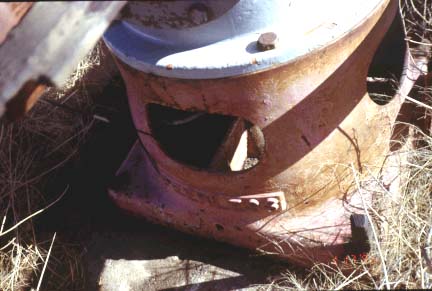
Figure 9--Access into stock well through 1" long by 1/4" wide slit in welded casing lid.
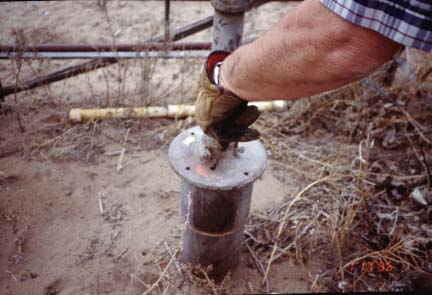
Figure 10--Lowering tape at offset angle through plug hole on the base of the pump unit.
Prior to actually measuring water levels, sufficient information must be generated to locate the well, allow calculation of a historically comparable water level, and accommodate as much in-field QA/QC as possible. The USGS generates and makes available all pertinent historical data to field measurement staff in yearly updated county field books. These field books contain the following information:
Not all wells have a complete set of information for reasons ranging from not applicable to never documented. Locating wells for measurement is usually accomplished using county maps with each well located by hand and drawn onto the map with its alpha/numerical location in terms of section, township, and range. The well location maps and field notebooks are prepared prior to the field crew departing for field measurements. The field staff rely on roads, railroad tracks, towns coordinated to map locations, and well coordinates to locate wells. Once a well has been located the field staff try to verify the well location with the field book descriptions and vehicle travel mileage (odometer) since last map-confirmed location. Generally a month or two in advance of beginning the measurement activities each landowner is contacted for permission to measure the well, any updated information on the well, and an approximate measurement date.
The water level measurements are taken in most wells with a steel tape lowered down the well bore assisted by a lead weight attached to the end of the tape with copper wire (Figure 11). The lead weight serves two purposes: first, it minimizes the effects of tape coil down hole; and second, if the lead weight and copper get hung up and lost down hole it will not (at least not to date) interfere with the operation of an irrigation water pump (generally turbine type). A steel tape used for measurements in southwestern Kansas needs to be able to reach depths of over 400 ft. Tapes used by the USGS are generally 300 ft in total length with extensions to allow for 300+ foot measurements. The steel tapes are annotated from 30 ft to 300 ft at one-foot intervals with embedded plates displaying the length from the end of the tape. Between the end of the tape and 30 ft the face of the tape is marked with raised marking indicating feet, inches, and tenths of inches.
Figure 11--Lowering tape through slant pipe in well platform.
Measurements are taken by applying a coating of carpenter chalk (generally blue) to the lower 30 ft or so of the tape (Figure 12). The tape and end weight are coaxed through the small access port and generally around a sharp corner and then slowly down alongside any equipment in the well bore to a stop depth (Figure 13). The stop depth (length of tape in hole) is established based on previous years' water level values and measured drop in the current year's water table in nearby wells. Once the appropriate depth is reached and the tape has hung in the hole for a second or two, the tape is reeled back onto the tape reel. Once the portion of the tape is reached with annotations in tenths of inches, each inch of the chalked surface is carefully examined to establish the location of the "cut." The cut is the line below which the chalk has been washed away by water standing in the well (Figure 14). The cut marks the water table or peizometric surface. The quality of the cut is then established. The cut can be sharp with no indications of wash off above the line, and in such a case it would be considered a good measurement. The cut can also be very difficult to establish due to everything from cascading water within the borehole to casing moisture contacted during the placement or extraction of the tape. The qualitative determination of confidence in the cut is the first QA/QC taken during the measurement process. If the measurer is confident a good reading has been made, the stop depth and cut line are recorded in the field notebook.
Figure 12--Appliction of carpenter chalk to tape.
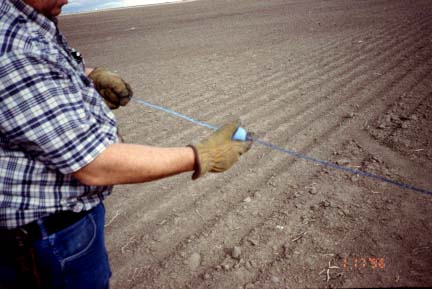
Figure 13--Side plug hole entry with weight on end of tape to minimize coiling downhole.
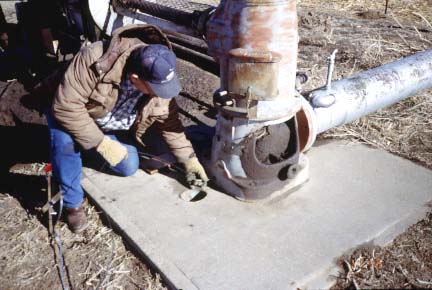
Figure 14--Cut line is identified by missing chalk from tape resulting from washoff.
The final in-field estimation of confidence in a water level measurement requires differencing of the previous year's water level with the current measured level to establish a water table draw-down or recovery. The relative change in water level in a particular well is then compared to the local draw down or recovery trend as established by wells in close proximity that have been measured in the current year. The information necessary to accomplish the in-field calculation of difference in water table depth between consecutive years includes:
If, in the judgment of the field staff, the relative difference between the current year and previous year's measurements are reasonably close, the value is logged, considered a good reading, and the well is tagged.
Each well measured is tagged with a thick paper tag attached to the well with a wire tie. The tag identifies the measurement participants (i.e., U.S. and Kansas Geological Surveys, the Division of Water Resources, KSBA). It also documents the well location, depth/water, date, and initials of measurer. The tag also displays the name and address of the USGS Garden City Office if inquiries are necessary. The tags are seasonal with the average lifetime of a tag ranging from 3 to 6 months. The tagging is the last operation to take place at the well prior to proceeding to the next well location.
All measurements and observations are recorded the county field log books. These log books are transcribed into a digital file at the Garden City Office of the USGS within a few months of the actual measurements. These digital data are then provided to the KGS for tabulation, collation, and inclusion in the annually published water level report.
The information for this report was developed during a program observation trip by Rick Miller, Joe Anderson, and David Laflen on January 17, 1996. This report was prepared by Rick Miller with document and graphic assistance from Mary Brohammer, P. Acker, and John Siceloff. Curt Sauer of the USGS Garden City office graciously allowed the KGS staff to accompany him and two of his water level measurement staff to Haskell, Gray, and Kearny Counties during what was suggested to be fairly routine data acquisition day.
Woods, J.J., and Schloss, J.A., 1996, January 1996 Kansas water levels and data related to water-level changes: Kansas Geological Survey Technical Series 9, 124 pp. [Note: dates of 1966 in file copy are not correct.]
Kansas Geological Survey, Water Level Project
Comments to webadmin@kgs.ku.edu
Placed online Jan. 2006
Available online at URL = http://www.kgs.ku.edu/Hydro/Levels/OFR96_39/index.html