Kansas Geological Survey, Open-file Report 2001-35
by
Jianghai Xia, Evan K. Franseen, Richard Miller, and Thomas Weis
KGS Open File Report 2001-35
Resolution is key to confidently identifying unique geologic features using ground-penetrating radar (GPR) data. Source wavelet "Ringing" (related to bandwidth) in a GPR section limits resolution because of wavelet interference, which can cause smearing, splitting, and/or misplacing reflections in time and/or space. The resultant potential for misinterpretation constrains the legitimate usage of GPR. Deconvolution has the possibility to compress the source wavelet and improve temporal resolution. Unlike statistical deconvolution, deterministic deconvolution is mathematically simple and stable while providing the highest possible resolution because it uses the source wavelet unique to the specific radar equipment. Instrument wavelets generated in, transmitted through, and acquired from air allow successful application of deterministic approaches to wavelet suppression. The best deconvolution results for the "400 MHz" antenna test was observed for wavelets acquired when the transmitter and receiver were separated by 0.3 m. The validity of using a source wavelet acquired in air as the operator for deterministic deconvolution was demonstrated in a real-world application using 400 MHz antennas at a quarry site characterized by interbedded limestones with shale partings. GPR data were collected on a bench adjacent to cleanly exposed quarry faces where conductive rods were strategically placed to provide conclusive groundtruth of this approach to deconvolution. Deterministic deconvolution improves resolution by at least 50% with no apparent spatial error or skew in the rod locations. The effectiveness of deterministic deconvolution for increased resolution and spatial accuracy of specific geologic features is further demonstrated by comparing results of deconvolved data with non-deconvolved data acquired along a 30-m transect immediately adjacent to a fresh quarry face. Our results support using deterministic deconvolution, which incorporates the GPR instrument's unique source wavelet, as a standard part of routine GPR data processing.
Over the last decade ground-penetrating radar (GPR) has been widely used in environmental, engineering, and groundwater investigations (e.g., Arcone et al., 1992; Arcone et al., 1998; Beres and Haeni, 1991; Olhoeft et al., 1994; Powers and Olhoeft, 1996a; 1996b; Annan, 1996; Young et al., 1997; Powers, 1997; Cardimona et al., 1998; Asprion and Aigner, 1999; Butler et al., 2000) as well as shallow sedimentary, stratigraphic, and glacial studies (Arcone, 1996; Smith and Jol, 1992; Pratt and Miall, 1993; Gawthorpe et al., 1993; Beres et al., 1995; Bridge et al., 1995; Jol et al., 1996; Sigurdsson and Overgaard, 1996; Liner and Liner, 1997; McMechan et al., 1997; 1998; Martinez et al., 1998a; 1998b; Welch et al., 1998; Young and Sun, 1999; Young et al., 1999; Vandenberghe et al., 1999; Beres et al., 1999; Augustinus et al., 1999; Dagallier et al., 2000; Kruse et al., 2000; Bano et al., 2000; Van Dam and Schlager, 2000; Moran et al., 2000). These studies provide insight into, and in general demonstrate the promise, application, and usefulness of GPR for geologic, environmental, and engineering studies.
Accurate interpretation of geologic features from GPR data depends on data resolution. Ringing (related to bandwidth) in a GPR section negatively impacts resolution and therefore must be identified and reduced/eliminated. Ignored ringing in radar data constrains the legitimate usage of GPR and increases the potential for misinterpretations. Deconvolution is essential to increasing the temporal resolution that is critical for shallow stratigraphic studies and allowing correct interpretation of GPR data. A few studies have successfully applied a statistical approach to deconvolution of GPR data (Turner, 1992; Todoeschuck et al., 1992; Neves et al., 1995; Gottsche et al., 1996; Porsani and Ursin, 1996; Arcone et al., 1998; Moran et al., 2000). However, deconvolution has rarely been used successfully in GPR studies at real-world sites due to complexities of multiple reflections not accounted for in statistical deconvolution approaches and assumptions inherent to most deconvolution models.
During our multi-phase integrative study at the quarry site designed to address stratal, lithologic, petrophysical, and geophysical properties influencing GPR response, it became evident that we needed to develop new strategies and methods that allowed more accurate application of GPR to sedimentary rock studies than currently practiced. This paper focuses on a method designed to eliminate ringing effects in real-world GPR data using deterministic deconvolution (p. 93, Yilmaz, 1987). This form of deconvolution eliminates the assumptions inherent in statistical deconvolution approaches and, therefore, results in data dominated by the earth reflectivity series with little source wavelet effects.
Our study developed a convolution model using a GPR instrument wavelet acquired in the air. The accuracy of the wavelet was verified by using it during deterministic deconvolution of GPR data acquired on a bench overlying Pennsylvanian limestone and interbedded thin shale layers that were exposed in a quarry near Bonner Springs, Kansas (Figure 1). Quarry faces were mapped and correlated to GPR data from four successive faces as they were exposed during standard quarry activities. We inserted conductive metal rods, 1.5 in in length, into horizontal drill holes placed at key locations in exposed quarry faces to provide easily identifiable signatures on GPR profiles and to serve as known reflecting/diffracting points (Xia et al., 2001; Franseen et al., 2001; Butler et al., 2000). The steel rods provide critical information for: 1) correlation between reflections on GPR data and geologic features exposed in the quarry face, 2) GPR resolution limits, 3) accuracy of velocities calculated from common midpoint (CMP) data, and 4) identifying multiples. Our results have significant ramifications to both improving the use (accuracy) of GPR data and interpreting stratigraphy from GPR sections where successful suppression of wavelet effects is critical.
Figure 1--Drawing showing the 30 m by 30 m two-dimensional grid that was designed on a flat bench behind an initial quarry face (BSG1) approximately 2.7-3.5 m (9-12 feet) thick. Successive quarry face exposures and twelve cores, provided initial groundtruth for GPR interpretations.
Deconvolution is a numerical process to compress the basic source wavelet, thereby improving temporal resolution. There are many different deconvolution methods with application histories in seismic reflection data processing (Yilmaz, 1987). Deconvolution has also been applied to GPR data in hopes of improving resolution in a fashion consistent with conventional seismic reflection. Different types of deconvolution applied to GPR data include a propagation deconvolution method (Turner, 1992 and 1994), a predictive deconvolution method (Todoeschuck et al., 1992), a two-sided deconvolution method (Gottsche et al., 1996), and a mixed-phase deconvolution method (Porsani and Ursin, 1996), source signature deconvolution (Neves et al., 1995). Recently, Arcone et al. (1998) and Moran et al. (2000) successfully applied a Wiener deconvolution filter (Yilmaz, 1987) to improve the temporal resolution of GPR data. The deconvolved data showed broadening of wavelet bandwidth. All of these deconvolution methods require that assumptions be made about the source wavelet and/or extraction of source wavelet from GPR data and the source wavelet was statistically determined in their method.
If all frequencies are present and represent signal, spiking deconvolution provides the greatest resolution possible for GPR data. Spiking deconvolution assumes the earth reflectivity is a random process and the source wavelet is infinitely broad band (Yilmaz, 1987). Spiking deconvolution is consistently applied to GPR data because the method requires no prior knowledge of the source wavelet, only the assumption that all frequencies are present in the waveform. However, the bandwidth and signal-to-noise characteristics of GPR data and the sparsity of the earth's near-surface reflectivity series violates the basic assumptions of spike deconvolution.
Alternatively, deterministic deconvolution (p. 93, Yilmaz, 1987) is numerically the simplest and most stable of all types of deconvolution and is equivalent to spiking deconvolution when an instrument wavelet is available.
Assuming no noise, GPR data are the convolution of the instrument or source wavelet with the earth's reflectivity series:
x(t) = w(t)*e(t) (1)
where
x(t) = recorded GPR data
w(t) = instrument wavelet
e(t) = earth's reflectivity series
* = denotes convolution.
If the instrument (source) wavelet is known, the solution to the deconvolution problem (1) is called deterministic deconvolution (p. 93, Yilmaz, 1987). In the frequency domain, Eq. (1) can be written as
X(f) = W(f)E(f) (2)
where X(f) = the Fourier transform of x(t) W(f) = the Fourier transform of w(t) E(f) = the Fourier transform of e(t).
If w(t) is acquired and its spectrum W(f) does not go to zero within a specific range, an earth reflectivity series can be determined using a deterministic deconvolution
E(f) = X(f)/W(f) (3)
and the inverse Fourier transform
e(t) = F-1[(f)] (4)
where
F-1 = the inverse Fourier transform.
The fact that the instrument wavelet does not change either from place to place or as a function of antenna ground coupling is an important benefit with this method. Hence, the method has the potential to provide the highest possible resolution independent of data characteristics. Once the wavelet is known it never has to be measured again. In the next section an appropriate methodology is demonstrated for successfully acquiring the GPR instrument (source) wavelet, which is the basis of deterministic deconvolution.
We acquired GPR data for this study by using a MALÅ system with a 370-V transmitter, 400 MHz antennas (producing 300 MHz signals), and 3348 MHz sampling frequency. We processed the data using WinSeis©(a commercial software package developed at the Kansas Geological Survey) complemented with some custom code.
Acquisition of a clean instrument wavelet is critical to the effectiveness of deterministic deconvolution. Instrument wavelets were acquired in an open field that was void of environmental and/or culture noise. Initially, to capture the source wavelet, a signal search (a standard step of using the MALÅ system before data acquisition) was performed with the transmitter antenna and receiver antenna separated by 0.3 m, 0.6 m, and 0.9 m using the conventional orientation of face down on the ground (Figure 2a). The actual source wavelets were acquired by placing the antennas face to face with separation of 0.3 m, 0.6 m, and 0.9 m (Figure 2b). A 512-fold vertical stack minimized the contribution of random noise during the acquisition of a representative wavelet. Empirical determination of the optimum wavelet for the MALÅ instrument was accomplished through repetitive applications of deterministic deconvolution to a test data set using source wavelets recorded at each unique offset while the antennas were face to face. For example, the wavelet extracted with 0.3-m separation during signal search and 0.3-m separation in wavelet acquisition produced the best deconvolution results for 400 MHz antennas. The well-behaved spectrum of the 400 MHz antenna wavelet (no zero or near-zero values in the designed frequency range spectrum) and a dominant frequency of 300 MHz (Figure 3) allowed direct and stable application of deterministic deconvolution (Eq. 3) to GPR data. A spike-like wavelet (Figure 3c and 3d) was obtained by applying deterministic deconvolution to the instrument wavelet (Figure 3a). The width of the spike-like wavelet (Figure 3c) is much less that one half of the source wavelet (Figure 3a). Therefore, we would expect data resolution could be doubled after deterministic deconvolution.
Figure 2--(a) A transmitter antenna and a receiver antenna of the MALÅ system were placed on the ground to perform a signal search. (b) Both antennas were placed face to face to acquire wavelets in the air.
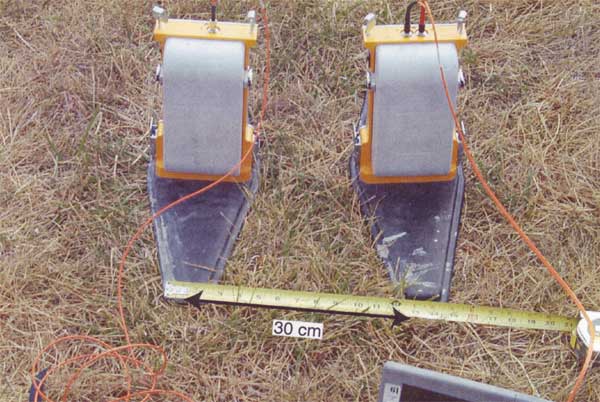
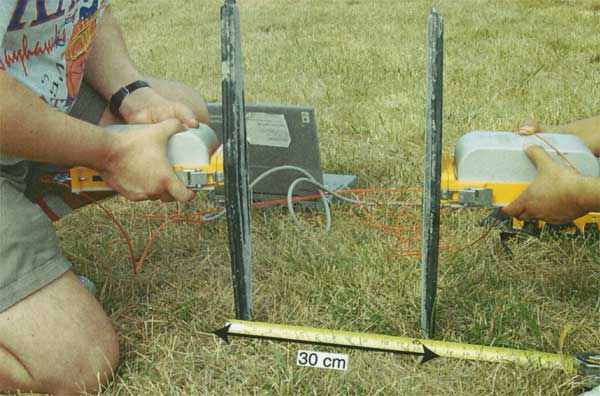
Figure 3--(a) The wavelet of the 400 MHz antennas with 0.3 in separation in signal search and 0.3 m separation in wavelet acquisition, (b) its spectrum, (c) the wavelet shown in (a) after deterministic deconvolution, and (d) its spectrum.
The best deconvolution results for wavelets from the 200 MHz antennas were obtained with 0.9-m separation in the signal search and 0.9-m separation in wavelet acquisition. Accurate aiming of antennas for air acquisition is critical, especially for lower frequency antennas such as 100 MHz or 50 MHz.
Since wavelets acquired in the air are true instrument wavelets, changes in geologic setting have no impact on the convolution model used by deterministic deconvolution operation. Therefore, once a representative wavelet is cataloged for each antenna, that wavelet can be used in all geologic settings and for all applications until the antenna is physically altered or electronically modified.
Since the width of the main peaks of wavelets from the 400 MHz antenna (Figure 3a) is 5-6 nanoseconds (ns), any reflected events with time duration equal to or longer than the width of the main peaks will interfere with each other, smearing, splitting, and/or misplacing reflections in time and/or space. Study at a real-world stratigraphic site verifies that once the instrument wavelet has been removed (Figure 3c) from the GPR data by deterministic deconvolution, temporal resolution will increase and the true position of reflections can be accurately determined.
We used fresh exposures of Pennsylvanian carbonate strata from the upper Farley Member in the Shawnee Rock Company quarry near Bonner Springs, Kansas, to demonstrate the effectiveness of applying deterministic deconvolution for improved temporal and spatial resolution of GPR data. These strata are vertically exposed for approximately 3 meters on the quarry face and characterized by medium (<0.15 m) to thickly (0.3-0.9 m) bedded limestones separated by thin (<2.5 cm) shale partings and stylocumulates (material that passively accumulated as insoluble residue along a pressure-solution surface) (Figure 4). The shale partings and stylocumulates commonly diffuse into adjacent limestone over the scale of <2.5 cm to approx. 7.5 cm. The limestone beds are composed of well-cemented skeletal wackestone and packstone consisting predominantly of phylloid algae, bryozoans, brachiopods, and, locally, algal-coated grains (Osagia) in a matrix of micrite, peloidal micrite and microspar. They are interpreted to have been deposited in low- to moderate-energy marine environments (McKirahan et al., 2000). A characteristic of upper Farley strata is the lateral continuity of the generally horizontal bedding. Shale partings and stylocumulates at bedding planes are generally consistent, but locally come and go laterally (Figure 5).
Figure 4--Thin shale partings and stylocumulates that typically occur at limestone bedding planes and reflect GPR signals. The shale partings are commonly diffused into adjacent limestone over the scale of <2.5 cm to approx. 7.5 cm. Distance between shale layers on photo is 17.5 cm.
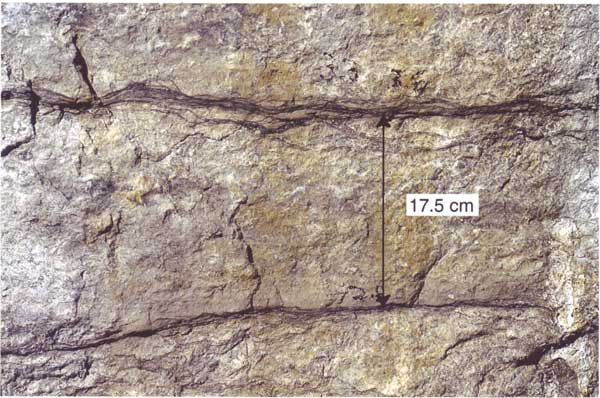
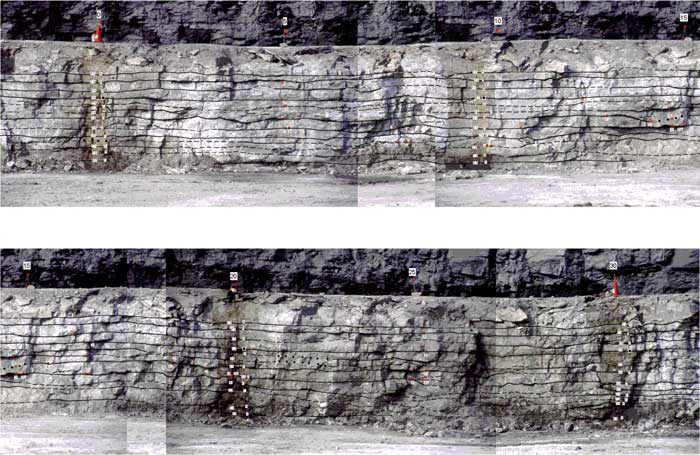
Figure 5--Photomosaic showing nature of limestone bedding and shale partings on the first quarry face (BSG1). Numbers at bedding horizons show scale in feet as measured vertically from quarry floor. Numbers along the top of quarry face are distances in meters. Letters and symbols are assigned to beds to facilitate comparison between the outcrop and results of GPR data. Orange dots and associated numbers show locations for horizontal conductive rod experiments. This figure is also available as a larger Acrobat PDF version.
We initially collected GPR data on a flat bench immediately behind a quarry face (BSG1) along a two-dimensional grid 30 m by 30 m (Figure 1). We profiled seven lines parallel to the quarry face and seven lines perpendicular to the quarry face, each separated by 5 m and recorded using 50 MHz, 100 MHz, 200 MHz, and 400 MHz antennas. We acquired a 128-fold vertical stack every 0.1 m along each line while maintaining a fixed source and receiver separation of 0.6 m with the 400 MHz antennas. A perpendicular-broadside antenna orientation was employed to give the radar section more of a 2-D slice through the subsurface (Annan, 1996).
Initial groundtruthing of GPR data was accomplished by mapping geologic features exposed as quarry operators blasted back at 10-m intervals in coordination with our 3-D grid and borehole (core) locations (Figures 1, 5). We inserted steel rods 1.5 m in length and 4.4 cm in diameter into holes drilled horizontally into the quarry face to provide direct groundtruth. A total of 78 horizontal holes were located at key spots on three exposed quarry faces, BGS1, BGS2, and BGS3 (Figure 1).
A specially designed horizontal air drilling unit provided holes with tolerances that required the rods to be driven snuggly into place. GPR data were acquired before and after the conductive steel rods were placed in the holes. Reflections/diffractions from the rods on GPR data provided the exact locations of the subsurface being imaged, which, through comparisons to the measured rod locations in the quarry face, provide exact correlation of reflections to reflectors. For the purpose of this paper, focus is placed on the results of several experiments conducted on the initial quarry face (BSG1) and third quarry face (BSG3).
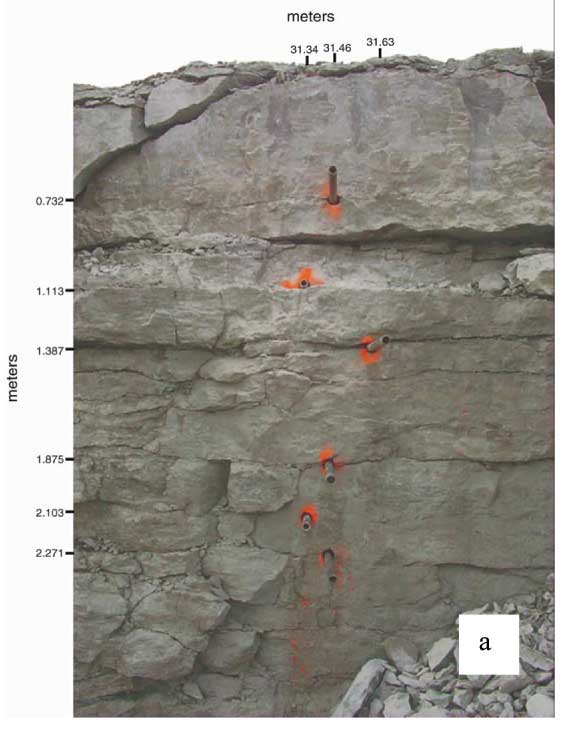
One experiment consisted of six vertically aligned steel rods in quarry face BSG3 (Table 1 and Figure 6a). We acquired GPR data along a 6-m line, 1 m behind the quarry face containing the steel rods. The conductive rods appear as hyperbolas on GPR data. Although the apex of the hyperbolas should be indicative of the precise location of the rods, the locations (horizontal and vertical) of the apex of the hyperbola on the non-deconvolved GPR data are skewed compared to the true rod locations (Figure 6B). The average velocity of EM wave propagation in the limestone at this site is 0.1 m/ns, which for the 400 MHz antenna equates to a maximum potential vertical resolution of around 0.25-0.30 m (Figure 3a). Theoretically, two reflectors closer than 0.25-0.30 m will not be resolvable. With this limitation in resolution, the six rods on the nondeconvolved GPR data can only be located within confidence of ±0.1 m vertically and ±0.2 m horizontally (Figure 6b).
Table 1--Locations of Horizontal Rods.
| Number of hole | Horizontal (m) | Vertical (m) |
|---|---|---|
| 1 | 31.46 | 0.732 |
| 2 | 31.34 | 1.113 |
| 3 | 31.63 | 1.38 |
| 4 | 31.46 | 1.875 |
| 5 | 31.34 | 2.103 |
| 6 | 31.46 | 2.271 |
Figure 6--(a) A photo of part of quarry face BSG3 containing six horizontal holes with steel rods, (b) GPR data, scaled and bandpass filtered, with the 400 MHz antennas along 6-m line on the bench 1 m behind the quarry face, and (c) GPR data after the deterministic deconvolution.
In contrast, after including deterministic deconvolution in the processing flow (Figure 6c), the apexes of the four shallowest hyperbolas distinctly and correctly represent the locations of the corresponding four rods both horizontally and vertically. Using a normal moveout velocity calculated from a nearby CMP gather (0.097 m/ns), the true depths of the first four rods can be located within a few centimeters from the GPR data. It is now also possible to locate the two deepest rods (numbers 5 and 6) even though based on conventional wisdom they would be considered relatively deep (considering their size and penetration limitations for antennas of this frequency) and less than one-quarter wavelength apart.
The improvement in resolution after deterministic deconvolution is further demonstrated using a single ray trace from the GPR data (Figure 7). The shallowest five rods, labeled as 1, 2, 3, 4, and 5, clearly correlate to negative peaks after using deterministic deconvolution (Figure 7--top). Only the deepest rod (6) is not confidently correlated to a negative peak. In comparison, we were not able to confidently identify any of the six rods on the non-deconvolved GPR data (Figure 7--bottom).
Figure 7--Trace 38 from Figure 6b (left) and Figure 6c (right). After the deterministic deconvolution, the negative peaks of the trace (top) labeled 1 to 5 are corresponding to steel rods 1 to 5 correctly. The air wave and the ground wave are labeled as A and G (top), respectively. These relationships are not clear in the trace before deterministic deconvolution (bottom).
In another experiment, we placed ten steel rods laterally along the BSG1 face at the bed E and bed D horizons (Figures 5, 8). GPR data were again acquired along a line one-meter behind the quarry face. Some reflections on non-deconvolved GPR data (Figure 8a) appear to correlate the stratigraphy shown on the photomosaic, however much of the GPR data are very difficult to interpret correctly due to the dominance of a very complex arrival pattern characteristic of wavelet interference, and possible out-of-the-plane energy. Based on the on the results of the first steel rod experiment discussed earlier, many of these complexities are a byproduct of the data resolution and associated wavelet interference, which makes it difficult to interpret most of the bedding on this section. The locations of the ten rods are labeled in Figure 8 based on field spatial measurements. Due to the limited temporal resolution of non-deconvolved GPR data (Figure 8a), locations of some of the 10 horizontal steel rods on beds E and D of the BSG1 face cannot be confidently determined.
Resolution of the GPR image is considerably increased after deterministic deconvolution (Figure 8b). Diffractions from the rods on the deconvolved data are clearly identified and indicate: 1) reflection events in these GPR data are from specific geologic features (multiples are absent). This is exemplified by clear reflection events at the E and D horizons along the entire trace; and 2) the locations of geologic features are spatially accurate. Beds E and D along the BSG1 face are spatially accurate along the entire deconvolved GPR trace as confirmed by measurements from the quarry face.
Figure 8--Ten steel rods were drilled into beds E and D. Two rods (number 2 and 3 from the left) were on bed D and the rest on bed E. (a) GPR data produced with 400 MHz antennas along a 30-m line on a flat bench 1 m behind quarry face BSG1 after AGC and bandpass filtering have been applied. (b) The same GPR data as shown in (a) after deterministic deconvolution. Solid dots indicate the locations of steel rods. This figure is also available as a larger Acrobat PDF version.
CMP data with 60-trace gathers and maximum source and receiver antenna separation of 6 m were acquired at eleven intersection points of the GPR survey grid. Time to depth conversions (Figure 8) are based on EM wave propagation velocities calculated from moveout curves on the CMP data. Accuracy of these conversions was confirmed by comparing surveyed horizontal rod locations along the BSG1 face with locations calculated from the GPR measured velocity.
Lines drawn on a photomosaic show bedding characteristics of the limestones and shales observed during field studies of the exposed quarry face (Figure 5). Solid lines represent distinct, traceable bedding planes (shale partings), dashed lines reflect less distinct bedding planes (shale partings are thinner or more diffuse), and dotted lines represent nondistinct, inferred bedding planes (absence of shale). Letters and symbols are assigned to beds to facilitate comparison between the outcrop and GPR data. Edge effects due to the quarry face were not evident on the profile 1 m behind the quarry face. This observation was made after comparison of two GPR data sets acquired along the same line before and after the blasting of successive quarry faces (Xia et al., 2001).
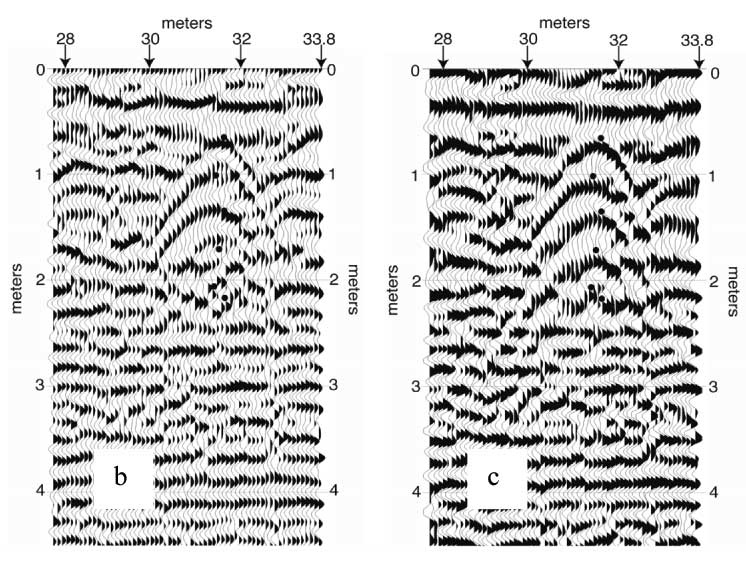
Due to the limited temporal resolution of non-deconvolved GPR data (Figure 9a), locations of some of the 29 horizontal steel rods (not marked) on the BSG1 face cannot be determined with confidence.
Figure 9--(a) GPR data along a 30-m line on a flat bench 1-m behind quarry face BSG1 after AGC scaling and bandpass filtering have been applied. (b) The same GPR data as shown in (a) after deterministic deconvolution, and (c) the GPR data after the deterministic deconvolution and Stolt migration. Letters correspond to beds shown on Figure 5. This figure is also available as a larger Acrobat PDF version.
As we mentioned earlier in this paper, the maximum potential vertical resolution is around 0.25 m-0.30 m at this site. Because GPR data after deterministic deconvolution (Figure 9b) clearly defined beds that are about 0.18 m thick (top three beds) and 0.15 m thick (the bed between D and F under the 10-m mark), resolution of the GPR image is increased at least 50%. Migration can also improve resolution of GPR data (Welch et al., 1998). Migration was used to suppress random noise (Ivanov et al., 1998). Stolt (1977) migration, with a constant velocity of 0.1 m/ns, resulted in the section shown in Figure 9c.
Time to depth conversions (Figure 9) are based on EM wave propagation velocities calculated from moveout curves on the CMP data. Accuracy of these conversions was confirmed by comparing surveyed horizontal rod locations along the BSG1 face with locations calculated from GPR data. This ultimate groundtruthing (surveyed conductive rods driven into the quarry face) confirms that the deterministic deconvolution approach to processing GPR data improves the resolution of GPR data.
Comparing some general characteristics of the documented quarry face with the deconvolved data (Figures 9b, 9c) contrasted with the non-deconvolved data (Figure 9a) further highlights the effectiveness of this type deconvolution. Beds *, •, E, and X are distinct, laterally traceable beds with bedding planes characterized by relatively thick shale partings (Figure 5). Consistent with reflectivity estimations, these horizons should be, and are, strong, laterally continuous reflections on deconvolved and migrated GPR data (Figure 9c). However, these horizons are neither distinctly identifiable nor laterally continuous on non-deconvolved data (Figure 9a).
Beds A and B are distinct, laterally traceable horizons on BSG1 quarry exposures, with bedding planes characterized by lateral variations in shale concentration. Based on the lateral variations with shale concentration, these beds would be expected to possess some variability in reflection wavelet character as a function of the differing shale concentrations. On deconvovled and migrated data, beds A and B are confidently identified and, as expected, their reflection character varies laterally (Figure 9c). Identification of beds A and B on non-deconvolved data is more complicated and requires identification of the more distinct * and • beds to use as a guide. However, the * and • beds are also a challenge to identify on non-deconvolved sections (Figure 9a).
Beds F, G, and H are distinct horizons that are traceable with varying degrees of confidence along the BSG1 quarry face. These beds are geologically characterized by lateral variability in bedding plane shale amounts and pinching and swelling geometries. Therefore, reflection characteristics of these horizons on GPR data should include laterally variable reflection amplitudes and geometric complexities. The general locations of beds F, G, and H can be confidently located on the deconvolved and migrated section when aided by location of the more distinct laterally continuous E and X bedding horizons (Figure 9c). As expected from the quarry face photo, relations from beds F, G, and H possess lateral variation in reflection character and geometric complexity (Figure 9c). In contrast, locations of beds F, G, and H are virtually impossible to confidently locate on non-deconvolved data due to overall complexity associated with wavelet interference and noise of GPR data at those depths (Figure 9a).
Finally, the beds between the E and • beds (including Z, C, and several unlabelled beds) are the most difficult to trace in outcrop, due to bedding planes that die out laterally, highly variable shale content along bedding planes, and geometric variability. Accordingly, GPR reflection characteristics and geometry for these horizons is very complex between E and • beds (Figure 9c). Confident identification of the general location of these complex horizons between the E and • beds provides the opportunity for further examination of the detailed associations of GPR reflection character and geology changes. In contrast, even speculative identification of even the general location of these complex bedded horizons between the E and • beds is virtually impossible on non-deconvolved data (Figure 9a).
The comparisons we have used in this paper illustrate the effectiveness of the deterministic deconvolution in improving resolution and providing a more accurate spatial representation of geologic features. This processing step significantly aids interpretation and sets the stage for more detailed analyses of complex GPR reflections and the variables controlling GPR attributes.
This study provides an example of how successful application of deterministic deconvolution increases resolution of GPR data. Key to this success was the capturing of the GPR instrument source wavelet, the use of conductive rods as markers, and access to multiple clean quarry exposures. Our study indicates that source wavelet interference in GPR data can be significantly suppressed using deterministic deconvolution.
GPR instrument (source) wavelets acquired in air (in an open outdoor setting devoid of natural and artificial noise) for the 400 MHz antennas (0.3-m spacing) possessed well-behaved spectral properties. Wavelets from antennas will vary to some degree from one instrument to the other, but once a wavelet is acquired and defined for a particular antenna, it can be permanently stored and used for all geologic settings and applications. Since wavelets acquired in air are true instrument wavelets, changes in the geologic material being imaged or coupled to will have no impact on the effectiveness of deterministic deconvolution in which these uniquely determined source wavelets are used.
The convolution model was verified by the deterministic deconvolution of GPR data acquired at a quarry site. Ultimate calibration of resolution and spatial accuracy of processed GPR data was obtained by inserting conductive steel rods into holes drilled horizontally into quarry faces. Verification studies confirmed data processed using deterministic deconvolution were far superior in all aspects tested over non-deconvolved GPR data. Applying deterministic deconvolution to GPR data collected in sedimentary strata at our study site resulted in an improvement in resolution (50%) and improved spatial location (0.10-0.15 m) of geologic features compared to the same data processed without deterministic deconvolution.
Using non-deconvolved GPR data to interpret geologic features, especially fine structural and stratigraphic characteristics, will likely result in inaccuracies and errors as a result of poor resolution, inclusion of geophysical artifacts, and spatial misrepresentations. This study verifies the necessity of including deterministic deconvolution in standard GPR data processing.
We thank Shawnee Rock, Inc., Bonner Springs, Kansas, especially Frank Rockers, and Owen Chrome, for kindly providing access to the quarry study site, cooperating in design of the project, and assistance during data acquisition. We thank S.A. Arcone, the Associate Editor, for his critical and constructive review. We thank Choon Park for valuable discussion during data processing. We also thank Mary Brohammer and Julia Shuklaper for assistance in preparation of this manuscript. This study was funded by the National Science Foundation (EAR 9912062) and the Kansas Geological Survey.
Annan, A.P., 1996, Ground penetrating radar (workshop notes): Sensors & Software Inc., Canada.
Arcone, S.A., Chacho, E.F., Jr., and Delaney, A.J., 1992, Short-pulse radar detection of groundwater in the Sagavanirktok River flood plain in early Spring: Water Resource Research, 28, 2925-2936.
Arcone, S.A., 1996, High resolution of glacial ice stratigraphy: A ground-penetrating radar study of Pegasus Runway, McMurdo Station, Antarctica: Geophysics, 61, 1653-1663.
Arcone, S.A., Lawson, D.E., Delaney, A.J., Strasser, J.C. and Strasser, J.D., 1998, Ground-penetrating radar reflection profiling of groundwater and bedrock in an area of discontinuous permafrost: Geophysics, 63, 1573-1584.
Asprion, U., and Aigner, T., 1999, Towards realistic aquifer models: three-dimensional georadar surveys of Quaternary gravel deltas (Singen Basin, SW Germany): Sedimentary Geology, 129, 81-297.
Augustinus, P.C., and Nichol, S., 1999, Ground-penetrating radar imaging of Pleistocene sediments, Boco Plain, western Tasmania: Australian Journal of Earth Sciences, 46, 275-282.
Bano, M., Marquis, G., Nivier, B., Maurin, J.C., Cushing, M., 2000, Investigating alluvial and tectonic features with ground-penetrating radar and analyzing diffractions patterns: Journal of Applied Geophysics, 43, 33-41.
Beres, M., Jr., and Haeni, F.P., 1991, Application of ground-penetrating-radar methods in hydrogeologic studies: Ground Water, 29, 375-386.
Beres, M., Green, A.G., Huggenberger, P., and Horstmeyer, H., 1995, Mapping the architecture of glaciofluvial sediments with three-dimensional georadar: Geology, 23, 1087-1090.
Beres, M., Huggenberger, P., Green, A.G., and Horstmeyer, H., 1999, Using two- and three-dimensional georadar methods to characterize glaclofluvial architecture: Sedimentary Geology, 129, 1-24.
Bridge, J.S., Alexander, J., Collier, R. E. Ll., Gawthorpe, R.L., and Jarvis, J., 1995, Ground-penetrating radar and coring used to study the large-scale structure of point-bar deposits in three dimensions: Sedimentology, 42, 839-852.
Butler, J., Franseen, E., Xia, J., Schulmelster, M., Zheng, L., Weis, T., Byrnes, A., Healey, J., and Miller, R., 2000, Experimental assessments of the utility of direct-push profiling and ground-penetrating radar for hydrostratigraphic investigations: SEPM/IAS research Conference Environmental Sedimentology Hydrogeology of Sedimentary Aquifers, Santa Fe, NM, September 24-27, 26-27.
Cardimona, S.J., Clement, W.P., and Kadinsky-Cade, K., 1998, Seismic reflection and ground-penetrating radar imaging of a shallow aquifer: Geophysics, 63, 1310-1317.
Dagallier, G., Laitinen, A.I., Malartre, F., Campenhout, I.P.A.M., and Veeken, P.C.H., 2000, Ground penetrating radar application in a shallow marine Oxfordian limestone sequence located on the eastern flank of the Paris Basin, NE France: Sedimentary Geology, 130, 149-165.
Franseen, E.K., Xia, J., Byrnes, A.P., Miller, R., Weis, T., and Washburn, E., 2001, Testing the Utility of Ground-penetrating Radar for Outcrop Reservoir Analog Studies: Am Example from Pennsylvanian Carbonate Strata in Kansas: 2001 AAPG Annual Convention Official Program, Denver, CO, p. A65.
Gawthorpe, R.L., Collier, R.E., Alexander, J., Bridge, J.S., and Leeder, M.R., 1993, Ground-penetrating radar--Application to sandbody geometry and heterogeneity studies: Geological Society, Special Publication no. 73, 421-432.
Gottsche, F.M., Stolte, C., and Nick, K.P., 1994, Two-sided deconvolution: a method to improve the temporal resolution in radar data: Extended abstracts of 56th meeting of European Association of Exploration Geophysicists, P049.
Ivanov, J., Miller, R.D., and Xia, J., 1998, High frequency random noise attenuation on shallow seismic reflection data by migration filtering: Technical Program with Biographies, SEG, 68th Annual Meeting, New Orleans, Louisiana, 870-873.
Jol, H.M., Smith, D.G., Meyers, R.A., and Lawton, D.C., 1996, Ground penetrating radar-High Resolution stratigraphic analysis of coastal and fluvial environments: Gulf Coast Section of the SEPM Foundation 17th Annual Research Conference on Stratigraphic Analysis, 153-163.
Kruse, S.E., Schneider, J.C., Campagna, D.J., Inman, J.A., and Hickey, T.D., 2000, Ground penetrating radar imaging of cap rock, caliche and carbonate strata: Journal of Applied Geophysics, 43, 239-249.
Liner, C.L., and Liner, J.L., 1997, Application of GPR to a site investigation involving shallow faults: Leading Edge, 16, 1649-165 1.
Martinez, A., Franseen, E.K., and Beaty, D.S., 1998a, Application of Ground-Penetrating Radar to Sedimentologic and Stratigraphic Studies: Examples from Pennsylvanian Siliciclastics and Limestones in Kansas: Proceedings Vol. 2, Seventh International Conference on Ground Penetrating Radar, University of Kansas, Lawrence, Kansas, p. 687-692.
Martinez, A., Kruger, J. M., and Franseen, E.K., 1998b, Utility of ground-penetrating radar in near-surface, high-resolution imaging of Lansing-Kansas City (Pennsylvanian) limestone reservoir analogs: Current Research in Earth Sciences, Kansas Geological Survey, Bulletin 241, part 3, p. 43-59. [available online]
McKirahan, J., Goldstein, R.H., and Franseen, E.K., 2000, Sequence Stratigraphy of the Lane-Island Creek Shales and the Farley Limestone in Northeastern Kansas and Geologic Factors Affecting the Quality of Limestone Aggregates: K-TRAN Report No. KU-97-1, 236 p.
McMechan, G.A., Gaynor, G.C., and Szerbiak, R.B., 1997, Use of ground-penetrating radar for 3-D sedimentological characterization of clastic reservoir analogs: Geophysics, 62, 786796.
McMechan, G.A., Loucks, R.G., Zeng, X, and Mescher, P., 1998, Ground penetrating radar imaging of a collapsed paleocave system in the Ellenburger dolomite, central Texas: Journal of Applied Geophysics, 39, 1-10.
Moran, M.L., Greenfield, R.J., Arcone, S.A., and Delaney, A.J., 2000, Delineation of a complexly dipping temperate glacier bed using short-pulse radar arrays: journal of Glaciology, 46, 274-286.
Olhoeft, G.R., Powers, M.H., and Capron, D.E., 1994, Buried object detection with ground penetrating radar: Proc. of Unexploded Ordnance (UXO) detection and Range Remediation Conference, Golden CO, May 17-19, 1994, 207-233.
Porsani, M. J., and Ursin, B., 1996, Mixed-phase deconvolution of seismic and groundpenetrating radar data: Annual Meeting Abstracts, Society of Exploration Geophysicists, 1603-1606.
Powers, M. H., 1997, Modeling frequency-dependent GPR: The Leading Edge, 16, 1657-1662.
Powers, M.H., and Olhoeft, G.R., 1996a, Computer modeling to transfer GPR UXO detectability knowledge between sites: Proc. UXO Forum 1996 Conference proceedings, Williamsburg, VA, March 26-29, 1996. Department of Defense Explosives Safety Board, Alexandria, VA, 347-356.
Powers, M.H., and Olhoeft, G.R., 1996b, Modeling of GPR response of leaking, buried pipes; in Bell, R.S., Cramer, M.H. (eds.), Proc. of SAGEEP 1996, Keystone, CO.: EEGS, Wheat Ridge, CO, 525-534.
Pratt, B.R., and Miall, A.D., 1993, Anatomy of a bioclastic grainstone megashoal (Middle Silurian, southern Ontario) revealed by ground-penetrating radar: Geology, 21, 223-226.
Sigurdsson, T., and Overgaard, T., 1996, Application of GPR for 3-D visualization of geological and structural variation in a limestone formation: Proceedings, Sixth International Conference on Ground Penetrating Radar, Sendai, Japan, 39-42.
Smith, D.G., and Jol, H.M., 1992, Ground-penetrating radar investigation of a Lake Bonneville delta, Provo level, Brigham City, Utah: Geology, 20, 1083-1086.
Stolt, R.H., 1977, Migration by Fourier transform: Geophysics, 43, 23-48.
Todoeschuck, J.P., LaFlèche, P.T., Jensen, O.G., Judge, A.S., and Pilon, J.A., 1992, Deconvolution of ground probing radar data; in Ground penetrating radar J. Pilon, ed.: Geological Survey of Canada, paper 90-4, 227-230.
Turner, G., 1992, Propagation deconvolution: in Fourth international conference on ground penetrating radar edited by Hanninen, P. and Autio, S., Geological Survey of Finland, 8593.
Turner, G., 1994, Subsurface radar propagation deconvolution: Geophysics, 59, 215-223.
Van Dam, R.L., and Schlager, W., 2000, Identifying causes of ground-penetrating radar reflections using time-domain reflectometry and sedimentological analyses: Sedimentology, 47, 435-450.
Vandenberghe, J., and van Ovenneeren, R.A., 1999, Ground penetrating radar images of selected fluvial deposits in the Netherlands: Sedimentary Geology, 128, 245-270.
Welch, B.C., Pfeffer, W.T., Harper, J.T., and Humphrey, N.F., 1998, Mapping subglacial surface of temperate valley glaciers by two-pass migration of a radio-echo sounding survey: Journal of Glaciology, V. 44, no. 146, 164-170.
Yilmaz, O., 1987, Seismic data processing: Society of Exploration Geophysicists, Tulsa, OK.
Young, R.A., Deng, Z., Marfurt, K.J. and Nissen, S.E., 1997, 3-D dip filtering and coherence applied to GPR data: A study: The Leading Edge, 16, 921-928.
Young, R.A., and Sun, J., 1999, Revealing stratigraphy in ground-penetrating radar data using domain filtering: Geophysics, 64, 435-442.
Young, R., Peterson, B., and Slatt, R., 1999, Imaging of turbidite outcrop analogs using ground-penetrating radar: Annual Meeting Abstracts, Society of Exploration Geophysicists, 429-432.
Xia, J., Weis, T., Franseen, E., and Miller, R., 2001, Ground truth of ground-penetrating radar data at a limestone quarry: Prepared for oral presentation at SAGEEP 2001 Annual Meeting of Environmental and Engineering Geophysical Society, March 4-7, 2001, Denver, CO.
Kansas Geological Survey, Geophysics
Placed online Sept. 21, 2007, original report dated 2001
Comments to webadmin@kgs.ku.edu
The URL for this page is http://www.kgs.ku.edu/Geophysics/OFR/2001/35/index.html