|
|
|
|
Progress Report on Preliminary Interpretation and the Third Monitoring 3-D Seismic Survey--Fig. 6 |
|
|
|||
Return to Site Visit report...
Figure 6A--Baseline Survey-Color representation of instantaneous frequency for a 24 msec-thick slice at a depth of around 560 msec for the baseline 3-D survey conducted when the field was fully pressurized with water and just prior to the first injection of CO2.
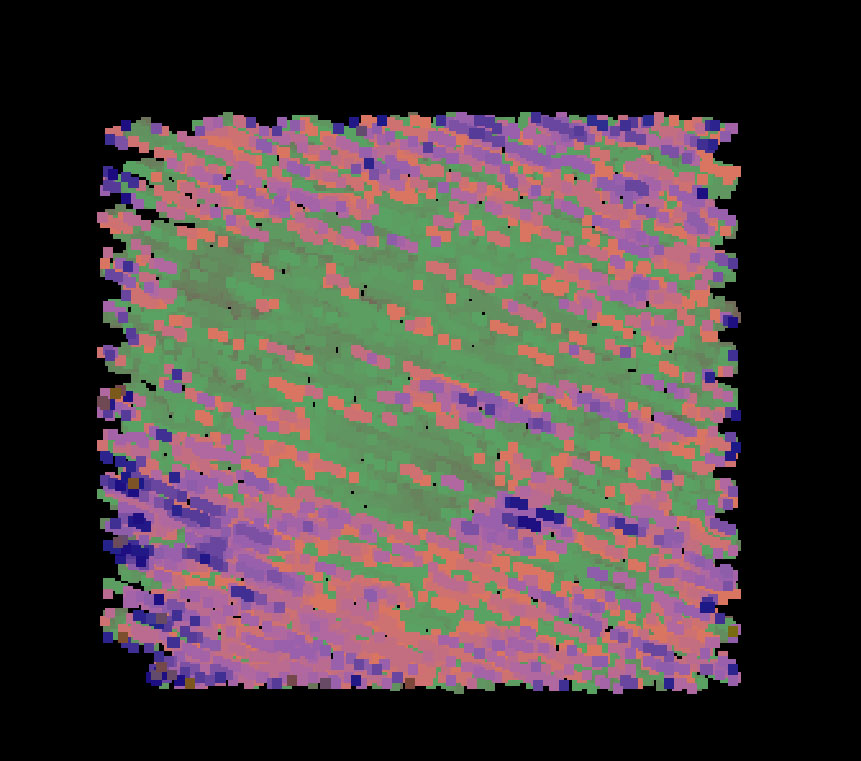
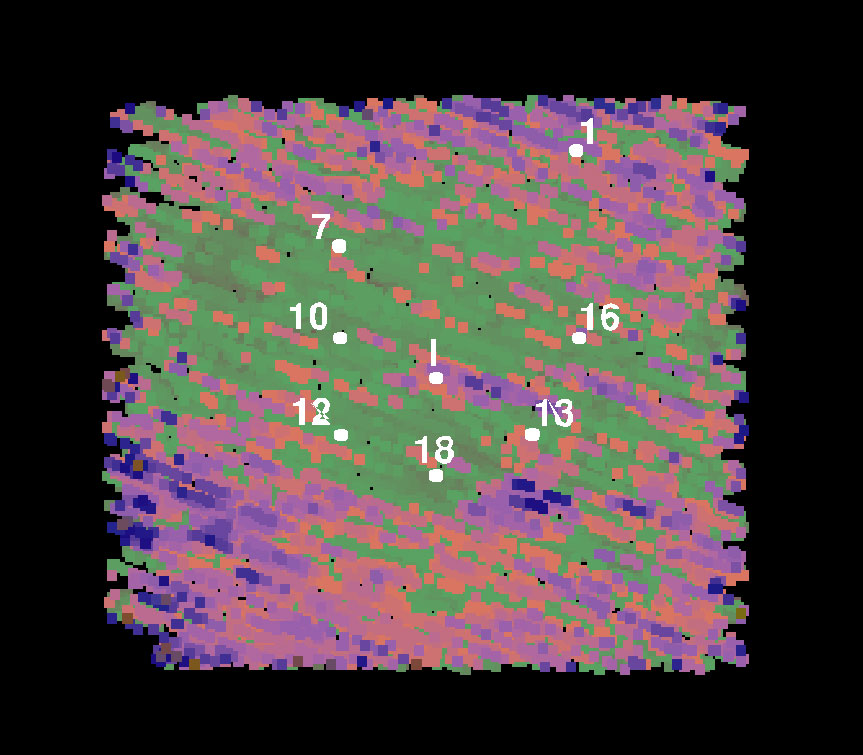
Figure 6B--Same plot with wells located. Well locations (coordinates based on conversions from legal descriptions) are placed to improve spatial awareness of the key locations around the field.
Return to Site Visit report...
|
Kansas Geological Survey, 4-D Seismic Monitoring of CO2 Injection Project Placed online July 22, 2004 Comments to webadmin@kgs.ku.edu The URL is HTTP://www.kgs.ku.edu/Geophysics/4Dseismic/Reports/Jun23_2004/fig6.html |