|
|
|
|
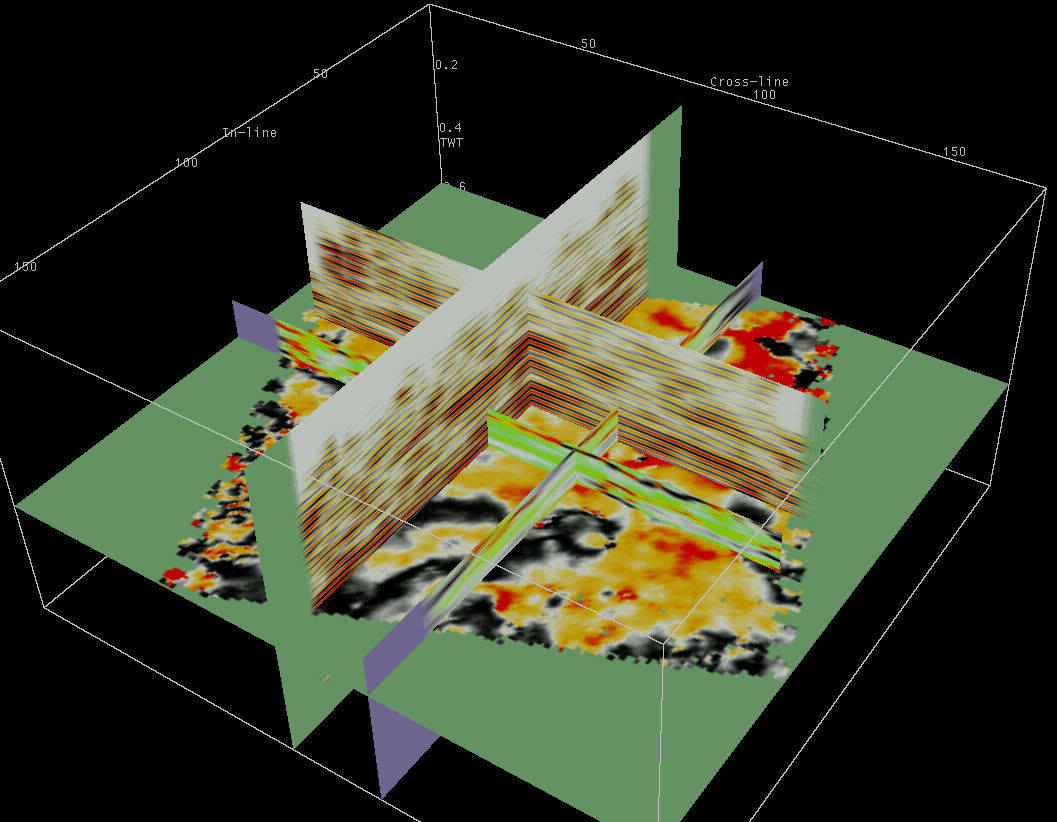
Progress Report on Preliminary Interpretation and the Third Monitoring 3-D Seismic Survey--Fig. 5 |
|
|
|||
Return to Site Visit report...
Figure 5--Vertical cross-line and in-line color wiggle trace displays intersected by the 2-D time slice from near the L-KC "C" interval. Correlating the time slice with reservoir tops as defined by well logs results in an excellent match between structure and amplitude. Reds are structurally higher than yellows, which are then higher than the blacks. Average instantaneous frequency in-line and cross-line sections (low is green and high is red) for a sub-volume around the target zone is shown.
Return to Site Visit report...
|
Kansas Geological Survey, 4-D Seismic Monitoring of CO2 Injection Project Placed online July 22, 2004 Comments to webadmin@kgs.ku.edu The URL is HTTP://www.kgs.ku.edu/Geophysics/4Dseismic/Reports/Jun23_2004/fig5.html |