|
|
|
|
Progress Report on Preliminary Interpretation and the Third Monitoring 3-D Seismic Survey--Fig. 11 |
|
|
|||
Return to Site Visit report...
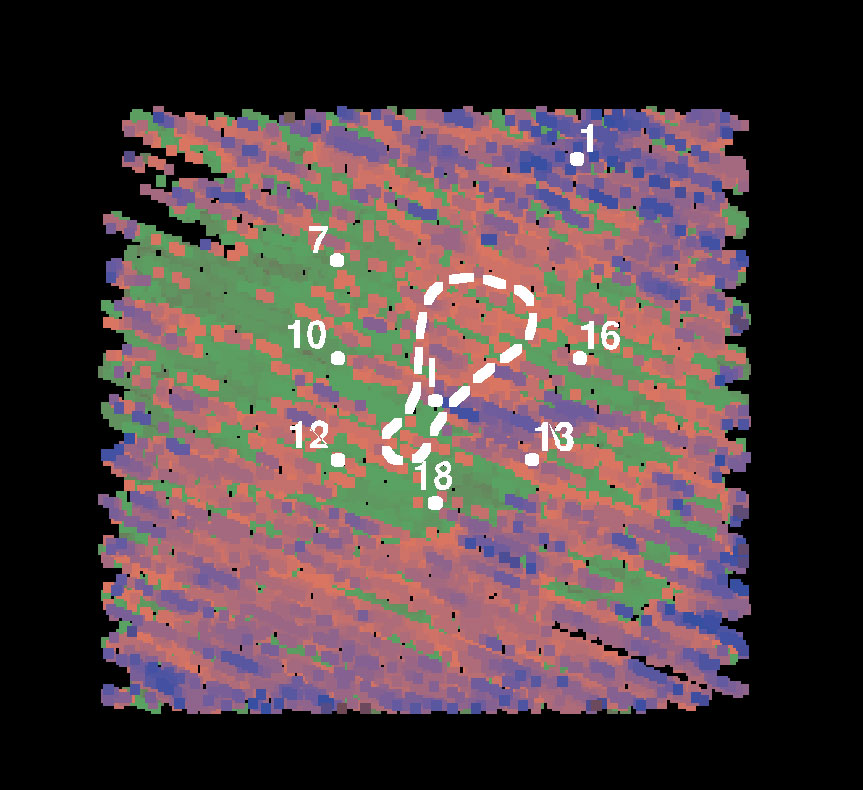
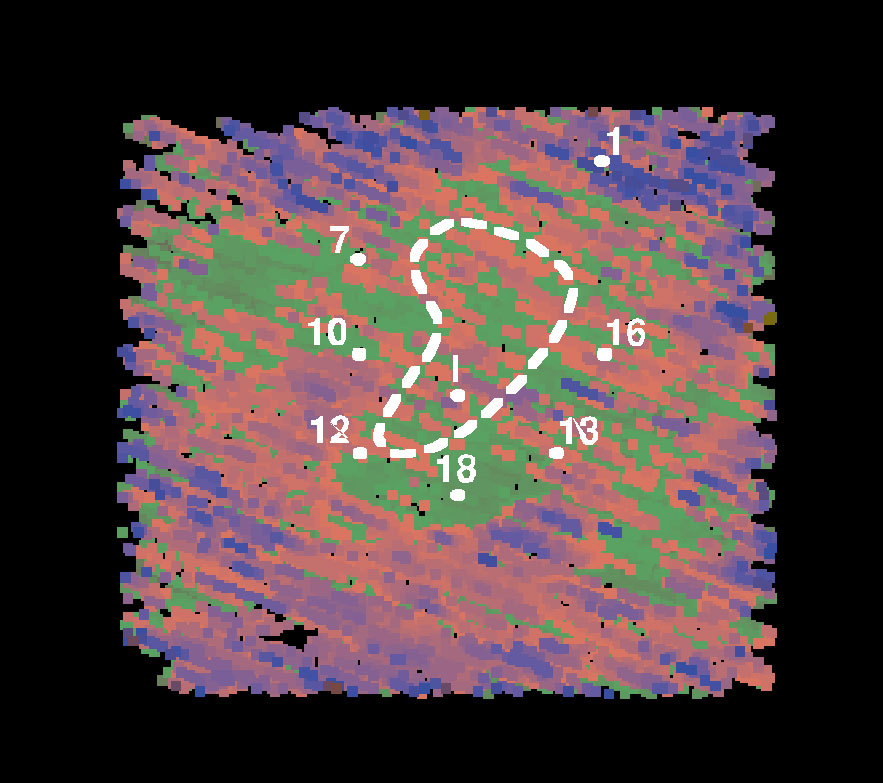
Figure 11--Monitor survey one (first image) and monitor survey two (second image) with the areas possessing the greatest and most consistent change relative to the baseline survey outlined with a dashed line. These areas of greatest change are not necessary numerically consistent with each other, but they do, from a relative perspective, contain the set of cells that define the greatest overall relative change.
Return to Site Visit report...
|
Kansas Geological Survey, 4-D Seismic Monitoring of CO2 Injection Project Placed online July 22, 2004 Comments to webadmin@kgs.ku.edu The URL is HTTP://www.kgs.ku.edu/Geophysics/4Dseismic/Reports/Jun23_2004/fig11.html |