|
|
|
|
Progress Report on Preliminary Interpretation and the Third Monitoring 3-D Seismic Survey--Fig. 10 |
|
|
|||
Return to Site Visit report...
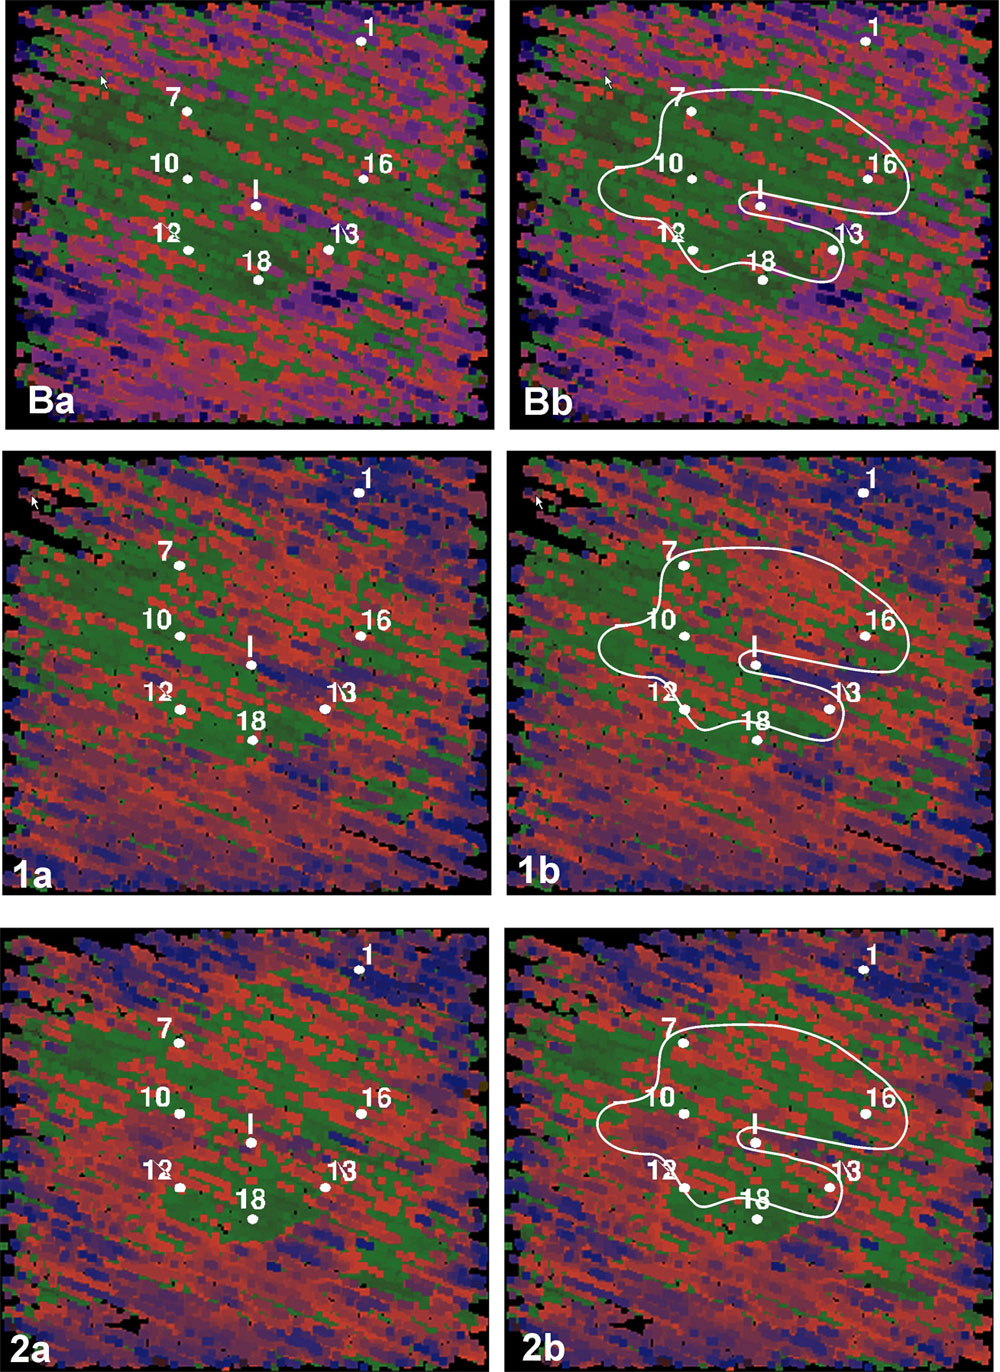
Figure 10--Comparison of baseline (B), monitor 1 (1), and monitor 2 (2) IF plots with wells located (a). The area highlighted possessed notable changes in data character, intensity, and/or texture between the three surveys. Changes between surveys are not necessary consistent due to a variety of reasons (equalization, changes in reservoir, etc.), but the changes observed within the highlighted area seem to suggest that as the CO2 has progressed the subsurface in proximity to the injector is experiencing changes.
Return to Site Visit report...
|
Kansas Geological Survey, 4-D Seismic Monitoring of CO2 Injection Project Placed online July 22, 2004 Comments to webadmin@kgs.ku.edu The URL is HTTP://www.kgs.ku.edu/Geophysics/4Dseismic/Reports/Jun23_2004/fig10.html |