|
|
|
|
Processing, Baseline and First Three Surveys--Fig. 14 |
|
|
|||
Return to Processing report...
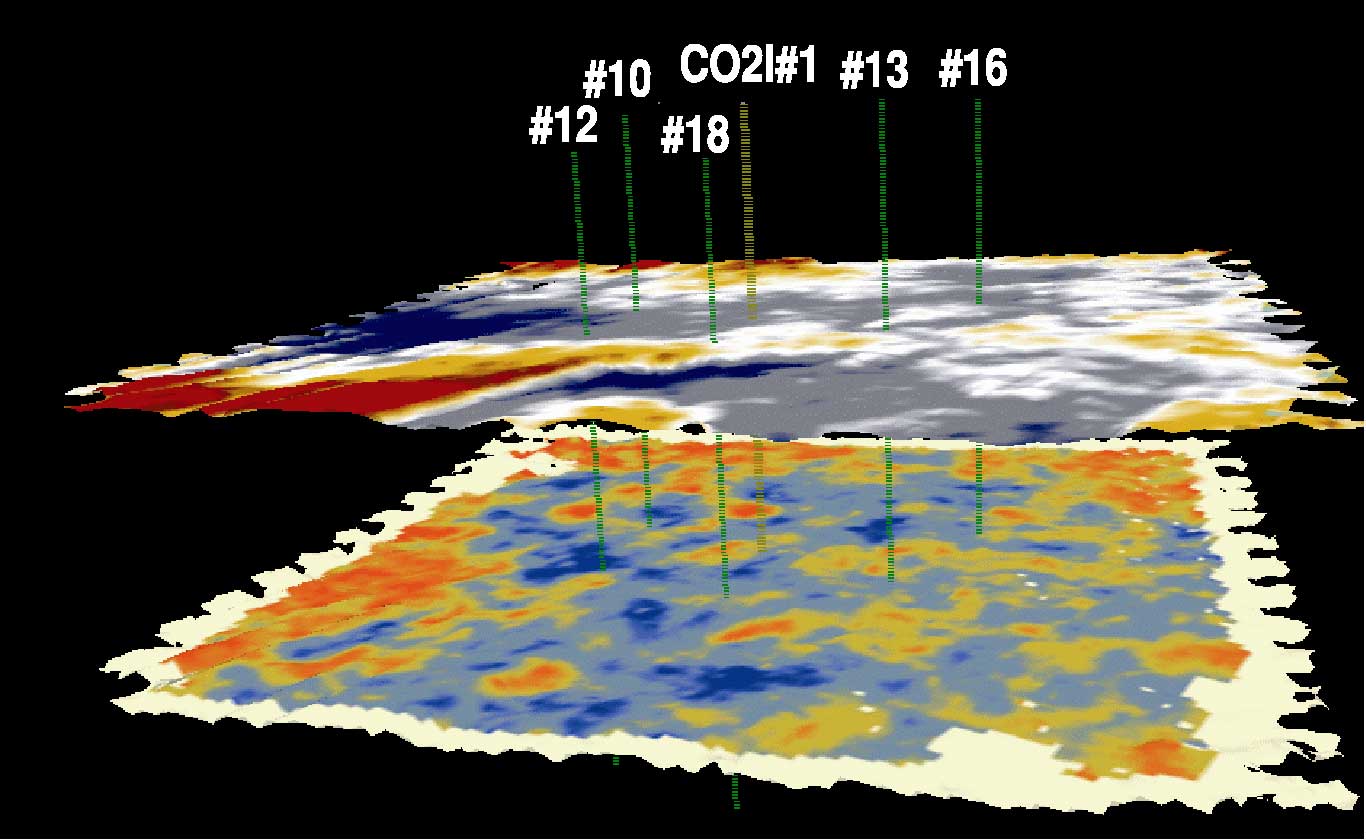
Figure 14--Similarity "seismic facies" map on bottom of diagram. Highest similarity is shown in blue and lowest similarity shown in red. The better reservoir properties occur in blue areas as demonstrated by preferred (faster) EOR-fluid movement in those areas and generally in a SW-NE trend. Well No. 13 has had delayed response as a result of being separated from a CO2 injection well (yellow) by lower (golden-red) quality reservoir properties. The distribution and geometries associated with similarity seismic facies patterns are suggestive of a complex ooid shoal depositional motif, which is supported by oolitic lithofacies being the known reservoir in this interval (image approx. 0.75 mi. square). Upper map in diagram is a time structural map showing highest areas in red and lowest areas in blue.
Return to Processing report...
|
Kansas Geological Survey, 4-D Seismic Monitoring of CO2 Injection Project Placed online April 14, 2005 Comments to webadmin@kgs.ku.edu The URL is HTTP://www.kgs.ku.edu/Geophysics/4Dseismic/Process/Nov_2003/fig14.html |